

Abstract
Introduction
Prevalence of obesity is rising in Latin America, is increasingly affecting socially disadvantaged groups, particularly women. Conditional cash transfers are recently established welfare interventions in the region. One, Familias en Accion, transfers ~20% of average monthly income to women in Colombia’s poorest families. Previous work has found that families buy more food as a result.
We tested the hypothesis that participation in Familias would be associated with increasing body mass index (BMI) in participating women
Methods
Women from participating areas and control areas (matched on environmental and socioeconomic criteria) were surveyed in 2002 and 2006. Pregnant, breast-feeding or women aged<18 or with BMI<18.5kg/m2 were excluded. The sample comprises 835 women from control and 1238 from treatment areas. Because some treatment areas started Familias shortly before baseline data collection, a dummy variable was created that identified exposure independent of time-point or area. Follow-up was 61.5%.
BMI was measured by trained personnel using standardized techniques. Overweight was defined as BMI>25kg/m2 and obesity as >30kg/m2. The effect of Familias was estimated using linear regression (or logistic regression for dichotomous outcomes) in a double-difference technique, controlling for several individual, household and area characteristics, including parity and baseline BMI, using robust standard-errors clustered at area-level in an intention-to-treat analysis.
Results
At baseline, women’s mean age was 33.3 years and mean BMI 25.3kg/m2; 12.3% women were obese. After adjustment, exposure to Familias was significantly associated with increased BMI (β=0.25, 95% CI 0.03, 0.47; p=0.03). Age (β=0.09; 95%CI 0.06, 0.13; p<0.001) and household wealth (β=0.78; 95%CI 0.41, 1.15; p<0.001) were also positively associated with BMI. Familias was also associated with increased odds of obesity (O.R.=1.27 95%CI 1.03, 1.57; p=0.03), as was age (O.R.=1.04; 95%CI 1.02, 1.06; p=0.001).
Conclusion
Conditional cash transfers to poor women in Colombia are independently associated with increasing BMI and obesity risk. Although conditional cash transfers are generally regarded as popular and successful schemes, parallel interventions at individual, household and community level are needed to avoid unanticipated adverse outcomes.
1. Introduction
Colombia, as elsewhere, is experiencing rapidly increasing rates of obesity. Of particular concern is the disproportionate burden of disease suffered by the socioeconomically disadvantaged: amongst women aged 15-49 in the lowest national wealth quintile, prevalence increased from 10.8 to 15.0% between 2005 and 2010, compared to a marginal increase from 12.0 to 12.6% in women in the highest quintile[1].
The country ranks 79 on the human development index with a per capita GDP of $9800USD. Socioeconomic inequity is a particular problem: 45.5% of Colombians live below the poverty line and Gini coefficient in 2009 was 0.587, the highest in South America[2]. Familias en Acción is a government programme that attempts to redress this situation. Known as a “conditional cash transfer scheme (CCTS)”, eligible families receive 40,000 pesos (around US$15) per month if they have children aged 0 to 7, as long as they ensure up to date immunisation and regular health checks. Additional payments of 14,000 pesos (around US$5.5) are made for each child regularly attending primary school and 28,000 pesos (around US$11) for each child regularly attending secondary school (transfer amounts are those current at the time of this study). Familias began in 2002; as of 2010, some 2.6 million families were enrolled[3].
CCTS such as Familias are increasingly prominent welfare programmes across the world, operating in over 20 countries[4]. A study of the Mexican CCTS showed that greater programme exposure was associated with weight gain in participating adults, although unexposed adults were not included in this study[5]. Prior work has shown that participation in Familias is associated with approximately a 15% increase in household income and a commensurate increase in spending on food compared to unexposed controls[6]. We tested the hypothesis that participation in Familias was associated with increased body mass index in women.
2. Methods
2.1 Design, setting and participants
Familias was implemented at area-level: Colombia comprises 1,060 municipalities, 622 of which met all of the following four qualifying criteria: (i) less than 100,000 inhabitants and not a district capital; (ii) sufficient education and health infrastructure to enable participants to comply with the programme’s conditions; (iii) a bank to enable cash transfers to programme participants and (iv) administrative office with up-to-date census, welfare and service infrastructure data. All 622 implemented Familias and are henceforth termed ‘treatment’ areas. Post-hoc analysis demonstrated that the most common reason for not qualifying was absence of a bank. An evaluation sample was constructed by randomly selecting 57 treatment areas from the 622 implementing the programme. These were matched with 65 control areas within 25 strata based on region, health/education infrastructure, population, land area and quality of life score, based on routine government data.
Households eligible for Familias are those from Colombiás lowest income sextile (identified by routine government data) with children under-17, living in treatment areas. Approximately 100 eligible households were randomly sampled from each treatment and control area, generating an analytic sample of 11,428 households.
Within each household, height and weight were measured in children aged under-7 and their biological mothers. We report outcomes for this group of women, restricting the sample to women aged 18 or older who were completely observed at baseline and follow-up. Women underweight (BMI <18.5kg/m2) at baseline and pregnant or breastfeeding women at either study phase are excluded.
Data were anonymised and ethical approval from University College London was obtained. Participants signed consent to participate in the study and data were anonymised prior to analysis.
2.2 Explanatory, outcome and mediating variables
Three surveys took place between mid-2002 and early 2006. This analysis reports data from the first and third surveys. Treatment/control status was determined from programme administrative records.
Height and weight were measured by 18 trained fieldworkers using a protocol based on established manuals[7], with standardised measuring boards (Shorr Productions, Olney, Maryland USA) and electronic scales (Seca 770, Vogel & Halke, Hamburg, Germany). BMI was calculated and analysed as a continuously distributed outcome. “Overweight” (BMI ≥ 25kg/m2) and “obese” (BMI ≥ 30kg/m2) were analysed as dichotomous outcomes. Cases with missing anthropometrics at baseline or follow-up were deleted list-wise from the sample and patterns of missingness explored.
The conceptual framework established by Friel et al.[8] was used to inform the selection of further co-variates. As well as individual-biological factors such as food intake and energy expenditure, this model emphasizes the social determinants of obesity such as income, education, living conditions, social capital, remoteness and infrastructure. The model is particularly sensitive to health inequity and the shifting burden of obesity towards poorer households, hence is apt given Familiaś objectives.
At the individual level, age and parity were treated as continuous variables. Completed formal education was categorized as ‘primary education incomplete’, ‘primary education complete’, ‘secondary education complete’ or ‘higher education’. Community participation was treated as a dummy variable, equal to 1 if the woman reported participation in any sporting, religious, civic or political organization in the past six months. At the household level, household size (persons) and crowding (persons per room) were treated as continuous variables. Household wealth was proxied from total household spending in the past two weeks and log-transformed. Presence of piped water and rural/semi-urban location (referring to the presence of facilities such as a town hall, a school or health centre in contrast to more remote communities) were treated as dichotomous variables. Individual and household-level covariates were self-reported. At the area-level, population (from 2000 census figures) and number of families eligible for Familias were log-transformed. Proportion of houses with piped water (taken from household surveys) and log-ratio of doctors to population were included as markers of infrastructure, as was presence of a bank since this was known to be the most common criterion on which treatment and matched control areas differed (both obtained from local facilities surveys undertaken as part of the evaluation). Average travel-time to the nearest medical centre (from household surveys) was included as a proxy for remoteness. Quality of life score (taken from a routine national survey asking about local amenities) and average log-household wealth were included as additional area-level co-variates.
All co-variates were measured at baseline except travel time to medical centre (recorded at first follow-up) and parity (second follow-up). Cases with missing co-variates were deleted list-wise from the sample and patterns of missingness explored.
Measures to ensure reliability of the data included extensive questionnaire piloting and fieldworker training, use of computer assisted personal interview (CAPI) technology, direct observation of ~10% of surveys by quality controllers and repeat measures on a subset of participants. Efforts to minimize attrition included widely publicized support for Familias from civic leaders and participants, regular contact with participants via newsletters and a website and efforts to trace households that had moved.
2.3 Statistical analysis
Since a small number of biologically implausible meausurements suggested data-entry error, anthropometrics beyond the 1% or 99% centiles at baseline or follow-up were censored.
Differences by attrition are reported in Table 1. Baseline differences by exposure were explored using two-tailed t-test (for differences in means for continuously distributed variables) or chi-squared test (for categorical variables) and are reported in Table 2.
Table 1.
Characteristics of women at baseline by attrition (figures are percentages unless otherwise indicated)
| ANALYTIC SAMPLE | LOST TO FOLLOW-UP | |||||||
|---|---|---|---|---|---|---|---|---|
| Mean | 95%CI | Mean | 95%CI | t/χ2 | p | |||
|
|
|
|
||||||
| Individual level co-variates | ||||||||
| BMI (kg/m2) | 25.26 | 25.09 | 25.43 | 25.29 | 25.07 | 25.51 | 0.19 | 0.84 |
| age (years) | 33.30 | 33.00 | 33.60 | 34.00 | 33.51 | 34.50 | 2.55 | 0.01 |
| community participation | 23.9 | 22.0 | 25.7 | 25.8 | 23.4 | 28.2 | 1.28 | 0.20 |
| parity (number of reported live births) | 4.35 | 4.25 | 4.45 | 5.07 | 4.82 | 5.32 | 5.80 | <0.001 |
| primary education incomplete | 58.2 | 56.1 | 60.3 | 67.9 | 63.6 | 72.2 | 10.85 | |
| primary education complete | 34.7 | 32.7 | 36.8 | 28.1 | 24.0 | 32.2 | ||
| secondary education complete | 5.7 | 4.7 | 6.7 | 3.3 | 1.7 | 5.0 | 0.01 | |
| further education | 1.4 | 0.9 | 1.9 | 0.7 | 0.00 | 1.4 | ||
| Household level co-variates | ||||||||
| household size (persons) | 6.15 | 6.05 | 6.25 | 6.10 | 5.97 | 6.24 | −0.56 | 0.58 |
| persons per room | 2.92 | 2.85 | 2.99 | 2.87 | 2.79 | 2.96 | −0.82 | 0.41 |
| log household wealth (pesos) | 12.84 | 12.82 | 12.86 | 12.82 | 12.79 | 12.85 | −1.02 | 0.30 |
| piped water to household | 63.0 | 60.9 | 65.0 | 57.4 | 54.7 | 60.1 | −3.24 | <0.01 |
| semi-urban location | 47.9 | 45.8 | 50.1 | 48.3 | 45.5 | 51.0 | 0.18 | 0.86 |
| Area level co-variates | ||||||||
| log population | 9.97 | 9.93 | 10.00 | 9.94 | 9.89 | 9.98 | −0.87 | 0.38 |
| log eligible families | 6.71 | 6.66 | 6.75 | 6.70 | 6.64 | 6.76 | −0.17 | 0.85 |
| quality of life index | 54.25 | 53.83 | 54.67 | 54.76 | 54.21 | 55.31 | 1.45 | 0.15 |
| ratio of doctors to population | − 1.31 | −1.33 | −1.28 | − 1.27 | −1.30 | −1.25 | 1.95 | 0.05 |
| average household wealth | 12.94 | 12.93 | 12.94 | 12.93 | 12.92 | 12.94 | −1.15 | 0.25 |
| average travel time to medical centre | 36.64 | 35.82 | 37.47 | 38.10 | 37.03 | 39.19 | 2.12 | 0.03 |
| proportion of households with piped water | 62.7 | 61.8 | 63.6 | 60.1 | 58.9 | 61.3 | −3.52 | <0.01 |
| presence of a bank | 74.9 | 73.0 | 76.8 | 75.4 | 73.1 | 77.8 | 0.32 | 0.75 |
Table 2.
Characteristics of women at baseline by exposure (figures are percentages unless otherwise indicated)
| CONTROL | TREATMENT | |||||||
|---|---|---|---|---|---|---|---|---|
| Mean | 95% CI | Mean | 95% CI | t/χ2 | p | |||
|
|
|
|
||||||
| Individual level co-variates | ||||||||
| BMI (kg/m2) | 25.43 | 25.21 | 25.65 | 25.17 | 25.00 | 25.34 | 1.91 | 0.06 |
| age (years) | 33.05 | 32.67 | 33.44 | 33.91 | 33.55 | 34.27 | −3.10 | <0.01 |
| community participation | 17.5 | 15.4 | 19.5 | 29.4 | 27.4 | 31.4 | −7.97 | <0.001 |
| parity (number of reported live births) | 4.44 | 4.29 | 4.59 | 4.50 | 4.38 | 4.62 | −0.62 | 0.54 |
| primary education incomplete | 58.4 | 55.8 | 61.1 | 61.5 | 59.3 | 63.6 | 3.78 | |
| primary education complete | 34.9 | 32.3 | 37.4 | 32.2 | 30.1 | 34.2 | ||
| secondary education complete | 5.3 | 4.1 | 6.4 | 5.3 | 4.3 | 6.2 | 0.29 | |
| further education | 1.4 | 0.8 | 2.0 | 1.1 | 0.6 | 1.4 | ||
| Household level co-variates | ||||||||
| household size (persons) | 6.20 | 6.08 | 6.33 | 6.08 | 5.99 | 6.18 | 1.48 | 0.13 |
| persons per room | 3.08 | 2.99 | 3.18 | 2.79 | 2.72 | 2.85 | 5.25 | <0.001 |
| log household wealth (pesos) | 12.76 | 12.73 | 12.79 | 12.88 | 12.85 | 12.90 | −5.70 | <0.001 |
| piped water to household | 64.1 | 61.5 | 67.6 | 58.6 | 56.5 | 60.8 | 3.17 | <0.01 |
| semi-urban location | 55.5 | 52.9 | 58.2 | 43.1 | 41.0 | 45.3 | 7.12 | <0.001 |
| Area level co-variates | ||||||||
| log population | 9.80 | 9.76 | 9.85 | 10.06 | 10.02 | 10.09 | −9.13 | <0.001 |
| log eligible families | 6.25 | 6.19 | 6.31 | 7.01 | 6.97 | 7.05 | −21.37 | <0.001 |
| quality of life index | 55.65 | 55.08 | 56.22 | 53.65 | 53.24 | 54.06 | 5.74 | <0.001 |
| ratio of doctors to population | − 1.18 | −1.20 | −1.16 | − 1.37 | −1.39 | −1.35 | 11.87 | <0.001 |
| average household wealth | 12.90 | 12.89 | 12.92 | 12.95 | 12.94 | 12.96 | −6.15 | <0.001 |
| average travel time to medical centre | 36.46 | 35.19 | 37.72 | 37.71 | 37.01 | 38.41 | −1.83 | 0.07 |
| proportion of households with piped water | 65.6 | 64.3 | 66.8 | 59.2 | 58.3 | 60.0 | 8.60 | <0.001 |
| presence of a bank | 38.2 | 36.2 | 41.8 | 100.0 | 99.6 | 100.2 | −56.00 | <0.001 |
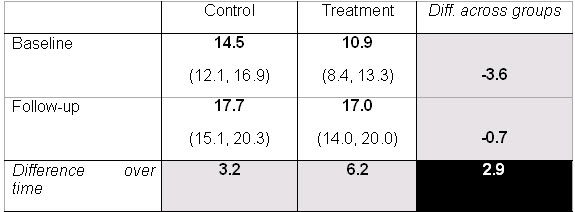
Given non-random programme implementation, a double-difference methodology was employed to estimate programme effects. This model allows for the outcome of interest to differ between treatment and control areas at baseline and for a secular trend in the outcome independent of the programme. Baseline difference in outcome between treatment and control areas is subtracted from the difference at follow-up to create a dependent variable that allows the net effect of the programme to be estimated, as shown in Figures 2-4.
Figure 2. crude BMI (kg/m2, 95% CI) and double-difference*.

*Women from pre-exposed areas not included; differences inexact due to rounding.
Figure 4. crude prevalence (%, 95% CI) of obesity and double-difference.
The main assumptions of the double-difference method to produce an unbiased estimator are two-fold: that any secular trend is not substantially different between exposed and unexposed communities and that co-variate values do not change over time. Prior work examining trends in key co-variates immediately prior to inception of Familias suggests that the first assumption holds[9]. Regarding the second, co-variates were selected, as far as possible, to be fixed or net-neutral across exposure groups (such as age).
In 25 of the treatment areas, political pressure meant that the programme started some six months before baseline data collection was completed. Thus three types of area can be defined: those where exposure began before baseline data collection (‘pre-exposed’ areas), those where exposure began after baseline data collection (‘exposed’ areas) and controls. Discarding women from pre-exposed areas represents a significant data loss of around half the treatment cohort. Instead, the double-difference approach offers a robust method to handle this complication, by creating a dummy variable equal to 1 whenever the programme is operating, independent of time or area.
The regression estimated is:
where
Yi = outcome of interest for individual i
Time = 0 if baseline, 1 if follow-up
Comi = 2 if pre-exposed area, 1 if exposed area, 0 if control
Familiasi,T = 1 if Familias was in operation for individual i at time T, 0 if not
Xi = all (observed) co-variates
εi = error term
The coefficient of interest is β3. This identifies the effect of the Familias independent of time or area effects. Baseline BMI followed a normal distribution and OLS regression was used to estimate the effect of the programme on BMI and logistic regression for effects on odds of overweight or of obesity.
Intention-to-treat analyses are reported; that is, households are analysed according to the treatment/control status of their area at baseline, whether or not they took up the offer of Familias or whether they changed status between baseline and follow-up. It is known that only around 85% of qualifying households took up the offer of Familias and that a small number changed status between baseline and follow-up.
Robust standard errors are reported, clustered at area-level. This is the coarsest and most conservative cluster-level hence it also accounts for non-independence at individual level. Intercooled Stata-11 was used for all analyses.
3. Results
3.1 Participant and sample attrition
Anthropometrics were recorded in 5513 women. Of these, 1347 women from control and 2023 from treatment areas met inclusion criteria. 835 (62.0%) participants from control and 1238 (61.2%, χ2=0.21, p=0.64) from treatment areas were re-observed at follow-up and form the analytic sample. A participant flow-diagram is given in Figure 1.
Figure 1.

Participant flow-chart (this could appear as web supplementary material)
Women lost to follow-up were similar in baseline BMI to the analytic sample (25.3 vs 25.3kg/m2, t=0.19, p=0.85), as shown in Table 1. They were, however, slightly older (34.0 vs 33.3 years, t=2.55, p=0.01), with lower formal educational attainment (χ2=10.85, p=0.01) and reported greater parity (5.1 vs. 4.4 live births, t=5.8, p<0.001). Within those lost to follow-up, women from treatment areas were older (34.5 vs 33.3 years, t=2.23, p=0.03) and from more wealthy households (12.9 vs 12.8 log pesos, t=2.21, p=0.03) than women from control areas.
3.2 Missing data
181 (5.1%) women were missing one or more co-variates and deleted list-wise from the sample. Missingness was not significantly associated with treatment/control status (χ2=4.4, p=0.11) or other likely predictors of follow-up BMI including baseline BMI, age, parity, educational level and household wealth (all p>0.1).
3.3 Baseline characteristics of the analytic sample
Mean baseline BMI was 25.4kg/m2 in control and 25.2kg/m2 (t=1.91, p=0.06) in treatment areas. Women from treatment areas were older (33.9 vs. 33.1 years, t=3.10, p<0.01), lived in less crowded (2.8 vs. 3.1 persons per room, t=5.3, p<0.01) and wealthier households (12.9 vs. 12.8 log pesos, t=5.70, p<0.01). Several differences were also apparent at area-level, as shown in Table 2, all of which were entered into the regression models. A supplementary table splitting treated women into exposed and pre-exposed groups is available as a web appendix.
3.4 Outcomes of interest
A crude indication of the effect of Familias can be obtained from double-difference tables. These data suggest that BMI and rates of overweight and obesity increased in all areas with time, but more rapidly in treatment areas than in control areas (Figures 2-4).
Multivariate analysis demonstrates a statistically significant association between exposure to Familias and increasing BMI (β=0.25, 95% CI 0.03, 0.47; p=0.03; Table 3). Age was positively associated with BMI (β=0.09; 95%CI 0.06, 0.13; p<0.001) as was household wealth (β=0.78; 95%CI 0.41, 1.15; p<0.001). After adjustment, parity was negatively associated (β=−0.14; 95%CI −0.24, −0.04; p=0.01) in this population.
Table 3. Determinants of nutritional outcomes.
| BMI | OVERWEIGHT | OBESE | ||||||||||
|---|---|---|---|---|---|---|---|---|---|---|---|---|
| Coefficient | robust S.E. | p-value | O.R. | robust S.E. | p-value | O.R. | robust S.E. | p-value | ||||
| Programme effect | 0.25 | * | 0.11 | 0.03 | 1.06 | 0.09 | 0.46 | 1.27 | * | 0.14 | 0.03 | |
| Individual level co-variates | ||||||||||||
| age | 0.09 | *** | 0.02 | <0.001 | 1.04 | *** | 0.01 | <0.001 | 1.04 | * | 0.01 | <0.001 |
| community participation | 0.00 | 0.00 | 0.78 | 1.00 | 0.00 | 0.60 | 1.00 | 0.00 | 0.67 | |||
| parity | −0.14 | ** | 0.05 | 0.01 | 0.96 | 0.02 | 0.11 | 0.94 | 0.04 | 0.12 | ||
| primary education complete | −0.27 | 0.19 | 0.15 | 0.90 | 0.09 | 0.27 | 0.84 | 0.11 | 0.20 | |||
| secondary education complete | −0.79 | * | 0.33 | 0.02 | 0.66 | * | 0.11 | 0.01 | 0.49 | * | 0.15 | 0.02 |
| further education | −0.15 | 0.69 | 0.82 | 1.37 | 0.52 | 0.40 | 0.39 | 0.23 | 0.11 | |||
| Household level co-variates | ||||||||||||
| household size (persons) | −0.09 | 0.05 | 0.05 | 0.94 | ** | 0.02 | 0.01 | 0.95 | 0.03 | 0.22 | ||
| persons per room | 0.02 | 0.06 | 0.70 | 1.01 | 0.03 | 0.81 | 1.01 | 0.04 | 0.80 | |||
| log household wealth (pesos) | 0.78 | *** | 0.19 | <0.001 | 1.44 | *** | 0.12 | <0.001 | 1.32 | 0.18 | 0.05 | |
| piped water to household | 0.00 | 0.00 | 0.63 | 1.00 | 0.00 | 0.47 | 1.00 | 0.00 | 0.70 | |||
| semi-urban location | 0.00 | 0.00 | 0.71 | 1.00 | 0.00 | 0.63 | 1.00 | ** | 0.00 | 0.01 | ||
| Area level co-variates | ||||||||||||
| log population | −0.38 | * | 0.18 | 0.04 | 0.81 | ** | 0.06 | 0.01 | 0.91 | 0.09 | 0.36 | |
| log eligible families | 0.15 | 0.14 | 0.29 | 1.07 | 0.07 | 0.32 | 1.08 | 0.08 | 0.31 | |||
| quality of life index | 0.00 | 0.01 | 0.78 | 1.00 | 0.01 | 0.97 | 1.07 | 0.08 | 0.36 | |||
| ratio of doctors to population | −0.23 | 0.21 | 0.27 | 0.94 | 0.10 | 0.52 | 1.00 | 0.01 | 0.82 | |||
| average household wealth | −0.55 | 0.57 | 0.33 | 0.83 | 0.24 | 0.52 | 0.82 | 0.31 | 0.59 | |||
| average travel time to medical centre | 0.00 | 0.01 | 0.75 | 1.00 | 0.00 | 0.91 | 0.97 | 0.00 | 0.49 | |||
| proportion of households with piped water | 0.00 | 0.00 | 0.35 | 1.00 | 0.00 | 0.64 | 0.99 | * | 0.00 | 0.03 | ||
| presence of a bank | 0.14 | 0.36 | 0.71 | 1.00 | 0.16 | 0.95 | 1.23 | 0.28 | 0.36 | |||
p<0.05
p<0.01
p<0.001
compared to primary education incomplete
Logistic regression on odds of overweight did not demonstrate a statistically significant relationship with exposure to Familias (O.R.=1.06; 95%CI 0.90,1.26; p=0.46). Age (O.R.=1.04; 95%CI 1.02, 1.05; p<0.001) and household wealth (O.R.=1.44; 95%CI 1.23, 1.70; p<0.001) were positively associated.
Logistic regression on odds of obesity did, however, demonstrate a statistically significant relationship (O.R.=1.27 95%CI 1.03, 1.57; p=0.03). A positive relationships was also seen with age (O.R.=1.04; 95%CI 1.02, 1.06; p=0.001).
3.5 Subgroup analysis
Analysis excluding women in pre-exposed areas yields a similar although non-significant point estimate for the effect of Familias on BMI (β=0.18; 95%CI −0.07, 0.42; p=0.16) and overweight (O.R.=1.10; 95%CI 0.91, 1.32; p=0.32). Programme effect on odds of obesity appears similar and remains statistically significant (O.R.=1.33; 95%CI 1.05, 1.69; p=0.02).
4. Discussion
4.1 Key results
The study finds that participation in Familias appears associated with an increase in women’s BMI, after controlling for several individual, household and community level co-variates and time-invariant unobserved co-variates. Increasing age and household wealth also appear associated. Although the BMI increase demonstrated is small (around 0.2 kg/m2), it is associated with significantly increased odds of obesity.
4.2 Strengths and limitations
This prospective study collected data on a wide range of individual, household and area level variables, on a panel of several thousand households. Several quality control mechanisms were implemented, including independently commissioned data collection and analysis. A conservative statistical approach was implemented, using an intention-to-treat protocol and coarsely clustered standard errors.
Follow-up rates were just over 60% and did not vary by exposure. Of those lost to follow-up, women from treatment areas were older and wealthier than those from control areas. Since analysis of determinants of baseline BMI (not shown) demonstrated that these factors are significantly positively associated with increased BMI in our population, this unevenness in attrition likely to have led to a more conservative estimate of programme effect.
Weaknesses include non-randomised evaluation and the phenomenon of pre-exposed communities. Several differences in baseline co-variates are apparent by treatment/control status, particularly at area-level. Although all are adjusted for in multi-variate analyses the possibility of residual confounding remains. It is known that most control municipalities were ineligible for Familias because of absence of a bank and other civic infrastructure. As a result, control areas are slightly poorer than treatment areas. Several mechanisms can be imagined which would lead to faster weight gain in wealthier treatment areas, unrelated to Familias. Faster expansion of fast-food outlets, sedentary leisure such as cinemas or motorized public transport would be examples.
Pre-baseline exposure in some treatment areas was an unfortunate event, which perhaps reflects the difficulties encountered when evaluating public policy. Discarding these women implies a heavy data loss, however the double-difference approach offers a robust method for including these women. It is important to note that crude data and multivariate data with and without pre-exposed areas gave similar point estimates for the effect of Familias on women’s BMI, with the full dataset yielding smaller standard errors and greater significance as expected.
4.3 Comparison with other studies
Our findings are consistent with an earlier study showing significant increases in household spending on meat, dairy, other fats and oils and cereals in Familias households. Spending on fruits and vegetables was unchanged[6].
Fernald et al[5] attempt to isolate the effect of cash in Mexico’s Progresa CCTS by analysing the effect of the cumulative amount of cash transferred to households over six years. They find that, in adults aged 18-65, a doubling of cumulative cash transferred was associated with higher BMI (β=0.83, p<0.001) and higher odds of being overweight or obese (odds ratios 1.41 to 1.57, p<0.001 to 0.03), after adjustment for covariates including household composition.
There are, however, difficulties interpreting this as an effect of programme operation since cumulative cash transferred depends on factors that may not be random[9]. For example, households with more children in school receive more cash. This could reflect a manifestation of endogenous unobservables such as child-rearing skills or social support networks.
Our finding of a positive association between household wealth and BMI contrasts with national survey data discussed earlier, which show an association between disadvantage and obesity in Colombian women. The gradient in 2005, however (around the time of our study), was less pronounced and indeed positive across the first four wealth quintiles in women[1].
4.4 Meaning of study
Obesity is recognised, particularly among women, as a driver of already high health inequities generated by nutritional deficiencies, infectious diseases, and maternal and perinatal conditions[11]. It appears that targeted cash transfers have the potential to exacerbate the problem.
CCTS are important and popular welfare interventions. Rather than an argument to terminate them, the implication is that policy must pay close attention to the complex determinants of obesity and disadvantage and try to ensure that discrete interventions to tackle one problem do not inadvertently worsen the other.
Although the drivers of obesity are relatively well described, prevention and reversal of obesity trends remains poorly understood and a major public health challenge. A recent systematic review of prevention strategies identified 24 studies covering 44 interventions and found that intensive counselling was the most cost-effective strategy with mass media campaigns as the least cost-effective[12]. It is already known that the “transitional” diets of poor communities are typically energy dense but micronutrient poor, particularly when supported by welfare programmes such as food subsidies or cash transfers[13].
Further research must focus on how programmes such as Familias can optimise the health benefits and avoid the potential adverse effects of greater material and food security. For example, the educational programme which participating women are encouraged to attend currently focuses on childcare, with little attention given to healthy eating for adults or preventive behaviours such as physical activity[14]. Redesigning the programme to be more family-oriented may be beneficial. Changes in the physical, economic, and socio-cultural environment that make healthier choices concerning diet and physical activity behaviours feasible for all social classes are also likely to be necessary[8].
Supplementary Material
Figure 3. crude prevalence (%, 95% CI) of overweight and double-difference *.

*Women from pre-exposed areas not included; differences inexact due to rounding.
Acknowledgments
Funding: IF is funded by a Medical Research Council Fellowship which mandates open access publishing (grant code G0701333). In 2001, a partnership between the Institute of Fiscal Studies (London, a research institute), Econometria (Bogotá, a research institute) and SEI (Bogotá, a company specialising in the design and collection of social surveys) was commissioned by the Colombian Government to evaluate Familias, after open tendering.
Footnotes
Copyright: The Corresponding Author has the right to grant on behalf of all authors and does grant on behalf of all authors, an exclusive licence (or non exclusive for government employees) on a worldwide basis to the Nature Publishing Group Ltd.
Competing interests: All authors have completed the Unified Competing Interest form at www.icmje.org/coi_disclosure.pdf (available on request from the corresponding author) and declare: no support from any organisation for the submitted work; no financial relationships with any organisations that might have an interest in the submitted work in the previous three years; no other relationships or activities that could appear to have influenced the submitted work.
References
- 1.Demographic and Health Surveys, Colombia, Final Reports 2005 and 2010. Bogotá, Colombia: Available from www.measuredhs.com. [Google Scholar]
- 2.United Nations Development Programme . Human Development Report 2009. New York: [Google Scholar]
- 3. http://www.accionsocial.gov.co/contenido/contenido.aspx?catID=204&conID=157.
- 4.Fiszbein A, Schady N. Conditional Cash Transfers: Reducing Present and Future Poverty. World Bank. 2009 [Google Scholar]
- 5.Fernald LCH, Gertler PJ, Hou XH. Cash Component of Conditional Cash Transfer Program Is Associated with Higher Body Mass Index and Blood Pressure in Adults. Journal of Nutrition. 2008;138(11):2250–2257. doi: 10.3945/jn.108.090506. [DOI] [PMC free article] [PubMed] [Google Scholar]
- 6.Attanasio O, Mesnard A. The Impact of a Conditional Cash Transfer Programme on Consumption in Colombia. Fiscal Studies. 2006;27(4):421–442. [Google Scholar]
- 7.Lohman TG, Roche AF, Martorell R, editors. Anthropometric standardization reference manual. Human Kinetics Books; Champaign: 1988. [Google Scholar]
- 8.Friel S, Chopra M, Satcher D. Unequal weight: equity oriented policy responses to the global obesity epidemic. BMJ. 2007;335:a1241. doi: 10.1136/bmj.39377.622882.47. [DOI] [PMC free article] [PubMed] [Google Scholar]
- 9.Attanasio O, Carlos Gomez L, Heredia P, Vera-Hernandez M. The short-term impact of a conditional cash subsidy on child health and nutrition in Colombia. The Institute of Fiscal Studies; London: 2005. http://www.ifs.org.uk/edepo/rs_fam03.pdf. [Google Scholar]
- 10.Attanasio O, Meghir C, Schady N. Mexico’s conditional cash transfer programme. Lancet. 2010 Mar 20;375(9719):980. doi: 10.1016/S0140-6736(10)60432-1. [DOI] [PubMed] [Google Scholar]
- 11.Montiero C, Conde WL, Lu B, Popkin B. Obesity and inequities in health in the developing world. Int J Obes Relat Metab Disord. 2004 Sep;28(9):1181–6. doi: 10.1038/sj.ijo.0802716. [DOI] [PubMed] [Google Scholar]
- 12.Kipping RR, Jago R, Lawlor DA. Obesity in children. Part 2: Prevention and management. BMJ. 2008;337:a1848. doi: 10.1136/bmj.a1848. [DOI] [PubMed] [Google Scholar]
- 13.Swinburn BA, Caterson I, Seidell JC, James WPT. Diet, nutrition and the prevention of excess weight gain and obesity. Public Health Nutrition. 2004;7(1A):123–146. doi: 10.1079/phn2003585. DOI: 10.1079/PHN2003585. [DOI] [PubMed] [Google Scholar]
- 14.El camino recorrido: diez años Familias en Acción. Agencia Presidencial para la Acción Social y Cooperación Internacional y Departamento de Planeación; Bogotá: 2010. [Google Scholar]
Associated Data
This section collects any data citations, data availability statements, or supplementary materials included in this article.