

Abstract
No clinically validated biomarkers exist to image tumor responses to anti-angiogenic therapy. Here we report the utility of hyperpolarized 13C magnetic resonance spectroscopy (MRS) to detect the early metabolic effects of anti-VEGF therapy. In two colorectal cancer xenograft models displaying differential sensitivity to VEGF blockade, we compared hyperpolarized MRS with measurements of tumor perfusion using dynamic contrast agent enhanced (DCE)-MRI and tumor cellularity using diffusion weighted MRI of the apparent diffusion coefficient of tissue water (ADC). In tumors sensitive to anti-VEGF therapy, 13C flux between hyperpolarized [1-13C]pyruvate and [1-13C]lactate decreased after anti-VEGF therapy and correlated with reduced perfusion. Production of [1,4-13C2]malate from hyperpolarized [1,4-13C2]fumarate increased in parallel with tumor cell necrosis, preceding any change in tumor ADC. In contrast, tumors that were less sensitive to anti-VEGF therapy showed an increase in 13C flux from hyperpolarized [1-13C]pyruvate and an increase in uptake of a gadolinium contrast agent, while tumor ADC decreased. Increased label flux could be explained by vascular normalization after VEGF blockade, increasing delivery of hyperpolarized [1-13C]pyruvate as observed. Despite the minimal response of these tumors to treatment, with only a minor increase in necrosis observed histologically, production of [1,4-13C2]malate from hyperpolarized [1,4-13C2]fumarate in therapy-resistant tumors also increased. Together, our findings demonstrate that hyperpolarized 13C MRS detects early responses to anti-VEGF therapy, including vascular normalization or vascular destruction and cell death.
Introduction
Angiogenesis, the growth of new blood vessels from surrounding host vasculature, can be a rate limiting process in tumor development and progression. Vascular endothelial growth factor (VEGF) is a key pro-angiogenic factor that stimulates endothelial cell proliferation, migration and survival. Sustained and excessive exposure of tumors to angiogenic factors including VEGF leads to a chaotic neovasculature, composed of immature blood vessels that are often tortuous and highly permeable (1). Targeting the tumor vasculature is an attractive treatment option, with anti-angiogenic agents providing a means not only to prune immature vessels, but also induce a window of “vascular normalization” before ultimately reducing the tumor vasculature to inadequacy (2).
Bevacizumab is a monoclonal antibody that binds VEGF and blocks signal transduction through the VEGFR1 and VEGFR2 receptors (3). In the preclinical setting, treatment with Bevacizumab leads to sustained changes in vascular function, including reduced microvessel density and permeability (4). These changes have also been reproduced in clinical trials (5, 6) within 24h of VEGF blockade (7), but are often transient rather than sustained, and frequently reverse upon cessation of treatment (2, 8). The most promising results in the clinic have been observed by combining Bevacizumab with conventional cytotoxic therapy (8), where a 5 month increase in overall survival in metastatic colorectal cancer patients (9) led to the first FDA approval in 2004. Bevacizumab was subsequently approved for treatment of metastatic renal cell carcinoma (10), non-small-cell lung cancer (11), and glioblastoma (12). However, this success has recently been confounded by results in metastatic breast cancer, where accelerated approval (13) was rescinded after two subsequent studies failed to demonstrate the same improvement in overall survival (14).
The rapid adoption of Bevacizumab in the clinic has led to an urgent need to develop biomarkers that can select patients that will best respond to the therapy, direct drug dose, and sensitively detect response to treatment (15-17); such biomarkers have remained elusive (14). Dynamic contrast agent-enhanced magnetic resonance imaging (DCE-MRI) of the tumor vasculature has proved promising in this regard (17), with patients whose tumors undergo a 50% or greater reduction in contrast agent uptake within the first cycle of treatment usually attaining stable or better disease (18). However, a correlation of DCE-MRI with clinical outcome has yet to be established (19). While the effects of Bevacizumab on tumor vasculature are relatively well characterized, the secondary effects on tumor metabolism are largely unknown. The interplay between tumor vascularity and metabolism is of significant interest, as high glucose metabolism with low blood flow correlates with poorer patient outcomes (20, 21). The glycolytic phenotype of tumor xenografts was recently found to play a role in the response of preclinical tumor models to anti-VEGF therapy (22). Furthermore, metabolic changes measured with proton magnetic resonance spectroscopy (MRS) in glioblastoma multiforme tumors treated with cediranib are highly predictive of 6-month overall survival (23). Taken together, these observations suggest imaging of both tumor vascularity and metabolism may provide important insights into the status of the tumor microenvironment following VEGF blockade (24).
Dynamic nuclear polarization (DNP, or “hyperpolarization”) of 13C-labeled metabolic substrates is an emerging technique that dramatically enhances the sensitivity of the 13C-MRS experiment (25). We have shown previously, in a preclinical lymphoma model, that 13C MRS with hyperpolarized [1-13C]pyruvate and [1,4-13C2]fumarate sensitively detects early changes in tumor metabolism following administration of a vascular disrupting agent (26). Flux of hyperpolarized 13C label between pyruvate and lactate is sensitive to tumor perfusion, membrane transport of pyruvate, endogenous lactate concentration and lactate dehydrogenase (LDH) activity (27), while the production of labeled malate from fumarate has been shown to be a sensitive indicator of tumor cell necrosis (28). In this study, we show that hyperpolarized 13C MRS can detect the early effects of anti-angiogenic therapy in two colorectal cancer xenograft models (LoVo and HT29) that are known to display differential response to VEGF blockade, being more and less sensitive, respectively (29-31). Furthermore, we compare these results with those obtained using functional MRI techniques that are used currently in the clinic, as the first clinical trial of hyperpolarized [1-13C]pyruvate is now underway (32). Our results suggest that hyperpolarized 13C MRS not only confirms results from functional MRI, but also provides additional insight that helps to differentiate responding tumors from non-responders following VEGF blockade.
Materials and Methods
Animal preparation and treatment
Tumors were established in female severe combined immunodeficient (SCID) mice by subcutaneous injection of 5×10⁶ LoVo or HT29 human colorectal adenocarcinoma cells. LoVo and HT29 cells of the same passage were genotyped with the AmpFISTR kit (Applied Biosciences) and were a 90% and 100% match with ATCC standards respectively. The cell lines were obtained from the European Collection of Cell Cultures (ECACC) (Porton Down, Salisbury, UK) (LoVo, Cat. No. 8706101; HT29, Cat. No. 91072201). Drug treated animals received Bevacizumab (Avastin; Roche) at 5mg/kg twice weekly (4, 9). Drug dosing was performed on day 1 and 3, after baseline imaging on day 0; time points referred to in this study are 24h following each drug administration (24h and 72h). Procedures were conducted in accordance with project and personal licenses issued under the United Kingdom Animals (Scientific Procedures) Act, 1986.
Magnetic Resonance Imaging
Animals were anesthetized with 10 mL/kg of a 5:4:31 mixture of Hypnorm (VetaPharma Ltd.), Hypnovel (Roche) and saline. A catheter was inserted into a tail vein and the animal was positioned in a cradle, which was placed in a quadrature 1H-tuned volume coil (Varian) in a 9.4T vertical wide-bore magnet (Oxford Instruments). The body temperature of the animals was maintained using a flow of warm air. For hyperpolarized experiments, a 24-mm diameter surface coil tuned to 13C (100 MHz) was positioned over the tumor. In all experiments, transverse 1H ‘pilot’ images were acquired for tumor localization using a spin-echo pulse sequence [repetition time (TR), 500 ms; echo time (TE), 10 ms; field-of-view (FOV), 35 × 35 mm2 in a data matrix of 256 × 256; 21 slices of thickness 2 mm]. All data analysis was performed using custom routines written in Matlab (Mathworks, Natick, MA).
Hyperpolarized 13C
[1-13C]pyruvic acid and [1,4-13C2]fumaric acid (99% 13C; Cambridge Isotope Laboratories) were hyperpolarized as described previously (26, 28, 33). Samples were polarized in a GE Healthcare DNP prototype hyperpolarizer for 45 minutes before dissolution in 6mL of buffer (26). Final concentrations were 75mmol/L for pyruvate and 20mmol/L for fumarate, with polarizations in the range of 20-30%. A slice-selective excitation ‘pulse and acquire’ sequence was used for 13C spectroscopy following injection of 0.2mL of hyperpolarized substrate. The slice, which was 6 mm thick, was placed within the subcutaneous tumors, which protruded above the body of the animal and into the surface coil loop. There was minimal inclusion of underlying tissue. Treatment with Bevacizumab was started at the same time after tumor cell implantation (15 days). Since the HT29 tumors grew slightly faster than the LoVo tumors, this meant that the MR measurements and treatment with Bevacizumab were initiated when the tumors had slightly different sizes (Length × Width = 88±16 mm2 and 138±18 mm2 for LoVo and HT29 respectively). For hyperpolarized pyruvate, 160 13C spectra were acquired at 1-second intervals with a nominal flip angle of 10°. Approximately 1 hour after the pyruvate experiment, hyperpolarized fumarate was injected into the same animal, and following a delay of 20s to allow production of hyperpolarized malate, 32 spectra were acquired from the same tumor slice at 5-second intervals with a nominal flip angle of 60°. The integrated peak intensities of hyperpolarized [1-13C]pyruvate and [1-13C]lactate were fitted to the modified Bloch equations for 2-site exchange to obtain apparent rate constants for flux of label from pyruvate to lactate (kP) and the reverse flux (kL), assuming equal spin lattice relaxation rates (1/T1) for both metabolites. The rate constant kP was shown previously to be a robust measure of pyruvate-lactate exchange, regardless of the assumptions that were made in the process of data fitting (26). Given the relatively low level of [1,4-13C2]malate detected in the fumarate experiments, the ratio of malate to fumarate in the first spectrum (25s post injection) was used as a metric as this was found to be an equivalent marker of response in previous work (26).
Dynamic Contrast Enhanced (DCE)
DCE-MRI data were acquired as described previously (26) using a T1-weighted spin-echo pulse sequence. Spin-lattice relaxation rates (R1=1/T1) were measured using an inversion recovery fast low angle shot (FLASH) pulse sequence; one R1 map and six baseline images were collected pre-contrast. Gd3+-DTPA (200μmol/kg; Magnevist, Schering) was diluted in sterile saline (0.9% sodium chloride) and injected as a bolus through a tail vein catheter over 2-3s. Dynamic imaging was performed for 10 minutes post injection. Inversion recovery data were fitted, pixel-by-pixel, to a mono-exponential function and spin-echo images were converted to relaxation rate maps (26). The Gd3+-DTPA concentration curve was evaluated in all tumor-containing slices with a manually delineated region of interest and the integrated area under the curve up to 60s (AUC60) or 600s was calculated for each ROI (34, 35). Data shown are from the central slice through the tumor, to avoid artifacts from skin perfusion in the outer slice and flow within the torso in the inner slice.
Diffusion- and T2- weighted imaging
The apparent diffusion coefficient (ADC) of tissue water was mapped using diffusion weighted MR images (DW-MRI) acquired with a navigated dual-echo spin-echo pulse sequence, as described previously (26) in 9 slices of 2 mm thickness. Diffusion-sensitizing gradients equivalent to b-values of 0, 68, 271, 609 and 1,082 s/mm2 were applied along the slice axis (gradient length ∂, 7.5ms; delay between gradients Δ, 13ms). The spin-spin relaxation time, T2, was then mapped using a dual-echo spin-echo pulse sequence for TE values of 10, 20, 30, 40 and 50 ms (FOV, 35 × 35mm2; data matrix, 128 × 128; TR, 1.0s; 9 slices, thickness 2mm). ADC and T2 maps were generated for each slice on a pixel-by-pixel basis (26). Histograms were generated for each tumor-containing slice, inside a manually defined ROI just inside the tumor boundary, as well as for the whole tumor; the mean, median and standard deviation of the ADC and T2 values were recorded.
Ex vivo analysis
Biochemical assays
Tumors were freeze-clamped 30s after intravenous injection of a 0.2mL bolus of containing 75mmol/L pyruvate and 20mmol/L fumarate. Freeze-clamped tumors were used to determine, spectrophotometrically, LDH (EC1.1.1.27) and fumarase (EC4.2.1.2) activities, and tumor concentrations of pyruvate and lactate (26, 36). Citrate synthase (EC2.3.3.1) activity was determined according to Srere (37). Briefly, tissue was homogenized on ice in a Teflon-glass Potter-S homogenizer in extraction buffer (20 mM Tris-HCl pH7.6, 0.25M sucrose, 40mM KCl, 2mM EGTA and EDTA). Homogenates were centrifuged to remove cell debris, extracted with 1% Triton X-100 then centrifuged again; the supernatant was removed and assayed immediately at 405nm in a DTNB-linked assay.
Histology
Tumors excised post mortem were fixed in 10% formalin and paraffin embedded. Hematoxylin and eosin (H&E) staining was performed for assessment of cell death. CD31 antibody (BD Pharmingen) and Jackson Biotinylated anti-rat secondary antibody (Stratech) were used with the Bond Intense R Detection kit (VisionBioSystems) for immunohistochemistry. Slides were scanned using an AperioXT (Aperio Technologies) and quantitative analysis was performed using ImageScope v10.2 software. For H&E stained slides, the fractional area containing fragmented nuclei of dead cells in two slices per tumor was measured. For CD31-stained slides, the Microvessel Analysis algorithm v1.0 was integrated into the ImageScope software and the measurement parameters were optimized to evaluate microvessel density and perimeter in five 1 mm2 fields of view in at least one slice from each tumor. A minimum of four tumors were analyzed at each treatment time point, which equated to a minimum number of vessels for analysis of 1692 and 540 for LoVo and HT29 tumors respectively.
Statistical analysis
Results are expressed as mean±standard error unless stated otherwise. All experiments were repeated independently in at least three animals. Statistical significance was tested using Prism (Graphpad, San Diego, CA) with a two-tailed t test at the 95% confidence level (unpaired unless repeated measures) or one-way ANOVA.
Results
Intravenous administration of hyperpolarized [1-13C]pyruvate resulted in readily detectable signals from both [1-13C]pyruvate at 173ppm and [1-13C]lactate at 185ppm (Figure 1). The differences in signal-to-noise in these spectra reflect differences in the levels of polarization. The flux of 13C label between these species decreased in LoVo tumors following treatment with Bevacizumab (Figure 1A), while it continued to increase after treatment in HT29 tumors (Figure 1B). For LoVo tumors, the apparent rate constant describing label flux between pyruvate and lactate (kP) was reduced by 50% at 24h (0.031±0.001 vs 0.063±0.007s−1 pre-treatment, p=0.03), and was maintained at this level at 72h (0.039±0.005s−1; p=0.03 vs pre-treatment, p=0.34 vs 24h) (Figure 1C). In HT29 tumors, kP instead tended to increase over the time course (0.025±0.006s−1, pre-treatment; 0.043±0.011s−1, 24h; 0.049±0.024s−1, 72h;) (Figure 1D). Based on tumor size changes, neither tumor type would be considered to have responded over the treatment time course as neither displayed a reduction in tumor size [LoVo: Length × Width = 105±20 mm2 at 72h (Day 5) vs 88±16 mm2 pre-treatment (Day 0), p=0.1; HT29: 164±20 mm2 at 72h (Day 5) vs 138±18 mm2 pre-treatment (Day 0), p<0.001]. However, the growth curves for the drug-treated and vehicle-treated tumors showed that both had responded to Bevacizumab treatment, although this response was greater for the LoVo as compared to the HT29 tumors (Figure 2).
Figure 1.

13C MR spectra acquired from LoVo (A-C) and HT29 (B-D) tumors and the apparent rate constant for two site exchange, kP, following intravenous administration of hyperpolarized [1-13C]pyruvate. Sequential spectra were acquired from a 6-mm tumor slice over 180s in untreated animals (left), then at 24h (center) and 72h (right), which are 24h after the first and second doses of Bevacizumab respectively. Exchange of hyperpolarized 13C label is observed between [1-13C]pyruvate (172.9ppm) and [1-13C]lactate (185.1ppm).
Figure 2.
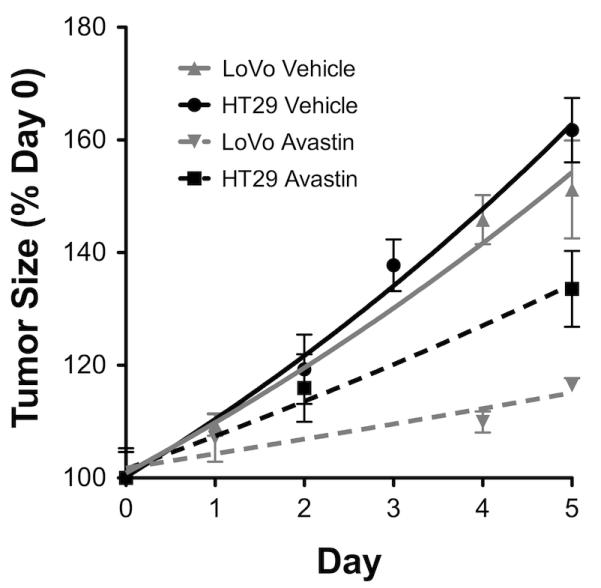
Growth curves for LoVo and HT29 tumors over the course of treatment with Bevacizumab. Day 0 is the first day of imaging in untreated animals. Tumors were first treated on Day 1; the growth of treated tumors is represented by dashed lines. Both tumor types exhibit growth inhibition with Bevacizumab, although this is more pronounced for LoVo than HT29 tumors. The error bar for treated LoVo tumors on day 5 is within the symbol representing the data point.
The fumarase-catalyzed hydration of hyperpolarized [1,4-13C2]fumarate (177ppm) to [1,4-13C2]malate (182, 184ppm), which was barely detectable before treatment, was seen to increase following treatment in both tumor models (Figure 3). In the LoVo tumors (Figure 3A), the ratio of malate to fumarate at 25s post injection was 0.04±0.01 before treatment, and rose dramatically (> 10-fold) after treatment to 0.49±0.04 (p=0.03) at 24h and 0.32±0.14 (p=0.01) at 72h (the difference observed between 24h and 72h values was not significant; p=0.49). The ratio in the HT29 tumors was much lower than that of the LoVo tumors (Figure 3B), but still increased over the treatment time course (0.010±0.004 at 24h, 0.047±0.003 at 72h vs 0.002±0.001 pre-treatment, p<0.05; no significant difference between the 24h and 72h values) (Figure 3C-D).
Figure 3.

13C MR spectra acquired from a 6-mm tumor slice at 25s after intravenous administration of hyperpolarized [1,4-13C2]fumarate (177.2ppm) show readily detectable signals from [1,4-13C2]malate (182.2, 183.6ppm) after treatment with Bevacizumab in both LoVo (A-C) and HT29 (B-D) tumors. The vertical scale of the spectra from HT29 tumors has been increased 5-fold compared to the spectra from LoVo tumors.
Treatment response was also assessed using clinical MRI methods. For DCE-MRI measurements, changes in perfusion were assessed from the integrated area under the Gd-DTPA uptake curve (AUC) at 60 and 600s. Drug treatment of LoVo tumors produced significant (p<0.05) anti-vascular effects at 24h (Figures 4A-B), with AUC60 falling from 0.52±0.09mM to 0.25±0.04mM and AUC600 from 6.4±0.4mM to 4.9±0.5mM. By 72h there was some recovery, with AUC60 rising to 0.35±0.07 and AUC600 to 7.0±0.5mM. By contrast, no anti-vascular effects were observed in the HT29 tumors, in fact there was evidence for increased contrast agent uptake after treatment (Figure 4C). The AUC60 remained close to the pre-treatment value of 0.67±0.09mM (0.59±0.12mM and 0.58±0.10mM at 24h and 72h respectively) but there was a significant increase at later time points in the Gd-DTPA uptake curve (Figure 4C), with the AUC600 (Figure 4D) increasing from 10.0±0.7mM to 12.6±1.1mM at 24h (p<0.05) and 14.0±1.6mM at 72h (p<0.05). We observed a similar differential response with MRI measurements of Gd-DTPA uptake in a previous study where these tumors were treated with an anti-vascular drug (31). Drug-induced decreases in vascular permeability could also affect the Gd-DTPA uptake curves and the tumor uptake of a Gd-DTPA-albumin conjugate has been used previously to measure Bevacizumab-induced changes in vascular permeability (38). However, changes in tumor contrast observed with low molecular weight contrast agents, such as the Gd-DTPA used here, are influenced primarily by flow (39), as opposed to vascular permeability, and considering only the initial rate of contrast agent uptake minimizes the effects of changes in permeability (40).
Figure 4.

Dynamic contrast agent-enhanced magnetic resonance imaging of tumor perfusion. (A) Anti-vascular effects were observed in LoVo tumors at 24h after the first dose of Bevacizumab, but began to recover after the second dose (72h; p=0.0001). (B) The area under the gadolinium uptake curve (AUC) at 60s and 600s (scaled by factor of 10 for display) showed a significant reduction (p=0.04) at 24h. No anti-vascular effects were observed in HT29 tumors (C); enhanced uptake is seen over the 10 minute time scale (D) compared to pre-treatment levels (1-way ANOVA, p=0.0002; t-test of AUC, p=0.04). In the time scale of the hyperpolarized experiment (inset, A and C), perfusion was only significantly disrupted in LoVo tumors. * p<0.05.
Maps of tumor ADC and the transverse relaxation time (T2) were used to determine the mean and median values of these parameters (Table 1). Average ADC histograms for each time point are shown in Figure 5. There was no significant change in the ADC or T2 of LoVo tumors following Bevacizumab treatment (Figure 5A-C, Table 1). HT29 tumors did not exhibit any change in T2 but there was a 15% decrease in median ADC (Table 1) and narrowing of the ADC histogram (Figure 5D-F), from (0.67±0.04)×10−3mm2s−1 to (0.57±0.03)×10−3mm2s−1 by 72h (p=0.04).
Table 1.
Apparent diffusion coefficient of water (ADC) and transverse relaxation time (T2) measured over the whole tumor volume.
| LoVo | HT29 | ||||||
|---|---|---|---|---|---|---|---|
| UT | 24h | 72h | UT | 24h | 72h | ||
| ADC (10−3mm2s−1) | Median | 0.44 | 0.49 | 0.49 | 0.67 | 0.57 | 0.57 * |
| Mean | 0.53 | 0.51 | 0.52 | 0.73 | 0.63 | 0.57 * | |
| St. dev. |
0.10 | 0.06 | 0.05 | 0.11 | 0.10 | 0.06 | |
| T2 (ms) | Median | 28.5 | 29.8 | 28.8 | 27.7 | 27.1 | 28.1 |
| Mean | 28.5 | 29.7 | 28.8 | 28.1 | 27.7 | 28.0 | |
| St. dev. |
1.1 | 0.8 | 0.9 | 3.0 | 0.8 | 3.4 | |
p<0.05
Figure 5.

Apparent diffusion coefficient (ADC) histograms averaged over all measurements at each time point. No significant change was seen in the median ADC value or histogram shape following Bevacizumab treatment of LoVo tumors (A) after 24h (B) or 72h (C). A significant reduction in the median ADC and narrowing of the ADC histogram of the HT29 tumors (D-F) is observed within 24h of treatment (E) with Bevacizumab and maintained at 72h (F).
Tumor enzyme and substrate levels were assayed in extracts from freeze-clamped tumor tissue (Figure 6). Measurements on LoVo tumor samples revealed a transient increase in lactate dehydrogenase (LDH) activity of more than 20% at 24h, from 2.3±0.2 to 2.8±0.1μmole/min/mg protein (p=0.03), followed by a return to baseline at 72h (2.1±0.4 μmole/min/mg protein) (Figure 6A). There was also an increase in lactate concentration, which rose by 30% from 4.2±0.4 to 5.6±0.5μmol/g (wet weight) at 24h (p=0.08) and by a further 30% to 7.1±0.4μmol/g at 72h (p<0.01) (Figure 6B). These changes in LDH activity and lactate concentration are consistent with an increase in hypoxia in the LoVo tumors (29, 41). There was no change in fumarase activity from the pre-treatment level of 0.40±0.04μmole/min/mg protein (Figure 6C). The tumor pyruvate concentration tended to decrease (Figure 6D) and this was significant at 72h (0.30±0.06μmol/g vs 0.43±0.03μmol/g pre-treatment; p=0.04), in part reflecting the reduced tumor perfusion observed in DCE-MRI measurements.
Figure 6.

Enzyme activities (A, C) and metabolite concentrations (B, D) determined by enzymatic assay in tumor extracts (A) Lactate dehydrogenase (LDH) activity and (B) lactate concentration increase in LoVo tumors after treatment. (C) Fumarase activity exhibits a marked decline in HT29 tumors after treatment but there is no significant change for the LoVo tumors. (D) Pyruvate concentration is decreased in LoVo tumors after the second Bevacizumab dose. * p<0.05, ** p<0.01.
By contrast, the HT29 tumor extracts showed no significant changes in tumor lactate concentration (pre-treatment level, 8.6±0.4μmol/g), pyruvate concentration (0.36±0.02 μmol/g) or LDH activity (1.8±0.2μmole/min/mg protein), although the pre-treatment lactate level was approximately double that found in LoVo tumors (Figure 6B). Interestingly, fumarase activity decreased by ~50%, from 0.19±0.04μmole/min/mg protein pre-treatment, to 0.10±0.04 and 0.08±0.03μmole/min/mg protein at 24h and 72h respectively (p<0.05) (Figure 6C). As fumarase exists in both cytosolic and mitochondrial forms, we also measured the activity of a mitochondrial marker enzyme, citrate synthase; this fell by ~20% in HT29 tumors, from 0.12±0.01 to 0.10±0.01μmole/min/mg protein at 72h, but the change was not significant (p=0.13).
Histological assessment of tumor sections obtained post mortem showed that both tumors contained small abnormal or necrotic areas (Figure 7A) by 24h after the first drug treatment (HT29, 8±1%, LoVo, 14±3%), with a low level of necrosis in untreated tumors (HT29, 5±1%; LoVo, 9±1%). At 72h, the necrotic area had increased substantially in LoVo tumors (26±2%; p<0.001), although it remained diffuse throughout the tumor. This was not the case in HT29 tumors (10±3% at 72h; p=0.68). CD31 staining of tumor blood vessels (Figure 7B) showed that in LoVo tumors, vessel density declined by 40%, from (2.1±0.4)×10−4μm−2 to (1.2±0.1)×10−4μm−2 at 24h (p=0.03) and further to (0.8±0.1)×10−4μm−2 at 72h (p<0.001). There was no significant change in vessel density in HT29 tumors from the pre-treatment level of (0.5±0.1)×10−4μm−2. Vessel perimeter in the untreated LoVo tumor sections was 63.6±0.7μm, significantly larger than that in HT29 tumor sections (43.9±1.5 μm; p<0.001), which is consistent with a higher level of VEGF expression in these tumors. The perimeter of LoVo tumor vessels declined after treatment to 59.2±4.5μm at 24h and 54.8±2.1μm at 72h (p=0.03), but no change was observed in the perimeter of HT29 tumor vessels (43.0±2.0 and 48.7±4.4μm at 24 and 72h respectively).
Figure 7.

Sections of tumors stained with hemotoxylin and eosin (A) and CD31 (B). Both tumors develop small abnormal or necrotic areas by 24h after the first Bevacizumab dose (A). In LoVo tumors, these expand significantly by 72h (p<0.001). Microvessel density (MVD) in the LoVo tumors is significantly higher than that of the HT29 tumors (B) before treatment (p<0.001) and the vessels are larger in size. After treatment, MVD decreases significantly at 24h (p=0.03) and 72h (p<0.001) in LoVo tumors, while remains unchanged in HT29 tumors.
Discussion
The early success of Bevacizumab in improving progression free survival has been marred by more recent failures to demonstrate significant improvements in overall survival. The recent introduction of hyperpolarized 13C MRSI into the clinic (32) offers a new way to investigate the action of these drugs and to detect response to them. In this preclinical study, we sought to detect early metabolic and vascular changes induced by Bevacizumab treatment in two colorectal cancer xenograft models with differential sensitivity to VEGF blockade. LoVo tumors display a higher dependence on VEGF, with greater vessel permeability (31) and lower vessel pericyte coverage (29) than HT29 tumors, therefore upon VEGF blockade will exhibit reduced microvessel density and perfusion, along with marked expansion of hypoxic regions (29). Conversely, HT29 tumor cells are less sensitive to VEGF blockade (30), requiring high doses of Bevacizumab (42) or receptor tyrosine kinase inhibitors (43) to display a similar response. We have shown here that the growth of these tumors has differential sensitivity to VEGF blockade and that this differential response can be detected early during treatment by MR measurements of metabolism, vascular function, and the apparent diffusion coefficient (ADC) of tissue water. These measured changes in tumor biochemistry and physiology occur in the absence of a decrease in tumor size, and in HT29 tumors precede a significant change in tumor growth rate.
Our first key finding is that hyperpolarized [1-13C]pyruvate and [1,4-13C2]fumarate are early markers of a positive response to Bevacizumab treatment in LoVo tumors. The apparent rate constant describing label exchange between [1-13C]pyruvate and [1-13C]lactate, kP, fell by over 50% at 24h after treatment. This rate constant can be influenced by several factors, including: LDH activity; the concentrations of the co-enzymes NAD+ and NADH; and pyruvate delivery and transport (33). Tumor lactate concentration and LDH activity, measured by biochemical assays, both increased significantly, which can be attributed to an increase in tumor hypoxia following VEGF blockade and consequent HIF-1-dependent upregulation of glycolytic enzyme expression, including LDH (41). Since both the increase in lactate concentration and LDH activity are expected to produce nearly proportional increases in label flux between pyruvate and lactate (27), the decrease in label flux is most likely due to the decrease in tumor perfusion observed in the DCE-MRI measurements, which will result in reduced pyruvate delivery to the tumor (26). The DCE-MRI measurements showed a 52% reduction in AUC60 at 24h after treatment, which recovered a little, to 67% of the pre-treatment level, by 72h (Figure 4). The reduction in perfusion at 72h was accompanied by a statistically significant decrease in tumor pyruvate concentration, which was measured 30s after intravenous pyruvate injection (Figure 6). However, the continued suppression of label flux at 72h may also reflect cell death as the percentage of tumor necrosis had reached a significant increase above baseline by this time point. The tumor microvessel density fell 60% by 72h relative to pre-treatment levels, while the vessel perimeter declined by nearly 15%; histological changes of this nature are consistent with a positive response to Bevacizumab (1).
The production of labeled malate from hyperpolarized [1,4-13C2]fumarate has been shown previously to be a sensitive indicator of tumor cell necrosis (28). This has been demonstrated in vitro and in vivo in different tumor types, using both cytotoxic and anti-vascular drugs (26, 28). In the LoVo tumors, the hyperpolarized malate/fumarate ratio increased by more than 10-fold after Bevacizumab treatment. The increased malate production reflected an increase in necrotic fraction observed in histological sections, which increased to 26% by the 72h time point. The decline in the malate/fumarate ratio observed at 72h, although not significant, may reflect some washout of fumarase from necrotic areas. There was no significant change in DW-MRI measurements of tumor ADC, when considering either the median value or histograms of the distribution of ADC values (Table 1 and Figure 5A-C). The lack of change in tumor ADC is consistent with previous observations that in xenograft tumors with small or diffuse regions of necrosis, there may be no change in ADC with necrotic fractions of up to 40% (44). This demonstrates the sensitivity of the hyperpolarized fumarate experiment for detecting diffuse tumor cell necrosis.
Our second key finding is that in the less sensitive HT29 tumors, hyperpolarized [1-13C]pyruvate is affected by vascular normalization induced by Bevacizumab treatment. Although histopathology showed no significant change in microvessel density or vessel perimeter in these tumors, the apparent rate constant for label exchange between [1-13C]pyruvate and [1-13C]lactate, kP, increased 2.2-fold after Bevacizumab treatment. Since there was no change in lactate concentration or LDH activity, this increase in rate was most likely due to increased pyruvate delivery to the tumor. This is supported by the Gd-DTPA uptake data, although there was no change in Gd-DTPA uptake over the first 60s following contrast agent injection (AUC60), which covers the time course of the hyperpolarized experiment (~160s, Figure 1), there was nevertheless a significant increase in AUC600.
That the vascular normalization resulting from VEGF blockade can result in increased delivery of small molecules to tumors has been demonstrated in previous studies. Treatment of a range of tumor xenografts (including colorectal cancer) with an antibody to VEGFR-2 was shown to decrease interstitial fluid pressure (IFP), by improving the integrity and function of the vasculature, which resulted in significantly enhanced penetration of small molecules (45). Treatment of neuroblastoma xenografts with Bevacizumab increased the penetration of a chemotherapeutic drug for 1 – 3 days after drug treatment (46) and a similar observation was made in HT29 tumors (47). A reduction in IFP may explain the increase in AUC600 observed here since a negative correlation has been observed between AUC and interstitial fluid pressure (IFP) in cervical cancer, thought to be due to high IFP resulting in increased resistance to tumor blood flow (48). The failure to detect increased pyruvate concentrations in the HT29 tumors following Bevacizumab treatment (Figure 6) may be a reflection of the fact that 30s after pyruvate injection most of the pyruvate is still in the tumor blood vessels (49). Furthermore, the decrease in median tumor ADC and narrowing of the ADC histogram observed here (Figure 5) has been observed previously after anti-VEGF treatment in both preclinical (22) and clinical (23, 50) studies, where it has been attributed to a variety of factors including cell swelling (22), atypical necrosis and chronic hypoxia (50) and decreased edema (23).
The magnitude of the change in kP is greater than the changes in either ADC or AUC, therefore the hyperpolarized pyruvate experiment is better able to detect not only the anti-vascular effects in the LoVo tumors, but is also more sensitive to vascular normalization in the HT29 tumor, which may provide an avenue to improve scheduling of chemotherapeutic agents in combination with anti-angiogenic drugs.
There was little or no signal from hyperpolarized [1,4-13C2]malate in HT29 tumors prior to treatment but a significant increase was observed following treatment, despite only a relatively minor increase in necrotic area in these tumors and a decrease in fumarase activity. This demonstrates again the sensitivity of the hyperpolarized fumarate experiment for detecting low levels of diffuse necrosis by integrating malate signal over the entire tumor volume. These low levels of necrosis were not detected by either the T2 or DW-MRI measurements. The decrease in fumarase activity reflected, at least in part, a decrease in mitochondrial content, as assessed by measurements of citrate synthase activity. Fumarase exists in both cytosolic and mitochondrial forms, so the membrane disruption that occurs early in the process of necrosis may lead to leakage of the cytosolic form, also causing a reduction in the measured fumarase activity.
In conclusion, we have shown that hyperpolarized 13C MRS sensitively detects early response to anti-angiogenic therapy. While DCE-MRI detects evidence of vascular changes, it cannot determine the downstream effects on tumor metabolism, where the hyperpolarized pyruvate experiment has the advantage of being sensitive to both perfusion and metabolic changes. In therapies that produce diffuse, low level necrosis, where there is no significant change in ADC, the production of malate from hyperpolarized fumarate is still elevated. However, there is clearly an advantage in combining both the metabolic and functional MRI approaches, for example the early increase in label flux following treatment of HT29 tumors could be explained either by vascular normalization increasing pyruvate delivery to the tumor or an increase in steady state lactate concentration (27), alternatives which can be resolved by the DCE-MRI experiment. The use of hyperpolarized [1-13C]pyruvate and [1,4-13C2]fumarate to detect metabolic response to treatment should prove advantageous, therefore, in the clinical assessment of response to anti-angiogenic therapies.
Acknowledgments
We thank P. Dzien, F. A. Gallagher and the Histopathology Core Facility at the Cambridge Research Institute for the processing and staining of excised tumor samples.
Grant support The work was supported in part by Cancer Research UK Programme Grant C197/A3514 (to K. M. B.) and by a Translational Research Program Award from The Leukemia and Lymphoma Society. This research was conducted under a research agreement with GE Healthcare, who provided the polarizer and related materials. K. M. B. holds two patents with GE Healthcare on this technology.
References
- 1.Carmeliet P, Jain RK. Principles and mechanisms of vessel normalization for cancer and other angiogenic diseases. Nat Rev Drug Discov. 2011;10:417–27. doi: 10.1038/nrd3455. [DOI] [PubMed] [Google Scholar]
- 2.Gerstner ER, Duda DG, di Tomaso E, Ryg PA, Loeffler JS, Sorensen AG, et al. VEGF inhibitors in the treatment of cerebral edema in patients with brain cancer. Nat Rev Clin Oncol. 2009;6:229–36. doi: 10.1038/nrclinonc.2009.14. [DOI] [PMC free article] [PubMed] [Google Scholar]
- 3.Wang Y, Fei D, Vanderlaan M, Song A. Biological activity of bevacizumab, a humanized anti-VEGF antibody in vitro. Angiogenesis. 2004;7:335–45. doi: 10.1007/s10456-004-8272-2. [DOI] [PubMed] [Google Scholar]
- 4.Gerber H-P, Ferrara N. Pharmacology and Pharmacodynamics of Bevacizumab as Monotherapy or in Combination with Cytotoxic Therapy in Preclinical Studies. Cancer Res. 2005;65:671–80. [PubMed] [Google Scholar]
- 5.Willett CG, Boucher Y, de Tomaso E, Duda DG, Munn LL, Tong RT, et al. Direct evidence that the VEGF-specific antibody bevacizumab has antivascular effects in human rectal cancer. Nat Med. 2004;10:145–7. doi: 10.1038/nm988. [DOI] [PMC free article] [PubMed] [Google Scholar]
- 6.Zweifel M, Padhani AR. Perfusion MRI in the early clinical development of antivascular drugs: decorations or decision making tools. Eur J Nucl Med Mol Imaging. 2010;37:S164–S82. doi: 10.1007/s00259-010-1451-z. [DOI] [PubMed] [Google Scholar]
- 7.Leach MO, Brindle KM, Evelhoch JL, Griffiths JR, Horsman MR, Jackson A, et al. The assessment of antiangiogenic and antivascular therapies in early-stage clinical trials using magnetic resonance imaging: issues and recommendations. Br J Cancer. 2005;92:1599–610. doi: 10.1038/sj.bjc.6602550. [DOI] [PMC free article] [PubMed] [Google Scholar]
- 8.Jain RK, di Tomaso E, Duda DG, Loeffler JS, Sorensen AG, Batchelor TT. Angiogenesis in brain tumours. Nat Rev Neurosci. 2007;8:610–22. doi: 10.1038/nrn2175. [DOI] [PubMed] [Google Scholar]
- 9.Hurwitz H, Fehrenbacher L, Novotny W, Cartwright T, Hainsworth J, Heim W, et al. Bevacizumab plus Irinotecan, Fluorouracil, and Leucovorin for Metastatic Colorectal Cancer. N Engl J Med. 2004;350:2335–42. doi: 10.1056/NEJMoa032691. [DOI] [PubMed] [Google Scholar]
- 10.Yang JC, Haworth L, Sherry RM, Hwu P, Schwartzentruber DJ, Topalian SL, et al. A Randomized Trial of Bevacizumab, an Anti-Vascular Endothelial Growth Factor Antibody, for Metastatic Renal Cancer. N Engl J Med. 2003;349:427–34. doi: 10.1056/NEJMoa021491. [DOI] [PMC free article] [PubMed] [Google Scholar]
- 11.Sandler A, Gray R, Perry MC, Brahmer J, Schiller JH, Dowlati A, et al. Paclitaxel-Carboplatin Alone or with Bevacizumab for Non-Small-Cell Lung Cancer. N Engl J Med. 2006;355:2542–50. doi: 10.1056/NEJMoa061884. [DOI] [PubMed] [Google Scholar]
- 12.Cloughesy TF, Prados MD, Wen PY, Mikkelsen T, Abrey LE, Schiff D, et al. A phase II, randomized, non-comparative clinical trial of the effect of bevacizumab (BV) alone or in combination with irinotecan (CPT) on 6-month progression free survival (PFS) in recurrent, treatment-refractory glioblastoma (GBM). ASCO Annual Meeting; Chicago. May 30-June 3, 2008; 2008. 2008. [Google Scholar]
- 13.Gray R, Bhattacharya S, Bowden C, Miller K, Comis RL. Independent review of E2100: a phase III trial of bevacizumab plus paclitaxel versus paclitaxel in women with metastatic breast cancer. J Clin Oncol. 2009;27:4966–72. doi: 10.1200/JCO.2008.21.6630. [DOI] [PMC free article] [PubMed] [Google Scholar]
- 14.Gonzalez-Angulo AM, Hortobagyi GN, Ellis LM. Targeted therapies: peaking beneath the surface of recent bevacizumab trials. Nat Rev Clin Oncol. 2011;8:319–20. doi: 10.1038/nrclinonc.2011.66. [DOI] [PubMed] [Google Scholar]
- 15.O’Connor JPB, RA C, AR C, J R, CC H, A J, et al. Quantifying antivascular effects of monoclonal antibodies to vascular endothelial growth factor: insights from imaging. Clin Cancer Res. 2009;15:6674–82. doi: 10.1158/1078-0432.CCR-09-0731. [DOI] [PMC free article] [PubMed] [Google Scholar]
- 16.Pathak AP, Hochfeld WE, Goodman SL, Pepper MS. Circulating and imaging markers for angiogenesis. Angiogenesis. 2008;11:321–35. doi: 10.1007/s10456-008-9119-z. [DOI] [PubMed] [Google Scholar]
- 17.Perini R, Choe R, Yodh AG, Sehgal C, Divgi CR, Rosen MA. Non-invasive assessment of tumor neovasculature: techniques and clinical applications. Cancer Metastasis Rev. 2008;27:615–30. doi: 10.1007/s10555-008-9147-6. [DOI] [PubMed] [Google Scholar]
- 18.Murukesh N, Dive C, Jayson GC. Biomarkers of angiogenesis and their role in the development of VEGF inhibitors. Br J Cancer. 2010;102:8–18. doi: 10.1038/sj.bjc.6605483. [DOI] [PMC free article] [PubMed] [Google Scholar]
- 19.O’Connor JPB, Jackson A, Parker GJM, Jayson GC. DCE-MRI biomarkers in the clinical evaluation of antiangiogenic and vascular disrupting agents. Br J Cancer. 2007;96:189–95. doi: 10.1038/sj.bjc.6603515. [DOI] [PMC free article] [PubMed] [Google Scholar]
- 20.Komar G, Kauhanen S, Liukko K, Seppänen M, Kajander S, Ovaska J, et al. Decreased blood flow with increased metabolic activity: a novel sign of pancreatic tumor aggressiveness. Clin Cancer Res. 2009;15:5511–7. doi: 10.1158/1078-0432.CCR-09-0414. [DOI] [PubMed] [Google Scholar]
- 21.Mankoff DA, Dunnwald LK, Partridge SC, Specht JM. Blood flow-metabolism mismatch: good for the tumor, bad for the patient. Clin Cancer Res. 2009;15:5294–6. doi: 10.1158/1078-0432.CCR-09-1448. [DOI] [PMC free article] [PubMed] [Google Scholar]
- 22.Nardo G, Favaro E, Curtarello M, Moserle L, Zulato E, Persano L, et al. Glycolytic Phenotype and AMP Kinase Modify the Pathologic Response of Tumor Xenografts to VEGF Neutralization. Cancer Res. 2011;71:4214–25. doi: 10.1158/0008-5472.CAN-11-0242. [DOI] [PubMed] [Google Scholar]
- 23.Kim H, Catana C, Ratai EM, Andronesi OC, Jennings DL, Batchelor TT, et al. Serial magnetic resonance spectroscopy reveals a direct metabolic effect of cediranib in glioblastoma. Cancer Res. 2011;71:3745–52. doi: 10.1158/0008-5472.CAN-10-2991. [DOI] [PMC free article] [PubMed] [Google Scholar]
- 24.Padhani AR, Miles KA. Multiparametric Imaging of Tumor Response to Therapy. Radiology. 2010;256:348–64. doi: 10.1148/radiol.10091760. [DOI] [PubMed] [Google Scholar]
- 25.Ardenkjaer-Larsen JH, Fridlund B, Gram A, Hansson G, Hansson L, Lerche MH, et al. Increase in signal-to-noise ratio of >10,000 times in liquid-state NMR. Proc Natl Acad Sci U S A. 2003;100:10158–63. doi: 10.1073/pnas.1733835100. [DOI] [PMC free article] [PubMed] [Google Scholar]
- 26.Bohndiek SE, Kettunen MI, Hu D, Witney TH, Kennedy BWC, Gallagher FA, et al. Detection of tumor response to a vascular disrupting agent by hyperpolarized 13C magnetic resonance spectroscopy. Mol Cancer Ther. 2010;9:3278–88. doi: 10.1158/1535-7163.MCT-10-0706. [DOI] [PMC free article] [PubMed] [Google Scholar]
- 27.Witney TH, Kettunen MI, Brindle KM. Kinetic Modeling of Hyperpolarized 13C Label Exchange between Pyruvate and Lactate in Tumor Cells. J Biol Chem. 2011;286:24572–80. doi: 10.1074/jbc.M111.237727. [DOI] [PMC free article] [PubMed] [Google Scholar]
- 28.Gallagher FA, Kettunen MI, Hu D, Jensen P, Zandt Rit, Karlsson M, et al. Production of hyperpolarized [1,4-13C2]malate from [1,4-13C2]fumarate is a marker of cell necrosis and treatment response in tumors. Proc Natl Acad Sci U S A. 2009 doi: 10.1073/pnas.0911447106. [DOI] [PMC free article] [PubMed] [Google Scholar]
- 29.Dang DT, Chun SY, Burkitt K, Abe M, Chen S, Havre P, et al. Hypoxia-inducible factor-1 target genes as indicators of tumor vessel response to vascular endothelial growth factor inhibition. Cancer Res. 2008;68:1872–80. doi: 10.1158/0008-5472.CAN-07-1589. [DOI] [PubMed] [Google Scholar]
- 30.Calvani M, Trisciuoglio D, Bergamaschi C, Shoemaker RH, Melillo G. Differential involvement of vascular endothelial growth factor in the survival of hypoxic colon cancer cells. Cancer Res. 2008;68:285–91. doi: 10.1158/0008-5472.CAN-07-5564. [DOI] [PubMed] [Google Scholar]
- 31.Beauregard DA, Hill SA, Chaplin DJ, Brindle KM. The susceptibility of tumors to the antivascular drug combretastatin A4 phosphate correlates with vascular permeability. Cancer Res. 2001;61:6811–5. [PubMed] [Google Scholar]
- 32.Nelson SJ. Preclinical and Clinical Applications of Hyperpolarized Contrast Agents. International Society for Magnetic Resonance in Medicine Annual Scientific Meeting; Montreal. 2011. [Google Scholar]
- 33.Day SE, Kettunen MI, Gallagher FA, Hu D, Lerche M, Wolber J, et al. Detecting tumor response to treatment using hyperpolarized 13C magnetic resonance imaging and spectroscopy. Nat Med. 2007;13:1382–7. doi: 10.1038/nm1650. [DOI] [PubMed] [Google Scholar]
- 34.Langen d, van den Boogaart VEM, Marcus JT, Lubberink M. Use of H 152O PET and DCE-MRI to Measure Tumor Blood Flow. The Oncologist. 2008;13:631–44. doi: 10.1634/theoncologist.2007-0235. [DOI] [PubMed] [Google Scholar]
- 35.Minowa T, Kawano K, Kuribayashi H, Shiraishi K, Sugino T, Hattori Y, et al. Increase in tumour permeability following TGF-β type I receptor-inhibitor treatment observed by dynamic contrast-enhanced MRI. Br J Cancer. 2009;101:1884–90. doi: 10.1038/sj.bjc.6605367. [DOI] [PMC free article] [PubMed] [Google Scholar]
- 36.Vassault A. Lactate Dehydrogenase. In: Bergmeyer HU, editor. Methods of Enzymatic Analysis. Verlag Chemie GmbH; 1983. pp. 118–26. [Google Scholar]
- 37.Srere PA. Citrate synthase. Methods in enzymology. 1969;13:3–11. [Google Scholar]
- 38.Raatschen HJ, Simon GH, Fu Y, Sennino B, Shames DM, Wendland MF, et al. Vascular permeability during antiangiogenesis treatment: MR imaging assay results as biomarker for subsequent tumor growth in rats. Radiology. 2008;247:391–9. doi: 10.1148/radiol.2472070363. [DOI] [PMC free article] [PubMed] [Google Scholar]
- 39.de Lussanet QG, Langereis S, Beets-Tan RG, van Genderen MH, Griffioen AW, van Engelshoven JM, et al. Dynamic contrast-enhanced MR imaging kinetic parameters and molecular weight of dendritic contrast agents in tumor angiogenesis in mice. Radiology. 2005;235:65–72. doi: 10.1148/radiol.2351040411. [DOI] [PubMed] [Google Scholar]
- 40.Muruganandham M, Lupu M, Dyke J, Matei C, Linn M, Packman K, et al. Preclinical evaluation of tumor microvascular response to a novel antiangiogenic/antitumor agent RO0281501 by dynamic contrast-enhanced MRI at 1. T. Mol Cancer Ther. 2006;5:1950–7. doi: 10.1158/1535-7163.MCT-06-0010. [DOI] [PubMed] [Google Scholar]
- 41.Simon MC. Coming up for air: HIF-1 and mitochondrial oxygen consumption. Cell Metabolism. 2006;3:150–1. doi: 10.1016/j.cmet.2006.02.007. [DOI] [PubMed] [Google Scholar]
- 42.Selvakumaran M, Yao KS, Feldman MD, O’Dwyer PJ. Antitumor effect of the angiogenesis inhibitor bevacizumab is dependent on susceptibility of tumors to hypoxia-induced apoptosis. Biochem Pharmacol. 2008;75:627–38. doi: 10.1016/j.bcp.2007.09.029. [DOI] [PMC free article] [PubMed] [Google Scholar]
- 43.Marzola P, Degrassi A, Calderan L, Farace P, Nicolato E, Crescimanno C, et al. Early antiangiogenic activity of SU11248 evaluated in vivo by dynamic contrast-enhanced magnetic resonance imaging in an experimental model of colon carcinoma. Clin Cancer Res. 2005;11:5827–32. doi: 10.1158/1078-0432.CCR-04-2655. [DOI] [PubMed] [Google Scholar]
- 44.Lyng H, Haraldseth O, Rofstad EK. Measurement of Cell Density and Necrotic Fraction in Human Melanoma Xenografts by Diffusion Weighted Magnetic Resonance Imaging. Magn Reson Med. 2000;43:828–36. doi: 10.1002/1522-2594(200006)43:6<828::aid-mrm8>3.0.co;2-p. [DOI] [PubMed] [Google Scholar]
- 45.Tong RT, Boucher Y, Kozin SV, Winkler F, Hicklin DJ, Jain RK. Vascular normalization by vascular endothelial growth factor receptor 2 blockade induces a pressure gradient across the vasculature and improves drug penetration in tumors. Cancer Res. 2004;64:3731–6. doi: 10.1158/0008-5472.CAN-04-0074. [DOI] [PubMed] [Google Scholar]
- 46.Dickson PV, Hamner JB, Sims TL, Fraga CH, Ng CY, Rajasekeran S, et al. Bevacizumab-induced transient remodeling of the vasculature in neuroblastoma xenografts results in improved delivery and efficacy of systemically administered chemotherapy. Clin Cancer Res. 2007;13:3942–50. doi: 10.1158/1078-0432.CCR-07-0278. [DOI] [PubMed] [Google Scholar]
- 47.Wildiers H, Guetens G, De Boeck G, Verbeken E, Landuyt B, Landuyt W, et al. Effect of antivascular endothelial growth factor treatment on the intratumoral uptake of CPT-11. Br J Cancer. 2003;88:1979–86. doi: 10.1038/sj.bjc.6601005. [DOI] [PMC free article] [PubMed] [Google Scholar]
- 48.Haider MA, Sitartchouk I, Roberts TP, Fyles A, Hashmi AT, Milosevic M. Correlations between dynamic contrast-enhanced magnetic resonance imaging-derived measures of tumor microvasculature and interstitial fluid pressure in patients with cervical cancer. J Magn Reson Imaging. 2007;25:153–9. doi: 10.1002/jmri.20795. [DOI] [PubMed] [Google Scholar]
- 49.Day SE, Kettunen MI, Cherukuri MK, Mitchell JB, Lizak MJ, Morris HD, et al. Detecting response of rat C6 glioma tumors to radiotherapy using hyperpolarized [1-13C]pyruvate and 13C magnetic resonance spectroscopic imaging. Magnetic resonance in medicine : official journal of the Society of Magnetic Resonance in Medicine / Society of Magnetic Resonance in Medicine. 2011;65:557–63. doi: 10.1002/mrm.22698. [DOI] [PMC free article] [PubMed] [Google Scholar]
- 50.Rieger J, Bahr O, Muller K, Franz K, Steinbach J, Hattingen E. Bevacizumab-induced diffusion-restricted lesions in malignant glioma patients. J Neurooncol. 2010;99:49–56. doi: 10.1007/s11060-009-0098-8. [DOI] [PubMed] [Google Scholar]