

Abstract
Humans exploit a range of visual depth cues to estimate three-dimensional (3D) structure. For example, the slant of a nearby tabletop can be judged by combining information from binocular disparity, texture and perspective. Behavioral tests show humans combine cues near-optimally, a feat that could depend on: (i) discriminating the outputs from cue-specific mechanisms, or (ii) fusing signals into a common representation. While fusion is computationally attractive, it poses a significant challenge, requiring the integration of quantitatively different signals. We used functional magnetic resonance imaging (fMRI) to provide evidence that dorsal visual area V3B/KO meets this challenge. Specifically, we found that fMRI responses are more discriminable when two cues (binocular disparity and relative motion) concurrently signal depth, and that information provided by one cue is diagnostic of depth indicated by the other. This suggests a cortical node important when perceiving depth, and highlights computations based on fusion in the dorsal stream.
Introduction
To achieve robust estimates of depth, the brain combines information from different visual cues1-3. Computational work proposes this produces more reliable estimates4 and behavioral tests show it improves discriminability5,6. However, our understanding of the neural basis of integration is underdeveloped. Electrophysiological recordings suggest locations where depth signals converge7-9. Nevertheless, comparing the responses evoked by individual cues (e.g. disparity, perspective or motion- defined depth) presented ‘alone’ does not imply fusion—response characteristics might be dominated by one cue, or show opposite tuning rather than integration10,11.
Here we used human fMRI to test for cortical areas that integrate cues, rather than containing convergent information (i.e. co-located, independent signals). To this end, we exploited two cues to which the brain is remarkably sensitive: horizontal binocular disparity and depth from relative motion12. Psychophysical evidence for interactions between them13-16 suggests common stages of processing; thus these cues provide a useful pairing to test fusion.
To frame the problem of cue integration, consider a solid object (e.g. ballerina) whose depth is defined by both disparity and motion (Fig. 1a). An estimate of depth could be derived from each cue (quasi-) independently, defining a bivariate likelihood estimate in motion-disparity space. Thereafter, a fusion mechanism would produce a univariate ‘depth’ estimate with lower variance3,4. To probe this process, it is customary to measure discrimination performance; for instance, asking observers to judge which of two shapes has greater depth (e.g. Fig. 1b ‘Margot’ vs. ‘Darcy’). There are two computationally distinct ways of solving this task: independence vs. fusion. Under independence, an ideal observer would discriminate the two bivariate distributions (Fig. 1b green and purple blobs) orthogonal to the optimal decision boundary. By so doing, the observer is more sensitive to differences between the shapes than if they judged only one cue. This improvement corresponds to the quadratic sum of the marginal discriminabilities (Fig. 1b: Motion, Disparity bars), and has an intuitive geometrical interpretation: by Pythagoras’ theorem, the separation between shapes is greater along the diagonal than along the component dimensions.
Figure 1.
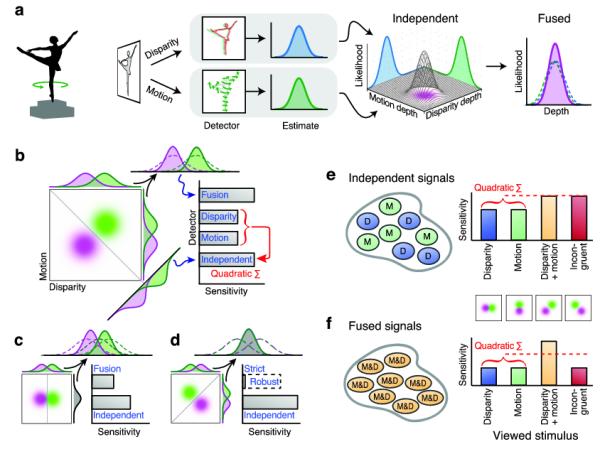
A. Cartoon of depth processing: depth of the ballerina figurine is estimated from disparity and motion, producing a bivariate Gaussian (3D plot with purple blob). Fusion combines disparity and motion using maximum likelihood estimation, producing a univariate ‘depth’ estimate.
B. Discriminating two shapes (‘Margot’ vs. ‘Darcy’) defined by bivariate Gaussians (purple and green blobs). We envisage four types of detector: ‘disparity’ and ‘motion’ respond to only one dimension (i.e. discrimination of the marginals); the ‘independent’ detector uses the optimal separating plane (grey line on the negative diagonal); the ‘fusion’ detector integrates cues.
C. ‘Single’ cue case: shapes differ in disparity but motion is the same. The optimal separating plane is now vertical (independent detector), while the fusion mechanism is compromised.
D. Incongruent cues: disparity and motion indicate opposite depths. Independent performance matches Fig 1b while fusion is illustrated for two scenarios: strict (detector is insensitive) and robust (dotted bar – performance reverts to one component).
E. Predicted measurements of independent units. Four types of stimuli are displayed: ‘disparity’ (Fig 1c), ‘motion’ (motion indicates a depth difference, disparity specifies the same depth), ‘Disparity+motion’ (Fig 1b), and ‘incongruent’ (Fig 1d).
F. Predicted measurements of fused units. Note that performance in the Motion and Disparity conditions is lower than in panel e.
The alternative possibility is an optimal fusion mechanism that combines the component dimensions into a single (‘depth’) dimension. This reduces variance, thereby improving discriminability (Fig. 1b: Fusion bar). Disparity and motion typically signal the same structure, making the predictions of independence and fusion equivalent (Fig. 1b). However, the alternatives are dissociated by manipulating the viewed shapes experimentally (Fig. 1c,d), to effect different predictions for independence (Fig. 1e) and fusion (Fig. 1f).
Here we tested for cue integration at the levels of behavior and fMRI responses. We presented a central plane that was nearer or farther than its surround (Fig. 2a). When viewing this stimulus, some neurons will respond to ‘near’ positions and others ‘far’17, producing a dissociable pattern of activity. fMRI measures this activity at the scale of neuronal populations; nevertheless multivoxel pattern analysis (MVPA) provides a sensitive tool to reveal depth selectivity in human cortex18. Here we decoded fMRI responses evoked when viewing ‘near’ or ‘far’ depths defined by binocular disparity, relative motion, and these signals in combination.
Figure 2.
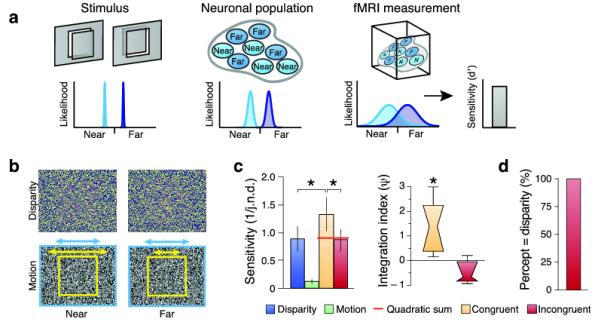
A. Cartoon of the decoding approach. Participants view stimuli that depict ‘near’ or ‘far’ depths. These differentially excite neuronal populations within an area of cortex. fMRI measurements reduce the resolution. We characterize the sensitivity of the decoding algorithm in discriminating near and far stimuli.
B. Illustrations of disparity and motion defined depth stimuli. The top row provides stereograms to be viewed through red-green anaglyphs. The bottom row provides a cartoon of the relative motion stimuli: yellow arrow speed of target, blue arrow speed of background.
C. Behavioural tests of integration. Data show observers’ mean sensitivity (N=7) with the between-subjects SEM. The red horiztonal line indcates the quadratic summation prediction. The adjacent plot shows the results as an integration index for the congruent and incongruent conditions. A value of zero indicates the minimum bound for fusion. Data are presented as notched distribution plots. The center of the ‘bow tie’ represents the median, the edges depict 68% confidence values, and the upper and lower error bars 95% confidence intervals.
D. The results of an experiment in which observers (N=4) reported whether the stimulus was near or far in the incongruent cue stimulus. Data are expressed as the percentage of trials on which reported depth matched depth from disparity.
We developed three tests for integration. First, we assessed whether discrimination performance in combined cue settings exceeds quadratic summation. Our logic was that a fusion mechanism is compromised when ‘single’ cues are presented (Fig. 1c). For example, a ‘single’ cue disparity stimulus contains motion information that the viewed surface is flat, depressing performance (contrast single cues in Fig. 1e vs. f). Thus, if ‘single’ cue data are used to derive a prediction for the concurrent stimulus, measured performance will exceed quadratic summation. We used this test to establish a minimum bound for fusion, as considerations of fMRI signal generation and measurement (e.g. scanner noise) entail that this test cannot rule out independence (see Discussion). Second, we determined whether improved performance is specific to congruent cues (Fig. 1e vs. f). An independence mechanism should be unaffected by incongruency (Fig. 1d) as quadratic summation ignores the sign of differences. However, a fusion mechanism would be affected: a strict fusion mechanism would be insensitive, while a robust mechanism would revert to a single component. Third, motivated by psychophysical reports of cross-adaptation between cues13-15, we determined whether depth from one cue (e.g. disparity) is diagnostic of depth from the other (e.g. motion).
To foreshadow our findings, we found that decoding fMRI responses from area V3B/KO surpasses the minimum bound, was specific for consistent depth cues, and supported a transfer between cues. This suggests a region involved in representing depth from integrated cues, whose activity may underlie improved behavioral performance in multi-cue settings.
Results
Psychophysics
We presented participants with random dot patterns (Fig. 2b) depicting depth from: (1) binocular disparity, (2) relative motion and (3) the combination of disparity and motion. To test for integration psychophysically, we presented two stimuli sequentially with a slight depth difference between them and participants decided which had the greater depth (i.e. which was nearer or farther depending on whether near or far stimuli were shown). Using a staircase procedure, we assessed observers’ sensitivity under four conditions by measuring just noticeable difference (j.n.d.) thresholds (Fig. 2c). We found that observers were most sensitive when disparity and motion concurrently signaled depth differences, and least sensitive for motion-defined differences. Using performance in the ‘single’ cue (disparity; motion) conditions, we generated a quadratic summation prediction for the combined cue (disparity and motion) case. In line with the expectations of fusion, performance for congruent cues exceeded quadratic summation (F1,6=8.16; p=0.015). Moreover, when disparity and motion were incongruent, sensitivity was lower (F1,6=11.07; p=0.016) and comparable to performance in the ‘single cue’ disparity condition (F1,6<1; p=0.809). To quantify this effect, we calculated a psychophysical integration index (ψ):
| (1) |
where SD+M is the observer’s sensitivity (1/j.n.d.) in the combined condition, and SD and SM correspond to sensitivity in the ‘single cue’ conditions (cf. 19). A value of zero indicates the minimum bound for fusion (i.e. quadratic sum). Bootstrapping the index revealed that observers’ sensitivity exceeded the minimum bound for consistent-(p<0.001) but not inconsistent (p=0.865) cue conditions. Additional tests (Supplementary Fig 1 online) provided further psychophysical evidence of cue integration.
fMRI quadratic summation
To examine the neural basis of disparity and motion integration, we measured fMRI responses in independently localized regions of interest (ROIs) (Fig. 3). We then used multivariate pattern analysis (MVPA) to determine which areas contained fMRI signals that enabled a support vector machine (SVM) to discriminate reliably between targets presented closer or farther than the fixation plane.
Figure 3.
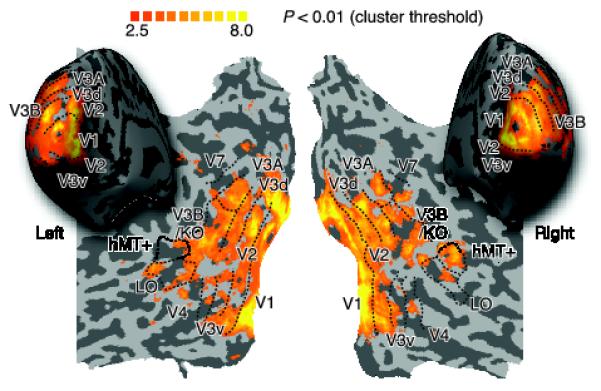
Representative flatmaps showing the left and right visual regions of interest from one participant. The maps show the location of retinotopic areas, V3B/KO, the human motion complex (hMT+/V5) and the lateral occipital (LO) area. Regions were defined using independent localizers. Sulci are coded in darker gray than the gyri. Superimposed on the maps are the results of a group searchlight classifier analysis that moved itteratively throughout the entire volume of cortex measured, discriminating between ‘near’ and ‘far’ depth positions18. The colour code represents the t-value of the classification accuracies obtained. This analysis confirmed that we had not missed any important areas outside those localized independently.
Both disparity- and motion-defined depth were decoded reliably, and there was a clear interaction between conditions and areas (Fig. 4a; F7.1,135.1=6.50; p<0.001). However, our principle interest was not in ‘single’ cue processing, or in contrasting overall prediction accuracies between areas (these are influenced by a range of non-neuronal factors). Rather, we were interested in relative performance under conditions in which disparity and motion concurrently signaled depth. Prediction accuracies for the concurrent stimulus were statistically higher than the component cue accuracies in areas V3A (F2,38=7.07; p=0.002) and V3B/KO (F1.5,28.9=14.35; p<0.001). To assess integration, we calculated the minimum bound prediction (red lines in Fig. 4a) based on quadratic summation. We found that fMRI responses in V3B/KO supported decoding performance that exceeded the minimum bound (F1,19=4.99, p=.019), but not elsewhere. We quantified this effect across areas using an fMRI integration index ( ):
):
| (2) |
where
is the classifier’s performance in the congruent condition, and and are performance for ‘single’ cue conditions. The values of differed between areas (Fig. 3b; F4.5,86.6=3.14, p=0.014), with a value significantly above zero only in V3B/KO (Table 1). This suggests an area in which improved decoding performance may result from the fusion of disparity and motion (although this test cannot rule out independence).
Figure 4.
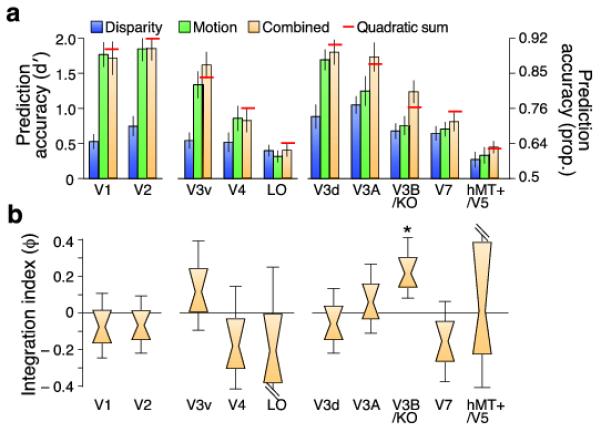
A. Prediction accuracy for near vs. far discrimination in different regions of interest. The red lines illustrate the accuracy expected from the quadratic summation of discriminabilities for the ‘single’ cue conditions. Error bars depict the SEM.
B. Results as an integration index. A value of zero indicates the minimum bound for fusion (i.e. the prediction based on quadratic summation). Data are presented as notched distribution plots. The center of the ‘bow tie’ represents the median, the grey-shaded area depicts 68% confidence values, and the upper and lower error bars 95% confidence intervals.
Table 1.
Probabilities associated with obtaining a value of zero for (i) the fMRI integration index, and (ii) the prediction accuracy difference between congruent and incongruent stimulus conditions. Values are from a bootstrapped resampling of the individual participants’ data. Bold formating indicates Bonferoni-corrected significance.
| p-value | ||
|---|---|---|
| Cortical area | Integration index above zero |
Congruent vs. incongruent |
| V1 | 0.789 | 0.523 |
| V2 | 0.799 | 0.419 |
| V3v | 0.150 | 0.079 |
| V4 | 0.880 | 0.486 |
| LO | 0.838 | 0.262 |
| V3d | 0.733 | 0.203 |
| V3A | 0.265 | 0.148 |
| V3B/KO | 0.001 | 0.004 |
| V7 | 0.915 | 0.247 |
| hMT+/V5 | 0.479 | 0.499 |
A possible concern is that there is a gain change in the fMRI response when testing disparity and motion concurrently relative to ‘single’ cues, and this enhances decoding accuracy (e.g. in V3B/KO). However, fMRI signals in each ROI (Supplementary Fig. 2a online) showed no evidence for reliable differences in responsiveness between conditions (F2,38=2.51, p=0.094). Another possibility is that fMRI noise is reduced when cues concurrently signal depth, supporting better decoding. To assess this possibility, we created a composite dataset by averaging raw fMRI responses from the ‘single’ cue conditions. However, prediction accuracies were lower for this composite dataset than for the concurrent condition in V3B/KO, indicating that a simple noise reduction did not explain the result (Supplementary Fig. 2b online; F4.9,93.8=3.74, p=0.004).
Congruent vs. incongruent cues
To provide a stronger test for integration, we manipulated both disparity and motion, but placed these cues in extreme conflict (i.e., an exaggerated conflict over our ‘single’ cue conditions). For each stimulus, one cue signaled ‘near’ and the other ‘far’ (Fig. 1d). If depth from the two cues is independent, this manipulation should have no effect. (Note that the SVM distinguishes the stimulus classes that evoked voxel responses, thus an objectively correct answer exists for the classifier).
Consistent with the idea that V3B/KO fuses signals, discrimination performance was significantly lower when motion and disparity conflicted (Fig. 5a; Table 1), with accuracy falling to the level of the ‘single’ cue components. There was a significant difference between congruent and incongruent conditions (F1,6=7.49, p=0.034), but no significant difference between the incongruent condition and the ‘single’ cue disparity (F1,6<1, p=0.62) or relative motion (F1,6=1.13, p=0.33) conditions. This robust behavior in the face of extreme conflicts matches perception: conflicts are accommodated within bounds, but thereafter one component is ignored20. Our participants relied on disparity when perceiving the incongruent stimulus (Fig. 2c,d). Other visual areas (notably V3v, V3d and V3A), also supported lower prediction accuracies for the incongruent cues (Fig. 5a), although these differences were not statistically reliable (Table 1).
Figure 5.
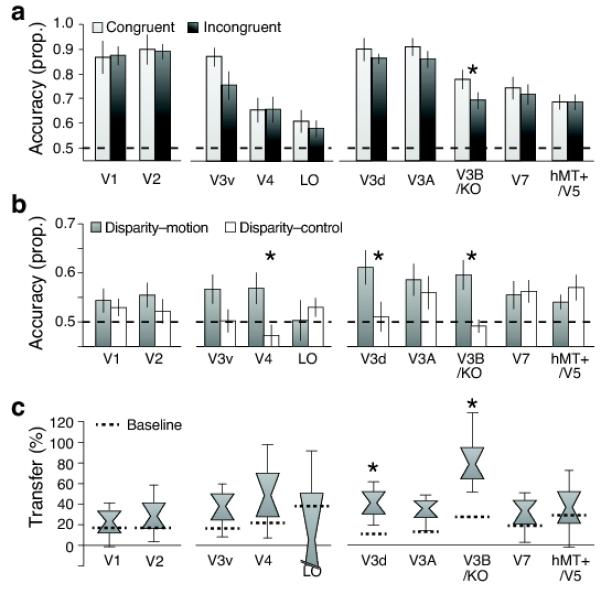
A. Prediction accuracy for near vs. far classification when cues are congruent (Fig. 1b) or incongruent (Fig. 1d). Error bars show SEM. The dotted horizontal line at 0.5 corresponds to chance performance for this binary classification.
B. Prediction accuracy for the cross-cue transfer analysis. Two types of transfer are depicted: between moiton and disparity (gray bars) and between disparity and a flat motion control stimulus (white bars). Classification accuracies are generally lower than for the standard SVM analysis (Fig. 4a); this is not surprising given the considerable differences between the stimuli that evoked the training and test fMRI responses. Error bars show SEM.
C. Data shown as a transfer index. A value of 100% would indicate that prediction accuracies were equivalent for within- and between- cue testing. Distribution plots show the median, 68% and 95% confidence intervals. Dotted horizontal lines depcit a bootstrapped chance baseline based on the upper 95th centile for transfer obtained with randomly permutted data.
Transfer test
To obtain a further test for similarities in responses to the two cues, we asked whether depth information provided by one cue (e.g. disparity) is diagnostic of depth indicated by the other (e.g. motion). We performed a cross-cue transfer test whereby we trained a classifier to discriminate depth configurations using one cue, and tested the classifier’s predictions for data obtained when depth was indicated by the other cue.
To accompany this analysis, we employed a control condition that addressed differences in average velocity that arose from the relative motion stimuli. In particular, when we presented motion-defined depth, the classifier might have discriminated movement speed rather than depth position (this likely explains high accuracies for motion in early visual areas, Fig 4a). To control for speed differences, we presented stimuli in which the central target region moved with a fast or slow velocity, but there was no moving background, meaning that participants had no impression of relative depth. We reasoned that an area showing a response specific to depth would show transfer between relative motion and disparity, but not between the motion control and disparity.
We observed a significant interaction between accuracy in the transfer tests across regions of interest (Fig. 5b; F9,63=3.88, p=0.001). In particular, higher responses for the depth transfer (disparity-relative motion) than the control (disparity-control) were significant in areas V4, V3d and V3B/KO (Table 2). To assess the relationship between transfer classification performance () and the mean performance for the component cues (i.e.), we calculated a bootstrapped transfer index.
| (3) |
Table 2.
Probabilities associated with (i) obtaining zero difference between decoding performance in the disparity-to-relative motion and disparity-to-motion control transfer tests; (ii) probability associated with zero difference between the value of the transfer index in the disparity-to-relative motion condition compared to random (shuffled) performance. These p-values are calculated using bootstrapped resampling with 10,000 samples. Bold formating indicates Bonferoni-corrected significance.
| p-value | ||
|---|---|---|
| Cortical area | Difference between transfer and control accuracies |
Transfer index from chance |
| V1 | 0.273 | 0.279 |
| V2 | 0.068 | 0.168 |
| V3v | 0.024 | 0.061 |
| V4 | 0.002 | 0.102 |
| LO | 0.778 | 0.758 |
| V3d | 0.001 | 0.002 |
| V3A | 0.121 | 0.012 |
| V3B/KO | <0.001 | <0.001 |
| V7 | 0.590 | 0.141 |
| hMT+/V5 | 0.815 | 0.302 |
This suggested that transfer test performance was most similar to within-cue decoding in area V3B/KO (Fig. 5c). Specifically, transfer performance was around 80% of that obtained when training and testing on the same stimuli. To assess the amount of transfer that arises by chance, we conducted the transfer test on randomly permuted data (1000 tests per area). This baseline value (dotted horizontal lines in Fig 5c) indicated that transfer between cues was significant in areas V3d and V3B/KO (Table 2). In conjunction with our previous findings, this suggests that responses in V3B/KO relate to a more generic representation of depth.
Decoding simulated populations
So far, we have considered two extreme scenarios: independence vs. fusion. However, there are computational and empirical reasons to believe that responses might lie between these poles. Computationally, it is attractive to estimate depth based on both (a) fusion and (b) independence, to determine whether or not cues should be integrated21. Empirically, it is unlikely we sampled voxels that respond only to fused signals as our region of interest localizers were standardized tests that do not target fusion. Thus, it is probable that some voxels (i.e. within V3B/KO) do not reflect integrated cues. To evaluate how a population mixture might affect decoding results, we used simulations to vary systematically the composition of the neuronal population. We decoded simulated voxels whose activity reflected neural maps based on (i) fused depth, (ii) interdigitated, independent maps for disparity and motion and (iii) a mixture of the two.
First, to characterize how different parameters affected these simulations, we tested a range of columnar arrangements for disparity and motion, different amounts of voxel and neuronal noise, and different relative reliabilities for the disparity and motion cues (Supplementary Figs. 5, 6 online). We chose parameter values that matched our fMRI data as closely as possible (e.g., signal-to-noise ratio) and corresponded to published data (e.g. spatial period of disparity representations17). These simulations demonstrated the experimental logic, confirming that fused cues surpass quadratic summation (Supplementary Fig. 5b online), and independent representations are unaffected by large conflicts and do not support transfer (Supplementary Fig. 6c online). Second, we explored the composition of the neuronal population, comparing our simulation results to our empirical data (Fig. 6). We found a close correspondence between the fMRI decoding data from V3B/KO and a simulated population in which 50-70% of the neuronal population fuses cues (50% for strict fusion, 70% for robust fusion, based on minimizing the χ2 statistic).
Figure 6.
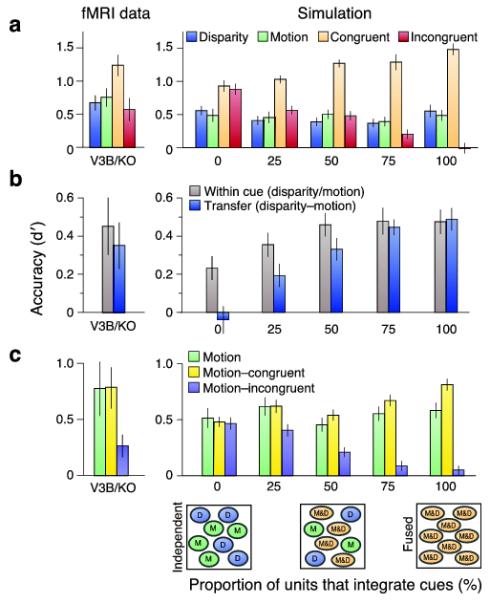
A. fMRI decoding data from V3B/KO adjacent to the simulation results. Simulation results show decoding performance of a simulated population of voxels where the neuronal population contains different percentages of units tuned to individual vs. fused cues. The χ2 statistic was used to identify the closest fit between empirical and simulated data from a range of popoulation mixtures. Error bars depecit SEM.
B. fMRI decoding data for the transfer tests adjacent to the simulation results. Error bars depecit SEM.
C. Performance in a transfer test between data from the motion condition and the consistent and inconsistent cue conditions. Error bars depecit SEM.
Control analyses
During scanning we took precautions to reduce the possibility of artifacts. First, we introduced a demanding task at fixation to ensure equivalent attentional allocation across conditions (Supplementary Fig. 3 online). Second, measurements of functional signal-to-noise ratio (fSNR) for each area (Supplementary Fig. 2c online) showed that differences in prediction accuracy related to stimulus-specific processing rather than the overall fMRI responsiveness. That is, fSNR was highest in the early visual areas rather than higher areas that showed fusion. Finally, eye movements are unlikely to account for our findings as we outline below.
First, while we could not measure eye vergence objectively in the scanner, the attentional task22 showed that participants maintained vergence well (Supplementary Fig. 3 online) with no reliable differences between conditions. Second, our stimuli were designed to reduce vergence changes: a low spatial frequency pattern surrounded the stimuli, and participants used horizontal and vertical nonius lines to promote correct eye alignment. Together with previous control data using similar disparities23, this suggests vergence differences could not explain our results. Third, monocular eye movement recordings suggested little systematic difference between conditions (Supplementary Fig. 4 online). Moreover, we showed that an SVM could not discriminate near vs. far positions reliably based on eye position, suggesting patterns of eye movement did not contain systematic information about depth positions (Supplementary Fig. 4 online).
Discussion
Estimating 3D structure in a robust and reliable manner is a principle goal of the visual system. A computationally attractive means of achieving this goal is to fuse information provided from two or more signals, so that the composite is more precise than its constituents. Despite considerable interest in this topic, comparatively little is known about the cortical circuits involved. Here we demonstrate that visual area V3B/KO may be important in this process, and propose that fusion is an important computation performed by the dorsal visual stream.
First we showed that fMRI signals from area V3B/KO are more discriminable when two cues concurrently signal depth, and this improvement exceeds the minimum bound expected for fusion. Second, we showed that improved performance is specific to congruent cues: presenting highly inconsistent disparity and motion information did not improve discriminability. This follows the predictions of integration, and matched perceptual judgments, but is not expected if disparity and motion signals are co-located, but independent. A potential issue of concern is whether the discrimination of brain signals relates to depth per se, or less interesting low-level correlates (e.g. speed of movement). We showed that while information about relative motion is diagnostic of depth from disparity, these cross-cue transfer effects are not found between perceptually-flat motion and disparity-defined depth. These results suggest a potential neural locus for interactions between disparity and motion depth cues demonstrated in threshold13 and suprathreshold psychophysical tasks14,15. More generally, they highlight V3B/KO as an area that may play an important role in integrating cues to estimate depth.
While our results point clearly to area V3B/KO, our different analyses (Fig. 4: quadratic summation; Fig. 5: congruent vs. incongruent, transfer test) suggested responses in other areas (i.e. V3, V3A) that, although not significant, might also relate to fusion. It is possible that our tests were not sufficiently sensitive to reveal fusion in these (or other) areas for which we have a null result; for instance, decoding accuracies for the motion condition were high in some areas, so responses in the congruent condition may have been near ceiling, limiting detection. However, an interesting alternative is that responses in these earlier areas represent an intermediate depth representation in which links between disparity and motion are not fully established. Previously it was suggested that the Kinetic Occipital (KO) area is specialized for depth structure24, and is functionally distinct from V3B. Using independent localizer scans, we do not find a reliable means of delineating V3B from KO. However, to check we were not mischaracterizing responses, we examined the spatial distribution of voxels chosen by the classifier. We found that chosen voxels were distributed throughout V3B/KO and did not cluster into subregions (Supplementary Fig. 7 online).
Relation between psychophysical and fMRI results
While results in V3B/KO are consistent with behavioral evidence for fusion, there is a difference in that sensitivity to the ‘single’ cues differs at the behavioral level (Fig. 2) but not at the decoding level (Fig. 3). From psychophysical results13, higher sensitivity to disparity-defined depth is expected. However, this would not necessarily translate to decoding differences. Specifically, our behavioral task measured increment thresholds (sensitivity to small depth differences) while fMRI stimuli were purposefully18 suprathreshold (the difference between ‘near’ and ‘far’ stimuli was very apparent). Thus, while clear parallels can be drawn between tests for integration at the psychophysical- and fMRI- levels, necessary differences between paradigms make it difficult to compare the magnitude of the effects directly.
Further, multi-sensory integration effects for single unit recordings are reported to be highly non-linear near threshold25, but more additive or subadditive with suprathreshold stimuli11,26,27. Our use of suprathreshold stimuli makes it unsurprising that we did not observe significant changes in overall fMRI responses (Supplementary Fig. 2 online). Moreover, it is important to note that we have not attempted to ‘add’ and ‘subtract’ cues (e.g., our ‘single’ cue relative motion stimulus contained disparity information that the viewed display was flat). Our manipulation purposefully changes the degree of cue conflict between cues, thereby establishing a minimum bound for fusion. While useful, testing against this bound alone cannot preclude independence. Specifically, fused cues should have reduced neuronal variability28, however, fMRI measures of this activity aggregate responses and are subject to additional noise (e.g. participant movement and scanner noise). Depending on the amount of noise, decoding independent representations can surpass the minimum bound (Supplementary Fig. 5 online). The subsequent tests we develop (incongruent cues; transfer test) are therefore important in confirming the results.
Finally, we outlined two variants for the fusion of strongly conflicting cues: strict vs. robust (Fig. 1d). Behaviorally, we found evidence for robust fusion: sensitivity in the incongruent cue condition matched the disparity condition (Fig. 2c), and perceived depth relied on disparity (Fig. 2d). This was compatible with fMRI results in V3B/KO (Fig. 5a), where performance dropped to the level of ‘single’ cues. However, we developed a further test of robust fusion: if responses in V3B/KO reflect robust perception, the classifier’s predictions might reverse for incongruent stimuli. That is, if depth is decoded at the perceptual level, training the classifier on ‘near’ motion may predict a ‘near’ perceptual interpretation of the incongruent stimulus, even though motion signals ‘far’. We did not find a reversal of discrimination performance (Fig. 6c), however performance was considerably reduced, suggesting an attenuated response. While this result per se does not match robust fusion, intriguingly it is compatible with a population mechanism for robust perception. In particular, depth estimation can be understood as causal inference21 in which the brain computes depth ‘both ways’ – i.e. there is a mixed population that contains both units tuned to (a) independent and (b) fused cues. A readout mechanism then selects one of the competing interpretations, using the relative reliability of the fused vs. independent models. This idea is compatible with our simulations of a mixed population in V3B/KO (Fig. 6c) and previous work that suggests V3B/KO plays an important role in selecting among competing depth interpretations29.
Cortical organization for depth processing
While there is comparatively little work on neural representation of depth from integrated visual cues, individual cues have been studied quite extensively. Responses to binocular disparity are observed through occipital, temporal and parietal cortices30,31 and there are links between the perception of depth from disparity and fMRI responses in dorsal and ventral areas18,32,33. Similarly, responses to motion defined depth have been observed in ventral, dorsal and parietal areas34-36. To link depth from disparity and motion, previous work has highlighted overlapping fMRI activations24,37-39. This suggests widespread cortical loci in which different cues converge; however, this does not imply the shared organizational structure that we demonstrate here.
Our tests of cue fusion reveal V3B/KO as the main cortical locus for depth cue integration. However, tests of motion parallax processing in the macaque highlighted area MT/V58. Given well-established disparity selectivity in MT/V517, this suggests a candidate for integrating depth cues. We observed discriminable fMRI responses for both disparity and relative motion in hMT+/V5 but did not obtain evidence for fusion. While it is possible this represents a species difference40, the difference may relate to different causes of motion. In particular, we simulated movement of a scene in front of a static observer, while previous work8 moved the participant in a static scene. Thus, in our situation, there was no potential for vestibular signals to contribute to the estimation of ego movement by mediotemporal cortex10,11.
In interpreting our results it is important to consider that the multi voxel pattern analysis approach we use is generally understood to rely on weak biases in the responses of individual voxels that reflect a voxel’s sample of neuronal selectivities and vasculature (41,42; although see 43,44). By definition, these signals reflect a population response, so our results cannot be taken to reveal fusion by single neurons. For instance, it is possible that depth is represented in parallel for (i) disparity and (ii) motion within area V3B/KO. However, if this is the case, these representations are not independent – they must share common organizational structure to account for our findings that (a) prediction accuracy falls to single component levels for incongruent stimuli and (b) training the classifier on one cue supports decoding of the other. It was suggested that MVPA of stimulus orientation relies on univariate differences across the visual field44. Such spatial organization for disparity preferences has not been identified in the human or macaque brain; however, this is a matter for further investigation. Our previous study18 and on-going work has not provided evidence of retinotopic disparity organization.
Independence vs. fusion
Previously, we tested cue combination by relating psychophysical and fMRI responses45. This highlighted ventral cortex (LOC) in cue integration, which is not the main locus observed here. Differences in stimuli may be responsible: we previously used slanted planes defined by disparity and perspective cues. Thus ventral areas may be more selective for ‘pictorial’ cues and/or be more selective for slanted surfaces than flat planes. Second, here we used a coarse task, while previously45 a fine judgment was made that may require greater ventral involvement31. However, next we discuss the possibility that the different cortical loci (dorsal vs. ventral) point to different types of computation.
In the Introduction, we presented two scenarios for optimal judgments: fusion vs. independence. Independence increases the separation between classes (e.g. ‘near’, ‘far’) but does not reduce variance, while fusion reduces the variance of estimates, but leaves separation unchanged. We suggest these two modes of operation may be exploited for different types of task. If a body movement is required, the brain is best served by fusing the available information to obtain an estimate of the scene that is unbiased and has low variance. Such a representation would be particular to the viewing situation (i.e. highly specific), and variant under manipulations of individual cues. In contrast, recognition tasks are best served by maximizing the separation of objects in a high-dimensional feature space, while ignoring uninformative dimensions. Such a mechanism would support invariant performance by discarding irrelevant ‘nuisance’ scene parameters, and/or changes in the reliability of individual cues, yet may be highly uncertain about the particular structure of the scene46. To illustrate the distinction, consider a typical desktop scene. If the observers’ goal is to discriminate a telephone from a nearby book, information about the 3D orientation on the tabletop is uninformative, so should be discounted from the judgment (i.e. the telephone’s features should be recognized while ignoring location). In contrast, to pick up the telephone, the brain should incorporate all the information relevant to the location from the current view.
Our previous tests of disparity processing18 suggest differences between the visual pathways: dorsal areas appear selective for metric disparity (i.e. the precise location of a plane) while ventral Lateral Occipital (LO) represents depth configuration (i.e. whether the stimulus is ‘near’ or ‘far’, but not how near or how far). The current findings bolster this suggested distinction by providing novel evidence for fusion in the dorsal pathway. We propose this provides the best metric information about the scene that is specific to the current view.
Supplementary Material
Acknowledgments
We thank Bosco Tjan, Roland Fleming and Andrew Glennerster for valuable discussions on the project. We thank the referees for their thoughtful and intelligent critiques of the work. The work was supported by fellowships to AEW from the Wellcome Trust [095183/Z/10/Z] and Biotechnology and Biological Sciences Research Council [C520620] and to HB from the Japan Society for the Promotion of Science [H22,290].
References
- 1.Dosher BA, Sperling G, Wurst SA. Tradeoffs between stereopsis and proximity luminance covariance as determinants of perceived 3D structure. Vision Res. 1986;26:973–990. doi: 10.1016/0042-6989(86)90154-9. [DOI] [PubMed] [Google Scholar]
- 2.Buelthoff HH, Mallot HA. Integration of Depth Modules - Stereo and Shading. Journal of the Optical Society of America a-Optics Image Science and Vision. 1988;5:1749–1758. doi: 10.1364/josaa.5.001749. [DOI] [PubMed] [Google Scholar]
- 3.Landy MS, Maloney LT, Johnston EB, Young M. Measurement and Modeling of Depth Cue Combination - in Defense of Weak Fusion. Vision Research. 1995;35:389–412. doi: 10.1016/0042-6989(94)00176-m. [DOI] [PubMed] [Google Scholar]
- 4.Clark JJ, Yuille AL. Data fusion for sensory information processing systems. Kluwer Academic; 1990. [Google Scholar]
- 5.Ernst MO, Banks MS. Humans integrate visual and haptic information in a statistically optimal fashion. Nature. 2002;415:429–433. doi: 10.1038/415429a. [DOI] [PubMed] [Google Scholar]
- 6.Knill DC, Saunders JA. Do humans optimally integrate stereo and texture information for judgments of surface slant? Vision Research. 2003;43:2539–2558. doi: 10.1016/s0042-6989(03)00458-9. [DOI] [PubMed] [Google Scholar]
- 7.Tsutsui K, Sakata H, Naganuma T, Taira M. Neural correlates for perception of 3D surface orientation from texture gradient. Science. 2002;298:409–412. doi: 10.1126/science.1074128. [DOI] [PubMed] [Google Scholar]
- 8.Nadler JW, Angelaki DE, DeAngelis GC. A neural representation of depth from motion parallax in macaque visual cortex. Nature. 2008;452:642–U610. doi: 10.1038/nature06814. [DOI] [PMC free article] [PubMed] [Google Scholar]
- 9.Liu Y, Vogels R, Orban GA. Convergence of depth from texture and depth from disparity in macaque inferior temporal cortex. J Neurosci. 2004;24:3795–3800. doi: 10.1523/JNEUROSCI.0150-04.2004. [DOI] [PMC free article] [PubMed] [Google Scholar]
- 10.Gu Y, Angelaki DE, Deangelis GC. Neural correlates of multisensory cue integration in macaque MSTd. Nat Neurosci. 2008;11:1201–1210. doi: 10.1038/nn.2191. [DOI] [PMC free article] [PubMed] [Google Scholar]
- 11.Morgan ML, Deangelis GC, Angelaki DE. Multisensory integration in macaque visual cortex depends on cue reliability. Neuron. 2008;59:662–673. doi: 10.1016/j.neuron.2008.06.024. [DOI] [PMC free article] [PubMed] [Google Scholar]
- 12.Rogers B, Graham M. Motion parallax as an independent cue for depth perception. Perception. 1979;8:125–134. doi: 10.1068/p080125. [DOI] [PubMed] [Google Scholar]
- 13.Bradshaw MF, Rogers BJ. The interaction of binocular disparity and motion parallax in the computation of depth. Vision Res. 1996;36:3457–3468. doi: 10.1016/0042-6989(96)00072-7. [DOI] [PubMed] [Google Scholar]
- 14.Nawrot M, Blake R. Neural integration of information specifying structure from stereopsis and motion. Science. 1989;244:716–718. doi: 10.1126/science.2717948. [DOI] [PubMed] [Google Scholar]
- 15.Poom L, Borjesson E. Perceptual depth synthesis in the visual system as revealed by selective adaptation. J Exp Psychol Hum Percept Perform. 1999;25:504–517. doi: 10.1037//0096-1523.25.2.504. [DOI] [PubMed] [Google Scholar]
- 16.Domini F, Caudek C, Tassinari H. Stereo and motion information are not independently processed by the visual system. Vision Res. 2006;46:1707–1723. doi: 10.1016/j.visres.2005.11.018. [DOI] [PubMed] [Google Scholar]
- 17.DeAngelis GC, Newsome WT. Organization of disparity-selective neurons in macaque area MT. J Neurosci. 1999;19:1398–1415. doi: 10.1523/JNEUROSCI.19-04-01398.1999. [DOI] [PMC free article] [PubMed] [Google Scholar]
- 18.Preston TJ, Li S, Kourtzi Z, Welchman AE. Multivoxel pattern selectivity for perceptually relevant binocular disparities in the human brain. J Neurosci. 2008;28:11315–11327. doi: 10.1523/JNEUROSCI.2728-08.2008. [DOI] [PMC free article] [PubMed] [Google Scholar]
- 19.Nandy AS, Tjan BS. Efficient integration across spatial frequencies for letter identification in foveal and peripheral vision. J Vis. 2008;8(3):1–20. doi: 10.1167/8.13.3. [DOI] [PMC free article] [PubMed] [Google Scholar]
- 20.Hillis JM, Ernst MO, Banks MS, Landy MS. Combining sensory information: mandatory fusion within, but not between, senses. Science. 2002;298:1627–1630. doi: 10.1126/science.1075396. [DOI] [PubMed] [Google Scholar]
- 21.Kording KP, et al. Causal Inference in Multisensory Perception. Plos One. 2007;2 doi: 10.1371/journal.pone.0000943. [DOI] [PMC free article] [PubMed] [Google Scholar]
- 22.Popple AV, Smallman HS, Findlay JM. Spatial integration region for initial horizontal disparity vergence. Investigative Ophthalmology and Visual Science. 1997;38:4225–4225. [Google Scholar]
- 23.Preston TJ, Kourtzi Z, Welchman AE. Adaptive estimation of three-dimensional structure in the human brain. J Neurosci. 2009;29:1688–1698. doi: 10.1523/JNEUROSCI.5021-08.2009. [DOI] [PMC free article] [PubMed] [Google Scholar]
- 24.Tyler CW, Likova LT, Kontsevich LL, Wade AR. The specificity of cortical region KO to depth structure. Neuroimage. 2006;30:228–238. doi: 10.1016/j.neuroimage.2005.09.067. [DOI] [PubMed] [Google Scholar]
- 25.Meredith MA, Stein BE. Interactions among converging sensory inputs in the superior colliculus. Science. 1983;221:389–391. doi: 10.1126/science.6867718. [DOI] [PubMed] [Google Scholar]
- 26.Avillac M, Hamed S. Ben, Duhamel JR. Multisensory integration in the ventral intraparietal area of the macaque monkey. J Neurosci. 2007;27:1922–1932. doi: 10.1523/JNEUROSCI.2646-06.2007. [DOI] [PMC free article] [PubMed] [Google Scholar]
- 27.Stanford TR, Quessy S, Stein BE. Evaluating the operations underlying multisensory integration in the cat superior colliculus. J Neurosci. 2005;25:6499–6508. doi: 10.1523/JNEUROSCI.5095-04.2005. [DOI] [PMC free article] [PubMed] [Google Scholar]
- 28.Ma WJ, Beck JM, Latham PE, Pouget A. Bayesian inference with probabilistic population codes. Nat Neurosci. 2006;9:1432–1438. doi: 10.1038/nn1790. [DOI] [PubMed] [Google Scholar]
- 29.Preston TJ, Kourtzi Z, Welchman AE. Adaptive estimation of three-dimensional structure in the human brain. Journal of Neuroscience. 2009;29:1688–1698. doi: 10.1523/JNEUROSCI.5021-08.2009. [DOI] [PMC free article] [PubMed] [Google Scholar]
- 30.Orban GA, Janssen P, Vogels R. Extracting 3D structure from disparity. Trends Neurosci. 2006;29:466–473. doi: 10.1016/j.tins.2006.06.012. [DOI] [PubMed] [Google Scholar]
- 31.Parker AJ. Binocular depth perception and the cerebral cortex. Nat.Rev.Neurosci. 2007;8:379–391. doi: 10.1038/nrn2131. [DOI] [PubMed] [Google Scholar]
- 32.Backus BT, Fleet DJ, Parker AJ, Heeger DJ. Human cortical activity correlates with stereoscopic depth perception. J Neurophysiol. 2001;86:2054–2068. doi: 10.1152/jn.2001.86.4.2054. [DOI] [PubMed] [Google Scholar]
- 33.Chandrasekaran C, Canon V, Dahmen JC, Kourtzi Z, Welchman AE. Neural correlates of disparity-defined shape discrimination in the human brain. Journal of Neurophysiology. 2007;97:1553–1565. doi: 10.1152/jn.01074.2006. [DOI] [PubMed] [Google Scholar]
- 34.Orban GA, Sunaert S, Todd JT, Van Hecke P, Marchal G. Human cortical regions involved in extracting depth from motion. Neuron. 1999;24:929–940. doi: 10.1016/s0896-6273(00)81040-5. [DOI] [PubMed] [Google Scholar]
- 35.Murray SO, Olshausen BA, Woods DL. Processing shape, motion and three-dimensional shape-from-motion in the human cortex. Cerebral Cortex. 2003;13:508–516. doi: 10.1093/cercor/13.5.508. [DOI] [PubMed] [Google Scholar]
- 36.Paradis AL, et al. Visual perception of motion and 3-D structure from motion: an fMRI study. Cereb Cortex. 2000;10:772–783. doi: 10.1093/cercor/10.8.772. [DOI] [PubMed] [Google Scholar]
- 37.Sereno ME, Trinath T, Augath M, Logothetis NK. Three-dimensional shape representation in monkey cortex. Neuron. 2002;33:635–652. doi: 10.1016/s0896-6273(02)00598-6. [DOI] [PubMed] [Google Scholar]
- 38.Durand JB, et al. Anterior regions of monkey parietal cortex process visual 3D shape. Neuron. 2007;55:493–505. doi: 10.1016/j.neuron.2007.06.040. [DOI] [PMC free article] [PubMed] [Google Scholar]
- 39.Peuskens H, et al. Attention to 3-D shape, 3-D motion, and texture in 3-D structure from motion displays. J Cogn Neurosci. 2004;16:665–682. doi: 10.1162/089892904323057371. [DOI] [PubMed] [Google Scholar]
- 40.Orban GA, et al. Similarities and differences in motion processing between the human and macaque brain: evidence from fMRI. Neuropsychologia. 2003;41:1757–1768. doi: 10.1016/s0028-3932(03)00177-5. [DOI] [PubMed] [Google Scholar]
- 41.Shmuel A, Chaimow D, Raddatz G, Ugurbil K, Yacoub E. Mechanisms underlying decoding at 7 T: ocular dominance columns, broad structures, and macroscopic blood vessels in V1 convey information on the stimulated eye. Neuroimage. 2010;49:1957–1964. doi: 10.1016/j.neuroimage.2009.08.040. [DOI] [PMC free article] [PubMed] [Google Scholar]
- 42.Kriegeskorte N, Cusack R, Bandettini P. How does an fMRI voxel sample the neuronal activity pattern: compact-kernel or complex spatiotemporal filter? Neuroimage. 2010;49:1965–1976. doi: 10.1016/j.neuroimage.2009.09.059. [DOI] [PMC free article] [PubMed] [Google Scholar]
- 43.Op de Beeck HP. Against hyperacuity in brain reading: spatial smoothing does not hurt multivariate fMRI analyses? Neuroimage. 2009;49:1943–1948. doi: 10.1016/j.neuroimage.2009.02.047. [DOI] [PubMed] [Google Scholar]
- 44.Freeman J, Brouwer GJ, Heeger DJ, Merriam EP. Orientation decoding depends on maps, not columns. J Neurosci. 2011;31:4792–4804. doi: 10.1523/JNEUROSCI.5160-10.2011. [DOI] [PMC free article] [PubMed] [Google Scholar]
- 45.Welchman AE, Deubelius A, Conrad V, Bülthoff HH, Kourtzi Z. 3D shape perception from combined depth cues in human visual cortex. Nature Neuroscience. 2005;8:820–827. doi: 10.1038/nn1461. [DOI] [PubMed] [Google Scholar]
- 46.Tjan BS, Lestou V, Kourtzi Z. Uncertainty and invariance in the human visual cortex. J Neurophysiol. 2006;96:1556–1568. doi: 10.1152/jn.01367.2005. [DOI] [PMC free article] [PubMed] [Google Scholar]
- 47.Dupont P, et al. The kinetic occipital region in human visual cortex. Cerebral Cortex. 1997;7:283–292. doi: 10.1093/cercor/7.3.283. [DOI] [PubMed] [Google Scholar]
- 48.Serences JT, Boynton GM. The representation of behavioral choice for motion in human visual cortex. J Neurosci. 2007;27:12893–12899. doi: 10.1523/JNEUROSCI.4021-07.2007. [DOI] [PMC free article] [PubMed] [Google Scholar]
- 49.De Martino F, et al. Combining multivariate voxel selection and support vector machines for mapping and classification of fMRI spatial patterns. Neuroimage. 2008;43:44–58. doi: 10.1016/j.neuroimage.2008.06.037. [DOI] [PubMed] [Google Scholar]
- 50.Kamitani Y, Tong F. Decoding the visual and subjective contents of the human brain. Nature Neuroscience. 2005;8:679–685. doi: 10.1038/nn1444. [DOI] [PMC free article] [PubMed] [Google Scholar]
Associated Data
This section collects any data citations, data availability statements, or supplementary materials included in this article.