Abstract
Acetaminophen (APAP) overdose causes acute liver failure in humans and rodents due in part to the destruction of mitochondria as a result of increased oxidative stress followed by hepatocellular necrosis. Activation of the peroxisome proliferator-activated receptor α (PPARα), a member of the nuclear receptor superfamily that controls the expression of genes encoding peroxisomal and mitochondrial fatty acid β-oxidation enzymes, with the experimental ligand Wy-14,643 or the clinically-used fibrate drug fenofibrate, fully protects mice from APAP-induced hepatotoxicity. PPARα-humanized mice were also protected while Ppara-null mice were not, thus indicating that the protection extends to human PPARα and is PPARα-dependent. This protection is due in part to induction of the PPARα target gene encoding mitochondrial uncoupling protein 2 (UCP2). Forced overexpression of UCP2 protected wild-type mice against APAP-induced hepatotoxicity in the absence of PPARα activation. Ucp2-null mice, however, were sensitive to APAP induced hepatotoxicity despite activation of PPARα with Wy-14,643. Protection against hepatotoxicity by UCP2-induction through activation of PPARα, is associated with decreased APAP-induced c-jun and c-fos expression, decreased phosphorylation of JNK and c-jun, lower mitochondrial H2O2 levels, increased mitochondrial glutathione in liver, and decreased levels of circulating fatty acyl-carnitines. These studies indicate that the PPARα target gene UCP2 protects against elevated reactive oxygen species generated during drug-induced hepatotoxicity and suggest that induction of UCP2 may also be a general mechanism for protection of mitochondria during fatty acid β-oxidation.
INTRODUCTION
Peroxisome proliferator-activated receptor α (PPARα), a member of the nuclear receptor superfamily, controls the expression of a battery of genes involved in lipid homeostasis including those encoding peroxisomal and mitochondrial enzymes that carry out fatty acid catabolism. PPARα is mainly expressed in organs that are critical in fatty acid catabolism, such as liver, heart, and kidney (1-3). Perhaps the most critical role of PPARα is to modulate hepatic fatty acid catabolism. In untreated mice, PPARα controls constitutive expression of mitochondrial fatty acid β-oxidation enzymes (4). During periods of starvation in mice, PPARα is activated resulting in induction of both mitochondrial and peroxisomal fatty acid catabolism (5). Notably in the course of spontaneous and ligand-induced activation of fatty acid catabolism, excess H2O2 is produced as a byproduct of induction of peroxisomal acyl-CoA oxidase. Reactive oxygen species (ROS) are also produced during mitochondrial fatty acid β-oxidation. While this increase in H2O2 is dealt with in part by catalase, glutathione peroxidase, and manganese superoxide dismutase, the cellular responses to ROS are saturated upon the massive activation of fatty acid catabolism that occurs upon ligand activation of PPARα. Consequently, increased PPARα activity during accelerated fatty acid catabolism is associated with increased expression of free radical scavengers such as catalase and Cu/Zn dismutase (6) and mitochondrial uncoupling proteins (UCPs) that may serve to reduce mitochondrial ROS levels (7, 8). Both direct and indirect effects suggest that PPARα may serve a protective role to combat the deleterious side effects of fatty acid catabolism thus preserving, in particular, mitochondrial function.
Increased ROS levels are frequently associated with hepatotoxicity produced by overdose of drugs such as acetaminophen (APAP). APAP, the most common nonprescription analgesic used for pain relief and antipyresis, is a representative compound that causes liver toxicity upon overdose and is a significant public health concern due to frequent overdose in children and adults (9, 10). A reactive quinone metabolite, N-acetyl-p-benzoquinone imine (NAPQ1), generated by cytochrome P450-catalyzed oxidation, triggers hepatic toxicity by covalently binding with nucleophilic macromolecules and/or by elevating ROS leading to apoptosis and cell necrosis (11).
Interestingly a connection between PPARα and APAP toxicity was established when it was discovered that pretreatment with clofibrate, a PPARα activator, protected mice against APAP-induced hepatotoxicity (12, 13) and that this protection was PPARα-dependent (14). Furthermore, it was recently reported that toxic doses of APAP inhibit fatty acid ß-oxidation and that these effects were significantly reduced in mice lacking the major enzyme responsible for the bioactivation of APAP, CYP2E1, due in part, to enhanced and persistent activation of PPARα and its target genes (15). Wild-type mice treated with APAP, however, showed suppressed PPARα activity. Thus, PPARα may function to protect mitochondria from ROS that occurs during APAP metabolism and as a natural consequence during fatty acid catabolism. In the present study, the protective effects of PPARα activation during APAP-induced hepatotoxicity were further investigated and a role for the PPARα target gene activation UCP2 in mediating these protective effects explored.
EXPERIMENTAL PROCEDURES
Animals
Wild-type (C57Bl/6J) and ucp2-null (B6.129-Ucp2tm1Low1/J) mice were obtained from the Jackson Laboratories (Bar Harbor, Maine). Ppara-null mice and wild-type counterparts on the 129/Sv background were described previously (16). The PPARα-humanized were described previously (17). All animal experiments were carried out in accordance with the Institute of Laboratory Animal Resources guidelines and approved by the National Cancer Institute Animal Care and Use Committee.
Acetaminophen Experiments
Groups of 6-8 week-old male mice were fed Wy-14,643 (0.1%) diet for 24h before an intraperitoneal injection of APAP (400 mg/kg) dissolved in saline. All mice were euthanized by CO2 asphyxiation 2h, 6h, or 24h after the APAP dose. Livers were harvested and stored at −80°C before analysis. To assess liver damage, tissue was briefly washed with PBS, and fixed in 10% neutral buffered formalin. Necrosis was scored by hematoxylin and eosin-staining. APAP-induced liver injury was determined by measuring aspartate aminotransferase (AST) and alanine aminotransferase (ALT) catalytic activities in serum using a commercial AST or ALT assay kit (Catachem, Bridgeport, CT). Reduced glutathione (GSH) levels in liver were measured by a glutathione assay kit (Sigma-Aldrich, St. Louis, MO), and liver hydrogen peroxide (H2O2) levels were determined by use of the Peroxidetect kit (Sigma-Aldrich, St. Louis, MO).
RNA Analysis
Dye-coupled cDNAs were purified with a MiniElute PCR purification kit (QIAGEN) and hybridized to an Agilent 44 K mouse 60-mer oligo microarray (Agilent Technologies, Santa Clara, CA). The data were processed and analyzed by Genespring GX software (Agilent Technologies). Significance was determined as >10-fold to the wild-type control samples. Specific mRNA levels were determined by quantitative real-time polymerase chain reaction (qPCR). RNA was extracted using TRIzol reagent (Invitrogen, Carlsbad, CA) and qPCR performed using cDNA generated from 1 μg of total RNA with SuperScript II Reverse Transcriptase (Invitrogen, Carlsbad, CA). Primers for qPCR were designed using the Primer Express software (Applied Biosystems, Foster City, CA). qPCR reactions were carried out using the SYBR Green PCR master mix (SuperArray, Frederick, MD) and an ABI Prism 7900HT Sequence Detection System (Applied Biosystems). Quantitation was carried out using the comparative cycle threshold (CT) method, and results were normalized to mouse β-actin.
Generation and Infection of the Adenovirus Constructs Expressing Recombinant UCP2
Rat UCP2 adenovirus was obtained from the Gene Transfer Vector Core, University of Iowa (18). For in vivo infection of recombinant adenoviruses, 6- to 8-week-old wild-type mice were intravenously injected in the tail vein with 1.2 × 10¹⁰ infection units, in a total volume of 400 μl, of recombinant adenoviruses expressing UCP2 or with an adenovirus expressing Cre recombinase used as a control. Two days later, mice were administered APAP and the mice killed after 6h or 24h.
Western Blot Analysis
Liver whole cell or mitochondrial extracts were prepared and subjected to electrophoresis on SDS-PAGE. Membranes were incubated with antibodies against CYP2E1, total JNK, p-JNK (Cell Signaling Technologies, Danvers, MA), or UCP2 (Santa Cruz Biotechnology, Santa Cruz, CA). JNK kinase assays were performed using the non-radioactive SAPK/JNK kinase assay kit (Cell Signaling Technologies) according to the manufacturer’s instructions.
Quantitation of APAP Metabolites and Serum Palmitoylcarnitine
APAP serum metabolites (APAP, APAP-NAC, APAP-glucuronide, APAP-CYS) were monitored as previously described (19). For serum palmitoylcarnitine, deproteinated serum samples from wild-type mice were analyzed by use of an API2000 triplequadrupole mass spectrometer (Applied Biosystems, Foster City, CA). Debrisoquine was used as internal standard. Samples were injected into a high-performance liquid chromatography (HPLC) system (PerkinElmer, Waltham, MA) using a Luna C18 column (Phenomenex, Torrance, CA, 50 × 2.1 mm i.d.). The flow rate through the column at ambient temperature was 0.3 mL/min with a gradient (methanol: water: acetonitrile, containing 0.1% formic acid) from 5: 60: 35 to 5: 5: 90 in a 6-min run. The column was equilibrated for 1.5 min before each injection. The mass spectrometer was operated in the turbo ion spray mode with positive ion detection; the turbo ion spray temperature was maintained at 350°C, and a voltage of 4.5 kV was applied to the sprayer needle. Nitrogen was used as the turbo ion spray and nebulizing gas. Detection and quantification were performed using the multiple reactions monitoring mode, with m/z 400.3/85.0 for palmitoylcarnitine and m/z 176.1/134.2 for debrisoquine. Using Analyst software (Applied Biosystems), serum palmitoylcarnitine concentrations were determined by calculating the ratio between the peak area of palmitoylcarnitine and the peak area of debrisoquine and fitting with a calibration curve with a linear range from 10 nM to 1 μM (r = 0.99).
Statistical Analysis
Statistical analysis was performed using GraphPad Prism (San Diego, CA). ANOVA with Bonferroni’s multiple comparison test was used to compare the various groups. P-values less than 0.05 were considered significant.
RESULTS
Wy-14,643 Pretreatment Protects Against APAP-induced Hepatotoxicity
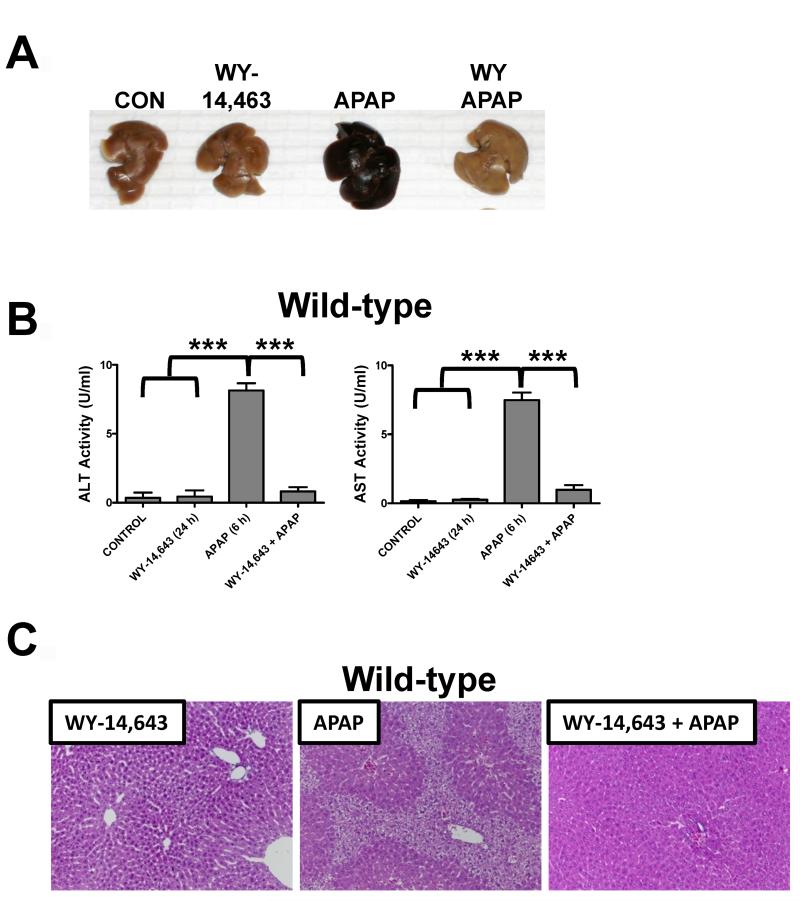
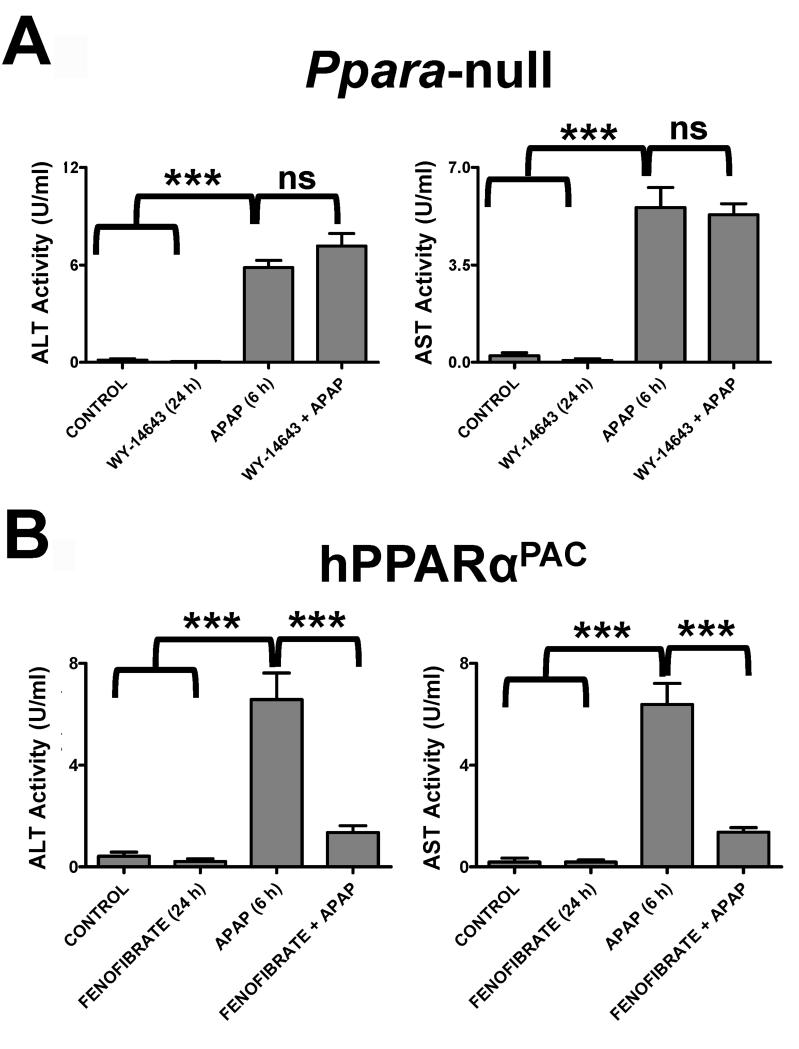
Treatment of wild-type mice with APAP for 6h results in massive hepatic toxicity as revealed by gross morphology of the liver (Figure 1A), increased ALT and AST enzyme levels (Figure 1B), and faint pericentral and periportal H&E staining of liver parenchyma (Figure 1C). Pretreatment with Wy-14,643 for 24h before APAP treatment results in total protection against APAP toxicity; Wy-14,643 treated mice had no evidence of liver damage. At 24h post-APAP treatment, Wy-14,643 treated mice were still protected as indicated by reduced ALT enzyme levels and normal liver histology (Supplemental Figure 1). In contrast, Ppara-null mice exhibited no Wy-14,643 protection against APAP toxicity (shown by increased ALT and AST activities), indicating that the protection was PPARα-dependent (Figure 2A). To demonstrate that the effect was not specific to the experimental ligand Wy-14,643 and to mouse PPARα, PPARα-humanized mice (a human PPARα gene introduced in the Ppara-null background) treated with fenofibrate were also protected (Figure 2B). However, mice treated with the anti-Fas antibody Jo-2 to stimulate Fas receptor-mediated apoptosis, were not protected from Wy-14,643 pre-treatment (Supplemental Figure 2). Pre-treatment with Wy-14,643 did not significantly impact APAP metabolism as demonstrated by serum profiling of APAP and its metabolites (APAP-NAC, APAP-glucuronide, APAP-CYS) 2h after APAP administration (Supplemental Figure 3).
Figure 1.
Wy-14,643 protects against APAP-induced liver toxicity. Mice were fed a diet containing 0.1% Wy-14,643 24h prior to treatment with APAP. (A) Representative livers from control, Wy-14,643-treated, APAP-treated, and Wy-14,643/APAP-treated wild-type mice. (B) Serum AST and ALT enzyme levels from control, Wy-14,643-treated, APAP-treated and Wy-14,643/APAP-treated wild-type mice. (C) H&E staining of livers from Wy-14,643-treated, APAP-treated, and Wy-14,643/APAP-treated wild-type mice. ***p<0.001.
Figure 2.
Wy-14,643 protects against APAP-induced liver toxicity. Mice were fed a diet containing 0.1% Wy-14,643 24h prior to treatment with APAP. (A) Serum AST and ALT enzyme levels from control, Wy-14,643-treated, APAP-treated and Wy-14,643/APAP-treated Ppara-null mice. (B) Serum AST and ALT enzyme levels from control, Wy-14,643-treated, APAP-treated and Wy-14,643/APAP treated hPPARaPAC mice. ***p<0.001; ns, not significant.
Wy-14,643 Blocks APAP-induced Hepatic Stress Response Genes
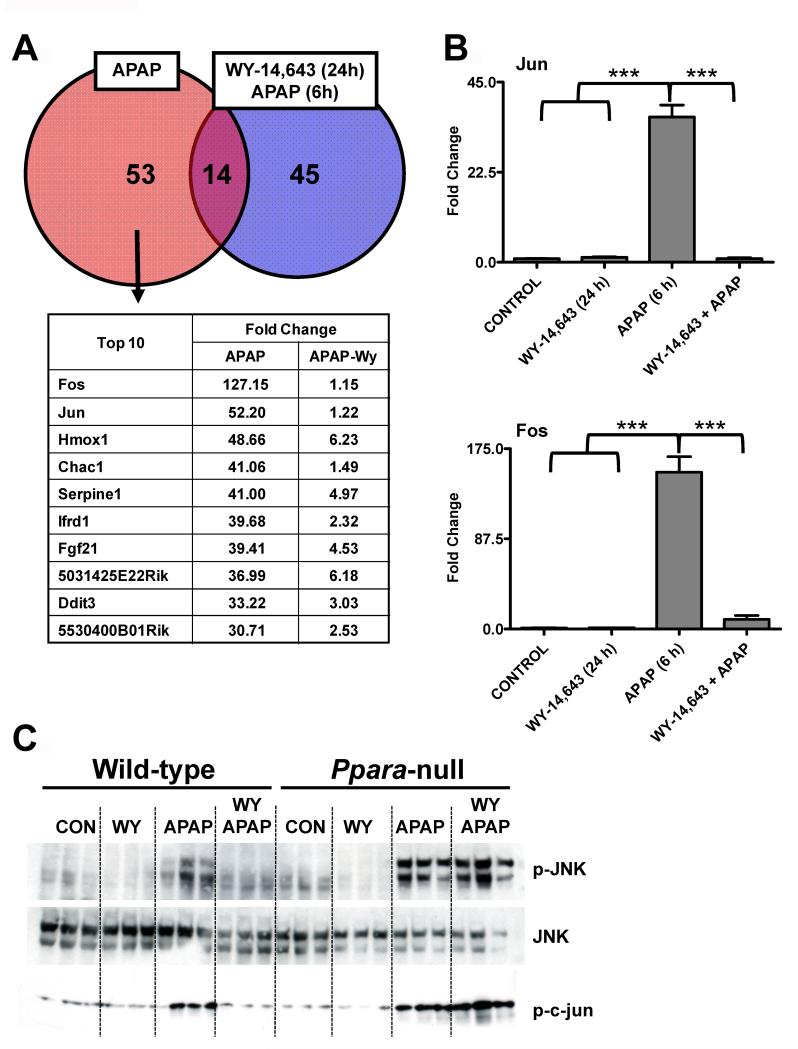
In order to understand the transcriptional responses associated with toxic doses of APAP-treatment and potential targets whereby PPARα was mediating its protective affects, microarray analysis was carried out on liver mRNA from 6h APAP-treated and Wy-14,643-pretreated/APAP-treated mice. A total of 53 genes were upregulated by APAP and 45 genes upregulated by Wy-14,643 /APAP; 14 genes were upregulated by both treatments (greater than 10-fold). Most interesting was the marked induction and suppression of c-fos and c-jun expression upon APAP treatment and Wy-14,643-pretreatment prior to APAP administration, respectively (Figure 3A). QPCR analysis confirmed that c-fos and c-jun mRNAs were robustly induced by APAP and suppressed by Wy-14,643-pretreatment prior to APAP (Figure 3B). Wy-14,643-pretreatment also blocked APAP-induced phosphorylation of JNK, an important signaling component of APAP-induced toxicity (20-22). Wild-type mice treated with APAP for 6h exhibited increased p-JNK that was not found with Wy-14,643-pretreatment, while Ppara-null mice have increased p-JNK following Wy-14,643-pretreatment (Figure 3C). To ensure that p-JNK was associated with increased activity, kinase assays were performed and increased p-JNK levels were indeed consistent with elevated p-c-jun levels (Figure 3C, bottom panel).
Figure 3.
Changes in gene expression profiles, c-jun and c-fos mRNA levels, and p-JNK associated with Wy-14,643 protection against APAP-induced liver toxicity. (A) Microarray analysis Venn diagram and table of top hits (APAP-specific induction) comparing APAP and Wy-14,643/APAP-treated wild-type mice. (B) Analysis of c-jun and c-fos mRNAs by qPCR in livers from control, Wy-14,643-treated, APAP-treated, and Wy-14,643/APAP-treated wild-type mice. (C) Levels of p-JNK, JNK, and p-c-jun proteins in livers from control, Wy-14,643-treated, APAP-treated, and Wy-14,643/APAP-treated wild-type mice. ***p<0.001.
Wy-14,643 Blocks APAP-induced Oxidative Stress
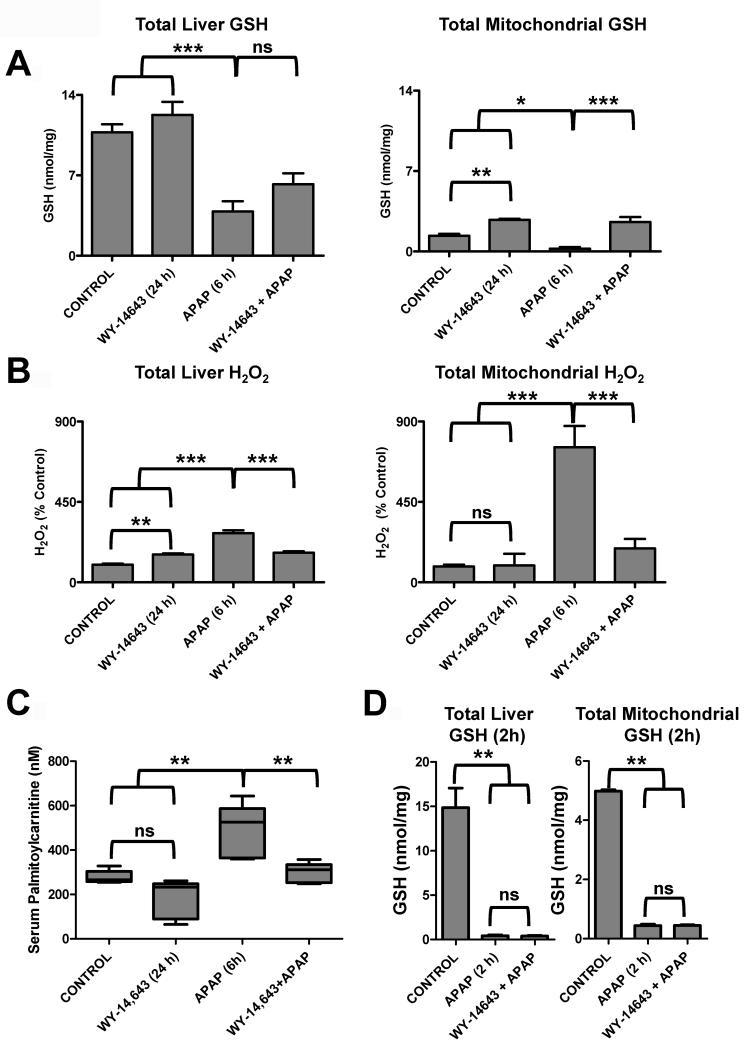
APAP treatment results in a decrease in hepatic levels of GSH at 2h and 6h, due in part to the production of the quinone NAPQI from APAP that is rapidly neutralized by GSH conjugation by glutathione S-transferase. This decrease was partially restored by Wy-14,643-pretreatment. However, the maintenance of GSH levels was even more pronounced in isolated mitochondria (Figure 4A). H2O2 levels are inversely correlated with GSH levels and reflect increase oxidative stress. Indeed, Wy-14,643-pretreatment decreased H2O2 levels elevated by APAP treatment, and this was most pronounced in isolated mitochondria (Figure 4B).
Figure 4.
Changes in oxidative stress markers and acycarnitines associated with Wy-14,643 protection against APAP-induced liver toxicity. (A) Levels of total and mitochondria GSH in livers from control, Wy-14,643-treated, APAP-treated, and Wy-14,643/APAP-treated wild-type mice. (B) Levels of total and mitochondrial H2O2 in livers from control, Wy-14,643-treated, APAP-treated, and Wy-14,643/APAP-treated wild-type mice. (C) Levels of serum palmitoylcarnitine from control, Wy-14,643-treated, APAP-treated, and Wy-14,643/APAP-treated wild-type mice. (D) Total (left panel) and mitochondrial (right panel) GSH levels were measured in livers from control, APAP-treated, and Wy-14,643/APAP-treated (2h after APAP treatment). *p<0.05, **p<0.01; ns, not significant.
APAP toxicity is also associated with increased levels of long-chain acylcarnitines in serum that are likely due to mitochondrial damage (15). Metabolomics comparison of serum revealed marked differences in serum metabolites between APAP-treated and Wy-14,643-pretreatment/APAP as indicated by the scores plot separation of the two groups (Supplemental Figure 4A). This difference was driven, among others, by differences in levels of palmitoylcarnitine that were elevated in APAP-treated mouse serum and normal in Wy-14,643-pretreatment/APAP (Supplemental Figure 4B). Pretreatment with Wy-14,643 prior to APAP administration blocks the increase in palmitoylcarnitines as indicated by direct quantification of palmitoylcarnitine (Figure 4C).
At 2h post-APAP treatment, both APAP and Wy-14,643/APAP treated mice, exhibited extensive GSH depletion in both the liver and mitochondria (Figure 4D).
Role of UCP2 in Wy-14-643 Protection Against APAP-induced Hepatotoxicity
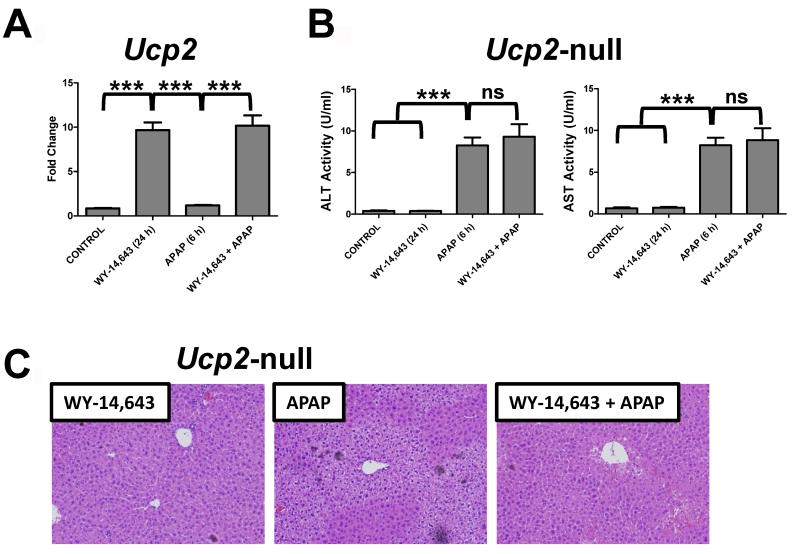
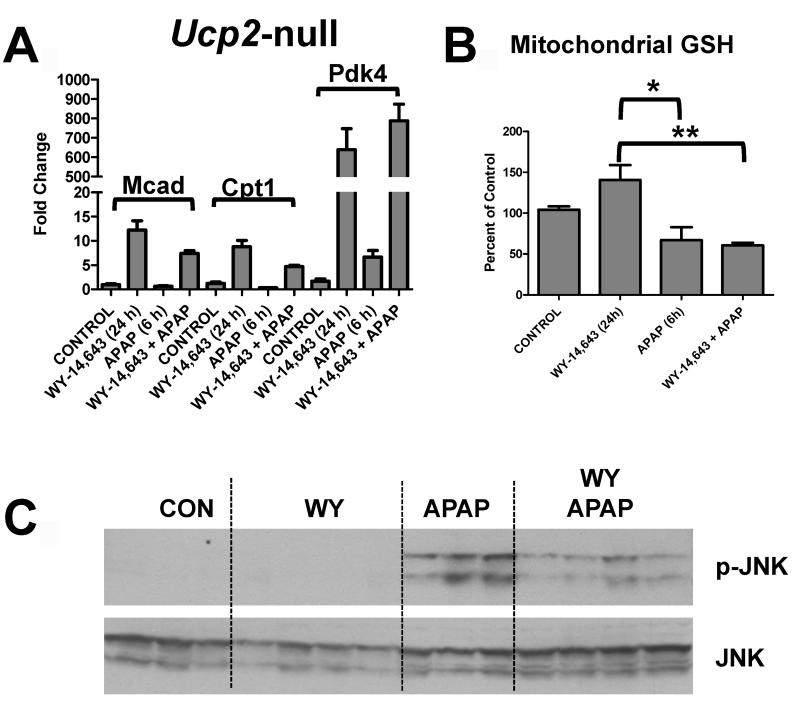
Since APAP toxicity results in elevated mitochondrial oxidative stress and mitochondrial damage, a role for UCP2 in Wy-14,643 protection against APAP-induced hepatic damage was investigated. UCPs are located in the mitochondrial inner membrane and are associated with decreased hepatic reactive oxygen species (23, 24). Wy-14,643 treatment induced UCP2 mRNA in the absence and presence of APAP (Figure 5A, left panel); similar induction was not observed in Ppara-null mice. Protein levels of UCP2 were also measured in mitochondrial extracts from control and mice treated with Wy-14,643 for 24h (Supplemental Figure 5). To determine whether UCP2 has a role in Wy-14,643 protection against APAP hepatotoxicity, Ucp2-null mice were subjected to Wy-14,643 and APAP treatment. Mice lacking expression of UCP2 were not protected against APAP-induced toxicity following Wy-14,643 as revealed by serum ALT and AST enzyme levels (Figure 5B) and liver histology (Figure 5C). The Ucp2-null mice were still responsive to Wy-14,643 as indicated by induction of the PPARα target genes Mcad, Cpt1 and Pdk4 (Figure 6A) indicating that the loss of the protective effects of Wy-14,643 in this model is due to the lack of UCP2 and not PPARα itself or other PPARα target genes. Wy-14,643 administration to Ucp2-null mice also did not restore mitochondrial GSH loss upon APAP treatment (Figure 6B) nor fully suppressed the increase in p-JNK (Figure 6C). These results suggest that the PPARα target gene UCP2 may be responsible for the protective effect of PPARα activators against APAP-induced toxicity.
Figure 5.
Role of UCP2 in Wy-14,643 protection against APAP-induced liver toxicity using Ucp2-null mice. (A) QPCR analysis of UCP2 mRNA in livers from control, Wy-14,643-treated, APAP-treated, and Wy-14,643/APAP treated wild-type mice. (B) Serum ALT and AST enzyme levels from control, Wy-14,643-treated, APAP-treated, and Wy-14,643/APAP-treated Ucp2-null mice. (C) H&E staining of livers from Wy-14,643-treated, APAP-treated, and Wy-14,643/APAP-treated Ucp2-null mice. **p<0.01, ***p<0.001; ns, not significant.
Figure 6.
Role of UCP2 in Wy-14,643 protection against APAP-induced liver toxicity using Ucp2-null mice. (A) QPCR analysis of MCAD, CPT1, and PDK4 mRNA in livers from control, Wy-14,643-treated, APAP-treated, and Wy-14,643/APAP-treated Ucp2-null mice. (B) Levels of mitochondrial GSH control, Wy-14,643-treated, APAP-treated, and Wy-14,643/APAP-treated Ucp2-null mice. (C) Levels of p-JNK, JNK, and p-c-jun proteins in livers from control, Wy-14,643-treated, APAP-treated, and Wy-14,643/APAP-treated Ucp2-null mice. *p<0.05, **p<0.01.
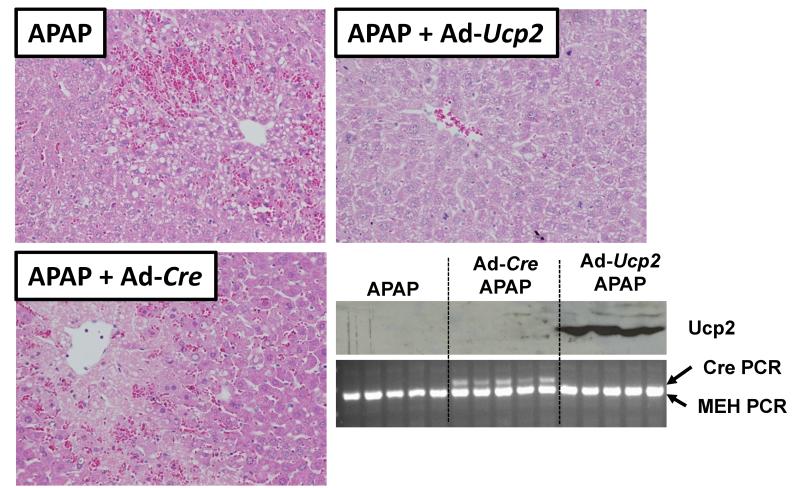
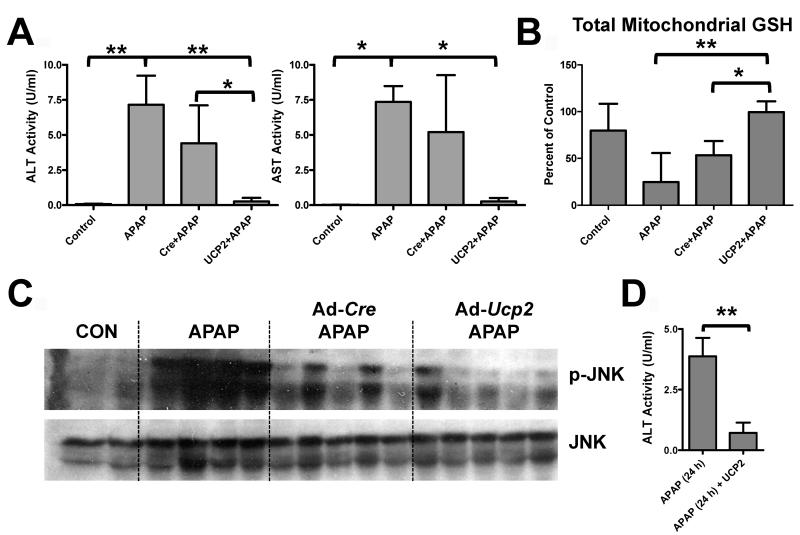
Ucp2-null mice could have subtle changes that render them resistant to the Wy-14,643 protection that are unrelated to UCP2. In order to further establish a role for UCP2 in Wy-14,643-induced protection against APAP hepatotoxicity, forced expression of the protein in livers of wild-type mice was carried out. Recombinant adenoviruses expressing UCP2 (Ad-Ucp2) were constructed and infused into the mouse livers prior to administration of APAP; UCP2 protein was robustly expressed in the livers of wild-type mice (Figure 7, bottom right panel). Mice receiving the Ad-Ucp2 were protected against APAP-induced liver toxicity as revealed by H&E staining showing protection against liver necrosis (Figure 7), lower serum AST and ALT enzyme activities (Figure 8A), increased mitochondrial GSH (Figure 8B), and lower p-JNK levels (Figure 8C). This protection by Ad-Ucp2 was evident at 24h post-APAP treatment as indicated by reduced levels of ALT enzyme (Figure 8D). No protection was found when the control adenovirus expressing Cre recombinase was used and adenovirus itself did not appear to influence CYP2E1 expression (Supplemental Figure 6). ALT activity values for Ad-Cre/APAP-treated mice ranged from 1.8 to 8.0 U/ml while values from Ad-Ucp2/APAP-treated mice ranged from 0.06 to 0.7 U/ml. Even the highest Ad-Ucp2/APAP ALT activity value was still 2.6 times lower than the lowest Ad-Cre/APAP value. These data suggest that UCP2 can protect against APAP-induced hepatotoxicity and that it is a critical target gene responsible for PPARα-mediated protection during APAP-induced hepatotoxicity.
Figure 7.
Role of UCP2 in Wy-14,643 protection against APAP-induced liver toxicity using forced expression of UCP2 in livers of wild-type mice. H&E staining of livers from wild-type mice administered Ad-Ucp2 and Ad-Cre prior to APAP treatment. Western blot of UCP2 protein in Ad-Ucp2 and Ad-Cre treated mice. Uptake of virus was monitored by PCR of Cre recombinase cDNA.
Figure 8.
Role of UCP2 in Wy-14,643 protection against APAP-induced liver toxicity using forced expression of UCP2 in livers of wild-type mice. (A) Effect of Ad-Ucp2 and Ad-Cre prior to APAP treatment on serum ALT and AST enzyme levels. (B) Effect of Ad-Ucp2 and Ad-Cre prior to APAP treatment on total mitochondrial GSH levels in livers of wild-type mice. (C) Effect of Ad-Ucp2 and Ad-Cre prior to APAP treatment on JNK and p-JNK protein levels in livers of wild-type mice. (D) ALT enzyme levels in APAP and Ad-Ucp2 treated mice after 24 h APAP treatment. *p<0.05, **p<0.01.
DISCUSSION
The present study demonstrates a novel, protective role for PPARα during APAP-induced hepatotoxicity and sheds mechanistic insight into the importance of UCP2 in mediating these protective effects. When the experimental agonist Wy-14,643 was administered prior to a toxic dose of APAP, wild-type mice were completely protected against hepatotoxicity as revealed by gross liver morphology, H&E-stained liver sections showing no significant liver damage, and low serum AST and ALT enzyme levels. In addition, livers from mice pretreated with Wy-14,643 prior to APAP had decreased oxidative stress, as revealed by lower H2O2 levels and higher GSH levels compared to livers from mice only treated with a toxic dose of APAP at 6h. Interestingly, Wy-14,643 treated mice exhibited a rapid reduction of GSH levels at 2h post-APAP treatment. In fact, these results are in strong agreement with a previous report demonstrating that mice lacking CYP2E1 were protected from APAP-induced hepatotoxicity due in part to activation of PPARα (15). Evidence for decreased oxidative stress was also revealed by reduced induction of c-jun and c-fos and lower p-JNK levels upon Wy-14,643 pretreatment. This effect was specific to APAP-induced hepatotoxicity and JNK pathway attenuation as Jo-2 treatment which stimulates the Fas death pathway was unaffected by pre-treatment with Wy-14,643. This observation is consistent with a previous report demonstrating that attenuating JNK signaling did not protect from Fas-mediated cell death (20). In general, it is the enhanced and persistent PPARα activation prior to APAP treatment that is important for mediating these effects. However, studies examining the role of PPARα activation post-APAP treatment should be conducted to determine if this pathway holds any promises for therapeutic intervention.
Previous studies revealed that acylcarnitines were elevated early after APAP treatment and that their elevation was indicative of mitochondrial damage and dysfunction (15, 19). In the present study, these observations were confirmed, as palmitoylcarnitine was elevated by toxic doses of APAP and maintained at normal levels (compared with untreated controls) by Wy-14,643 pretreatment. The enhanced toxicity in the Ppara-null mice revealed that the protective response to Wy-14,643 was PPARα-dependent. Protection of APAP toxicity by Wy-14,643 also extended to human PPARαas indicated by similar protection from APAP-induced hepatotoxicity in PPARα-humanized mice receiving the PPARα activator fenofibrate.
PPARα activates a large number of target genes primarily associated with fatty acid transport and catabolism. Thus it was important to determine which among these target genes afforded protection. Earlier studies revealed that among the earliest events associated with APAP toxicity was elevated oxidative stress as a result of oxidation of APAP to the quinone metabolite NAPQI by cytochomes P450, notably by CYP2E1 (11, 25) and dramatic reduction of cellular antioxidants such including GSH. This is likely followed by mitochondrial damage leading to cell death and these effects may be partially mediated by reduced PPARα activity in the presence of high doses of APAP (15, 19). The findings of decreased oxidative stress with Wy-14,643 suggest that a target gene that influences liver ROS and/or preserves mitochondrial fatty acid β-oxidation might be a PPARα-dependent candidate responsible for the protective effects from APAP-induced hepatotoxicity.
UCPs are a small family of transporters present in the inner mitochondria membrane that have been implicated in the protection against ROS generation in macrophage. Many studies have revealed that UCPs regulate mitochondrial ROS (26) and, as in the case of UCP2, can be activated by increased levels of fatty acids (27) such as arachidonate. Furthermore, UCP2 has been reported to be important for promoting fatty acid β-oxidation (28), which under conditions of APAP-induced inhibition of fatty acid catabolism, makes it a likely target for mediating these protective effects. UCP2 upregulation in liver is also found in pathologic conditions such as steatosis and obesity where increased or perturbed fatty acid oxidation is observed (27, 29). High UCP2 expression is also found in certain tumors where it is thought that the tumor cells utilize the GSH preserving qualities of UCP2 to promote growth and reduce ROS levels. UCP2 decreases ROS in liver through a mechanism that is not completely understood (23, 24), yet the recent report of its crystal structure is an important step in understanding the function of UCP2 (30). UCP2 may serve a protective role in mitochondria by reducing ROS levels directly, lowering mitochondrial membrane potential, transporting fatty acids and fatty acid peroxides, or a combination of the above. Most importantly, UCP2 is markedly induced by PPARα activation in liver, specifically hepatocytes (7) coincident with the induction of mitochondrial and peroxisomal enzymes involved in fatty acid β-oxidation. Based on these data, UCP2 was viewed as a potential candidate for a Wy-14,643-induced protein that could protect from APAP toxicity. Indeed, mice lacking expression of UCP2 were not protected against APAP toxicity by Wy-14,643. Whereas, forced overexpression of UCP2 in the liver of wild-type mice also protected against APAP-induced toxicity in the absence of Wy-14,643. It is noteworthy, however, that sustained expression of UCP2 may in fact be deleterious suggesting that UCP2 expression must be tightly controlled in order to maintain its salubrious qualities. Furthermore, other UCP family members, namely UCP3, may also contribute to the protection given the observed as suggested by reduced JNK phosphorylation in Ucp2-null mice treated with WY-14,643 (Figure 6C). Moreover, it is likely that the combined activities of PPARα targets facilitate maximal protection and their roles specifically at the level of maintaining mitochondrial function warrant further investigation.
The question arises whether UCP2 plays a role in protecting the liver against ROS under normal physiological conditions such as during mitochondrial fatty acid ß-oxidation. In general, Ucp2-null mouse livers have elevated ROS compared to wild-type mice (31). Thus, UCP2 could serve as a general protector of the liver and, in particular, of the mitochondria from oxidative stress produced by normal metabolism. Under conditions of fasting, PPARα is activated by endogenous ligands resulting in induction of peroxisome and mitochondrial fatty acid oxidation (32). Indeed, PPARα activation by starvation results in elevated mitochondrial ROS (33). This results in elevated ROS that is neutralized by the co-induced UCP2. In the case of chemically induced hepatotoxicity that results in massively elevated and lethal levels of ROS, the protective effect of UCPs are even more essential.
Another intriguing possibility was demonstrated in a recent study where the authors reported an intimate relationship between elevated ROS and UCPs (8). UCP2 (and UCP3) contain reactive cysteines that can be modified by GSH. The deglutathionylation/glutathionylation regulates UCP2 and UCP3 activity. In the presence of elevated ROS, GSH is depleted and the proteins lose the conjugated glutathione, thereby rendering them active and able to neutralized ROS. Under the conditions of APAP-induced hepatotoxicity, elevated ROS levels likely mediate similar activation of UCP2, however, only following activation by PPARα.
In conclusion, this study adds to our understanding of how toxic doses of APAP mediate hepatotoxicity and provides new insight into the importance of PPARα activation in maintaining proper mitochondrial function most likely through UCP2 under normal and pathologic conditions. Further, this study lends even greater support for how repression of PPARα activation can lead to deleterious effects. Using Ucp2-null mice and mice transiently expressing UCP2 (from adenovirus), a convincing role for UPC2 in protecting against APAP-induced hepatotoxicity through preservation of mitochondrial function was demonstrated. Further studies to determine the mechanisms by which UCP2 facilitates this protection is warranted and will provide greater understanding by which ROS elevating hepatoxicants, such as APAP, mediate their effects.
Supplementary Material
Acknowledgments
We thank Jared Correll and Jessica Montanez for technical assistance. We thank Dr. Chi Chen for insightful discussions.
REFERENCES
- 1.Peters JM, Cattley RC, Gonzalez FJ. Role of PPAR alpha in the mechanism of action of the nongenotoxic carcinogen and peroxisome proliferator Wy-14,643. Carcinogenesis. 1997;18:2029–2033. doi: 10.1093/carcin/18.11.2029. [DOI] [PubMed] [Google Scholar]
- 2.Shah YM, Morimura K, Yang Q, Tanabe T, Takagi M, Gonzalez FJ. Peroxisome proliferator-activated receptor alpha regulates a microRNA-mediated signaling cascade responsible for hepatocellular proliferation. Mol Cell Biol. 2007;27:4238–4247. doi: 10.1128/MCB.00317-07. [DOI] [PMC free article] [PubMed] [Google Scholar]
- 3.Gonzalez FJ, Shah YM. PPARalpha: mechanism of species differences and hepatocarcinogenesis of peroxisome proliferators. Toxicology. 2008;246:2–8. doi: 10.1016/j.tox.2007.09.030. [DOI] [PubMed] [Google Scholar]
- 4.Aoyama T, Peters JM, Iritani N, Nakajima T, Furihata K, Hashimoto T, Gonzalez FJ. Altered constitutive expression of fatty acid-metabolizing enzymes in mice lacking the peroxisome proliferator-activated receptor alpha (PPARalpha) J Biol Chem. 1998;273:5678–5684. doi: 10.1074/jbc.273.10.5678. [DOI] [PubMed] [Google Scholar]
- 5.Kersten S, Seydoux J, Peters JM, Gonzalez FJ, Desvergne B, Wahli W. Peroxisome proliferator-activated receptor alpha mediates the adaptive response to fasting. J Clin Invest. 1999;103:1489–1498. doi: 10.1172/JCI6223. [DOI] [PMC free article] [PubMed] [Google Scholar]
- 6.Mandard S, Muller M, Kersten S. Peroxisome proliferator-activated receptor alpha target genes. Cell Mol Life Sci. 2004;61:393–416. doi: 10.1007/s00018-003-3216-3. [DOI] [PMC free article] [PubMed] [Google Scholar]
- 7.Nakatani T, Tsuboyama-Kasaoka N, Takahashi M, Miura S, Ezaki O. Mechanism for peroxisome proliferator-activated receptor-alpha activator-induced up-regulation of UCP2 mRNA in rodent hepatocytes. Journal of Biological Chemistry. 2002;277:9562–9569. doi: 10.1074/jbc.M110132200. [DOI] [PubMed] [Google Scholar]
- 8.Mailloux RJ, Seifert EL, Bouillaud F, Aguer C, Collins S, Harper ME. Glutathionylation Acts as a Control Switch for Uncoupling Proteins UCP2 and UCP3. Journal of Biological Chemistry. 2011;286:21865–21875. doi: 10.1074/jbc.M111.240242. [DOI] [PMC free article] [PubMed] [Google Scholar]
- 9.D’Arcy PF. Paracetamol. Adverse Drug React Toxicol Rev. 1997;16:9–14. [PubMed] [Google Scholar]
- 10.Mazer M, Perrone J. Acetaminophen-induced nephrotoxicity: pathophysiology, clinical manifestations, and management. J Med Toxicol. 2008;4:2–6. doi: 10.1007/BF03160941. [DOI] [PMC free article] [PubMed] [Google Scholar]
- 11.Gonzalez FJ. The 2006 Bernard B. Brodie Award Lecture. Cyp2e1. Drug Metab Dispos. 2007;35:1–8. doi: 10.1124/dmd.106.012492. [DOI] [PubMed] [Google Scholar]
- 12.Manautou JE, Hoivik DJ, Tveit A, Hart SG, Khairallah EA, Cohen SD. Clofibrate pretreatment diminishes acetaminophen’s selective covalent binding and hepatotoxicity. Toxicol Appl Pharmacol. 1994;129:252–263. doi: 10.1006/taap.1994.1250. [DOI] [PubMed] [Google Scholar]
- 13.Manautou JE, Tveit A, Hoivik DJ, Khairallah EA, Cohen SD. Protection by clofibrate against acetaminophen hepatotoxicity in male CD-1 mice is associated with an early increase in biliary concentration of acetaminophen-glutathione adducts. Toxicol Appl Pharmacol. 1996;140:30–38. doi: 10.1006/taap.1996.0194. [DOI] [PubMed] [Google Scholar]
- 14.Chen C, Hennig GE, Whiteley HE, Corton JC, Manautou JE. Peroxisome proliferator-activated receptor alpha-null mice lack resistance to acetaminophen hepatotoxicity following clofibrate exposure. Toxicol Sci. 2000;57:338–344. doi: 10.1093/toxsci/57.2.338. [DOI] [PubMed] [Google Scholar]
- 15.Chen C, Krausz KW, Shah YM, Idle JR, Gonzalez FJ. Serum metabolomics reveals irreversible inhibition of fatty acid beta-oxidation through the suppression of PPARalpha activation as a contributing mechanism of acetaminophen-induced hepatotoxicity. Chem Res Toxicol. 2009;22:699–707. doi: 10.1021/tx800464q. [DOI] [PMC free article] [PubMed] [Google Scholar]
- 16.Lee SS, Pineau T, Drago J, Lee EJ, Owens JW, Kroetz DL, Fernandez-Salguero PM, et al. Targeted disruption of the alpha isoform of the peroxisome proliferator-activated receptor gene in mice results in abolishment of the pleiotropic effects of peroxisome proliferators. Mol Cell Biol. 1995;15:3012–3022. doi: 10.1128/mcb.15.6.3012. [DOI] [PMC free article] [PubMed] [Google Scholar]
- 17.Yang Q, Nagano T, Shah Y, Cheung C, Ito S, Gonzalez FJ. The PPAR alpha-humanized mouse: a model to investigate species differences in liver toxicity mediated by PPAR alpha. Toxicol Sci. 2008;101:132–139. doi: 10.1093/toxsci/kfm206. [DOI] [PMC free article] [PubMed] [Google Scholar]
- 18.Hong Y, Fink BD, Dillon JS, Sivitz WI. Effects of adenoviral overexpression of uncoupling protein-2 and -3 on mitochondrial respiration in insulinoma cells. Endocrinology. 2001;142:249–256. doi: 10.1210/endo.142.1.7889. [DOI] [PubMed] [Google Scholar]
- 19.Chen C, Krausz KW, Idle JR, Gonzalez FJ. Identification of novel toxicity-associated metabolites by metabolomics and mass isotopomer analysis of acetaminophen metabolism in wild-type and Cyp2e1-null mice. Journal of Biological Chemistry. 2008;283:4543–4559. doi: 10.1074/jbc.M706299200. [DOI] [PMC free article] [PubMed] [Google Scholar]
- 20.Henderson NC, Pollock KJ, Frew J, Mackinnon AC, Flavell RA, Davis RJ, Sethi T, et al. Critical role of c-jun (NH2) terminal kinase in paracetamol-induced acute liver failure. Gut. 2007;56:982–990. doi: 10.1136/gut.2006.104372. [DOI] [PMC free article] [PubMed] [Google Scholar]
- 21.Hanawa N, Shinohara M, Saberi B, Gaarde WA, Han D, Kaplowitz N. Role of JNK translocation to mitochondria leading to inhibition of mitochondria bioenergetics in acetaminophen-induced liver injury. J Biol Chem. 2008;283:13565–13577. doi: 10.1074/jbc.M708916200. [DOI] [PMC free article] [PubMed] [Google Scholar]
- 22.Win S, Than TA, Han D, Petrovic LM, Kaplowitz N. c-Jun N-terminal kinase (JNK)-dependent acute liver injury from acetaminophen or tumor necrosis factor (TNF) requires mitochondrial Sab protein expression in mice. J Biol Chem. 2011;286:35071–35078. doi: 10.1074/jbc.M111.276089. [DOI] [PMC free article] [PubMed] [Google Scholar]
- 23.Nedergaard J, Cannon B. The ‘novel’ ‘uncoupling’ proteins UCP2 and UCP3: what do they really do? Pros and cons for suggested functions. Exp Physiol. 2003;88:65–84. doi: 10.1113/eph8802502. [DOI] [PubMed] [Google Scholar]
- 24.Brand MD, Esteves TC. Physiological functions of the mitochondrial uncoupling proteins UCP2 and UCP3. Cell Metab. 2005;2:85–93. doi: 10.1016/j.cmet.2005.06.002. [DOI] [PubMed] [Google Scholar]
- 25.Zaher H, Buters JTM, Ward JM, Bruno MK, Lucas AM, Stern ST, Cohen SD, et al. Protection against acetaminophen toxicity in CYP1A2 and CYP2E1 double-null mice. Toxicology and Applied Pharmacology. 1998;152:193–199. doi: 10.1006/taap.1998.8501. [DOI] [PubMed] [Google Scholar]
- 26.Sluse FE, Jarmuszkiewicz W, Navet R, Douette P, Mathy G, Sluse-Goffart CM. Mitochondrial UCPs: New insights into regulation and impact. Biochimica Et Biophysica Acta-Bioenergetics. 2006;1757:480–485. doi: 10.1016/j.bbabio.2006.02.004. [DOI] [PubMed] [Google Scholar]
- 27.Yonezawa T, Kurata R, Hosomichi K, Kono A, Kimura M, Inoko H. Nutritional and hormonal regulation of uncoupling protein 2. IUBMB Life. 2009;61:1123–1131. doi: 10.1002/iub.264. [DOI] [PubMed] [Google Scholar]
- 28.Pecqueur C, Bui T, Gelly C, Hauchard J, Barbot C, Bouillaud F, Ricquier D, et al. Uncoupling protein-2 controls proliferation by promoting fatty acid oxidation and limiting glycolysis-derived pyruvate utilization. FASEB J. 2008;22:9–18. doi: 10.1096/fj.07-8945com. [DOI] [PubMed] [Google Scholar]
- 29.Sluse FE, Jarmuszkiewicz W, Navet R, Douette P, Mathy G, Sluse-Goffart CM. Mitochondrial UCPs: new insights into regulation and impact. Biochim Biophys Acta. 2006;1757:480–485. doi: 10.1016/j.bbabio.2006.02.004. [DOI] [PubMed] [Google Scholar]
- 30.Berardi MJ, Shih WM, Harrison SC, Chou JJ. Mitochondrial uncoupling protein 2 structure determined by NMR molecular fragment searching. Nature. 2011;476:109–113. doi: 10.1038/nature10257. [DOI] [PMC free article] [PubMed] [Google Scholar]
- 31.Kuhla A, Hettwer C, Menger MD, Vollmar B. Oxidative stress-associated rise of hepatic protein glycation increases inflammatory liver injury in uncoupling protein-2 deficient mice. Laboratory Investigation. 2010;90:1189–1198. doi: 10.1038/labinvest.2010.84. [DOI] [PubMed] [Google Scholar]
- 32.Kersten S, Seydoux J, Peters JM, Gonzalez FJ, Desvergne B, Wrahli W. Peroxisome proliferator-activated receptor alpha mediates the adaptive response to fasting. Journal of Clinical Investigation. 1999;103:1489–1498. doi: 10.1172/JCI6223. [DOI] [PMC free article] [PubMed] [Google Scholar]
- 33.Abdelmegeed MA, Moon KH, Hardwick JP, Gonzalez FJ, Song BJ. Role of peroxisome proliferator-activated receptor-alpha in fasting-mediated oxidative stress. Free Radic Biol Med. 2009;47:767–778. doi: 10.1016/j.freeradbiomed.2009.06.017. [DOI] [PMC free article] [PubMed] [Google Scholar]
Associated Data
This section collects any data citations, data availability statements, or supplementary materials included in this article.


