


Abstract
DNA looping mediated by the Lac repressor is an archetypal test case for modeling protein and DNA flexibility. Understanding looping is fundamental to quantitative descriptions of gene expression. Systematic analysis of LacI•DNA looping was carried out using a landscape of DNA constructs with lac operators bracketing an A-tract bend, produced by varying helical phasings between operators and the bend. Fluorophores positioned on either side of both operators allowed direct Förster resonance energy transfer (FRET) detection of parallel (P1) and antiparallel (A1, A2) DNA looping topologies anchored by V-shaped LacI. Combining fluorophore position variant landscapes allows calculation of the P1, A1 and A2 populations from FRET efficiencies and also reveals extended low-FRET loops proposed to form via LacI opening. The addition of isopropyl-β-d-thio-galactoside (IPTG) destabilizes but does not eliminate the loops, and IPTG does not redistribute loops among high-FRET topologies. In some cases, subsequent addition of excess LacI does not reduce FRET further, suggesting that IPTG stabilizes extended or other low-FRET loops. The data align well with rod mechanics models for the energetics of DNA looping topologies. At the peaks of the predicted energy landscape for V-shaped loops, the proposed extended loops are more stable and are observed instead, showing that future models must consider protein flexibility.
INTRODUCTION
DNA looping is a means of communication at a distance between DNA sites used in transcription, replication and repair. In particular, looping enhances transcriptional repression by the archetypal Lac repressor protein, LacI, via increasing the local concentration of LacI at the primary operator O1 through anchoring LacI at secondary operators O2 and O3 (1). The landmark crystal structures of LacI and its co-complexes with two DNA operators show a V-shaped protein with the DNA fragments close together, and they provide structural constraints on the looping of intervening DNA. The LacI homotetramer is a dimer of dimers, with each dimer binding one operator site through N-terminal headpieces, binding one or two inducers in a central core domain, and binding the other dimer through a shared C-terminal four-helix bundle (2–4). Connections between the core domain and the tetramerization domain of LacI, at the vertex of the V, are made by short peptide linkers that lack secondary structure and have varied conformations. This arrangement has been hypothesized to permit opening of the dimer–dimer interface into an extended linear form, while maintaining the tetrameric oligomeric state (3,5,6). The interface between the DNA binding headpiece and the core domain, called the hinge helix, has also been proposed to be flexible (7), and the headpiece itself has an inherent plasticity that allows stable non-specific binding to non-operator DNA (8,9). The nonspecific interactions may accelerate loop formation by allowing intersegment transfer, one-dimensional diffusion or hopping along DNA (10–12).
Induction of the lac operon by binding of ligands such as allolactose and IPTG decreases LacI binding affinity for operator DNA by 1000-fold relative to free protein (13,14). The decreased affinity is mediated by an allosteric conformational change suggested to be the withdrawal of the hinge helix from the DNA (2,15). However, even in the presence of saturating IPTG, significant repression of the promoter can be observed in vivo, and the efficiency of repression shows the classic signal of looping: it is a periodic function of the interoperator spacing (16–18). Quantitative models for regulation, which depend on the occupancy at O1, should include all possible LacI•DNA loops in the presence and absence of IPTG as well as non-specific DNA binding by LacI. Such models require detailed knowledge of the possible loop structures and their energetics.
DNA loops anchored by a V-shaped protein can adopt different loop topologies referred to as parallel (P) and antiparallel (A) according to the relative directions of the upstream and downstream operator DNA bound to the protein (19). Furthermore, the parallel and antiparallel DNA trajectories can be subdivided into P1, P2, A1 and A2 (Figure 1) according to whether the upstream operator is directed toward or away from the downstream dimer-DNA unit (20). In addition, if the V-shaped LacI can open up to a more linear form, then an extended (E) loop must be considered.
Figure 1.

Design of a LacI•DNA looping landscape and fluorophore position variants (FPVs). (A) Looping constructs are derived from the previously reported operator-bend-operator construct 9C14 (23). The two helical phasing adaptors were altered by 0, ± 2 or ± 4 bp, rotating both operators to give the 5 × 5 matrix of constructs (5,7,9,11,13)C(10,12,14,16,18), e.g. 5C10. The first number indexes the bend-operator separation on the donor side and the second indexes the acceptor side. Double-labeled molecules were prepared by PCR with primers that were labeled with fluorophores either at the previously used internal (I) or else the external (E) positions. The four FPVs have different combinations of donor (blue) and acceptor (red) positions, for example DEAI. The constructs were modeled using the junction model for A-tract DNA (34,35) and the LacI•DNA co-crystal structure (4). The donor sides of the DNA constructs are superimposed. LacI is shown bound in one of two possible orientations relative to the operator, with a putative extended LacI as a ghost image. For clarity, the DNA bending at the acceptor-side operator is not shown. (B) The operator DNA in the V-shaped LacI•DNA co-crystal structure was extended with ideal B-DNA to show the four fluorophore attachment points, each two base pairs outside of each operator. The distances shown are calculated between the C5 carbons of the T residues to which the fluorophores are attached. (C) The FPVs can be mapped onto loop topologies anticipated for this DNA sequence space. Assuming that the LacI V-shape does not change, FRET for each FPV should be maximal for one of the four loop topologies: the P1 loop should give maximal FRET with the DIAI FPV, P2 with DEAE, A1 with DIAE and A2 with DEAI. FRET should be decreased or absent in extended (E) complexes.
The LacI•DNA loop free energy includes contributions from specific LacI-operator binding, anticooperativity between headpiece–DNA-binding interactions (21), DNA elastic energy in the loop and the entropic cost of bringing distant operators close together. Protein deformation will also modulate the shape and the energetics as long as the protein is not infinitely stiff. Sequence-directed bending or anisotropic flexibility in the intervening DNA can potentiate or prevent looping (22–24). The physical chemistry of looping, and especially the connection between in vitro properties of DNA and in vivo loop stability, is not completely understood. In vivo loops are often observed to be surprisingly stable (25), and while this has been rationalized by recent controversial suggestions that DNA is substantially more flexible than had previously been thought (26,27), protein flexibility and multivalency must also be considered. To disentangle these influences, we have previously created LacI•DNA looping constructs comprising symmetrical operators (Osym) bracketing a sequence-directed phased A-tract bend (23,24,28). The DNA bending stabilizes loops by dramatically decreasing the free energy cost for bringing the operators together, but the stabilization depends on the spatial orientation of the operator and the bend. Footprinting, electrophoretic mobility shift assays (EMSAs), DNA ring closure and bulk and single-molecule Förster resonance energy transfer (FRET) showed that two constructs with different helical phasings of the operators relative to the bend, denoted 9C14 and 11C12, yield hyperstable loops with different LacI•DNA loop geometries. These geometries were initially proposed to be a V-shaped (closed form, P1) loop and an extended (open form, E) loop, respectively. Subsequent rod mechanics modeling suggested that the experimental observations can also be explained by a rigid V-shaped protein coupled with all of the possible DNA loop topologies as well as twist variations within the loop (29). The calculations have been extended to a complete landscape of possible phasing isomers (30), and they have generated predictions for loop energies, topologies and geometries that can be compared to experiment.
We have generalized our previous experimental work on bent DNA constructs that support stable looping by synthesizing a comprehensive set of molecules with systematic variations in the helical phasing between operators and the central DNA bend (23,31). As in previous work, we have characterized loop stability and geometry over the landscape of molecules using FRET between fluorophores linked to the DNA (24,28). Because of the limited range over which FRET efficiency is sensitive to distance, we have also generalized our previous work to include four different sets of fluorophore position variants (FPVs), so that all of the different closed form DNA loop topologies are expected to provide measurable FRET for at least one FPV. Finally, recognizing that repression by IPTG•LacI•DNA is important to the biology of the operon, we have studied loop geometries in the presence and absence of saturating concentrations of IPTG.
MATERIALS AND METHODS
Materials
Phusion DNA polymerase and the BstN I restriction enzyme were purchased from New England Biolabs. Primers were from IDT. Alexa dyes (with succinimydyl ester linkages) were from Invitrogen. QuikChange mutagenesis kits were from Stratagene (now Agilent). LacI protein was expressed and purified according to published procedures (32,33), with modifications adapted from unpublished work by L. Edelman, as described in the Supplementary Data.
The LacI buffer used for all experiments is 25 mM Tris, pH 7.8, 5 mM MgCl2, 100 mM KCl, 2 mM DTT, 50 µg/ml acetylated BSA (New England Biolabs) and 0.02% IGEPAL CA-630 detergent (Sigma-Aldrich, replaces NP-40).
Synthesis of a DNA sequence landscape with FPVs
DNA sequence landscape clones were derived from the previously described hyperstable looping construct pRM9C14 (23). Site-directed mutagenesis using QuikChange and four different primer pairs on each side (Table 1) introduced helical rotation (relative to 9C14) of 0, ± 2 and ± 4 bp for each of the two operators relative to the central bend. The models of DNA constructs shown in Figure 1 use the junction model for DNA bending (34,35). DNA models were docked with the LacI•DNA co-crystal structure 1LBG (4) in Pymol using pair_fit. All DNA sequences are provided in Supplementary Data (Supplementary Figure S3 and Supplementary Table S1).
Table 1.
QuikChange primers used to generate the sequence landscape
| Sequence change | Forward primers (reverse primers are the complements) |
|---|---|
| Donor side change | |
| 9Cx → 13Cx | 5′ AGATCTCAGATCTCGTCGACGGATCCGG 3′ |
| 9Cx → 11Cx | 5′ AGATCTCAGATCTCGT--ACGGATCCGG 3′ |
| 9Cx (original) | (5′ AGATCTCA-AT-TCGT--ACGGATCCGG 3′) |
| 9Cx → 7Cx | 5′ AGATCTC----TTCGT--ACGGATCCGG 3′ |
| 9Cx → 5Cx | 5′ AGATCT------TCGT--ACGGATCCGG 3′ |
| Acceptor side change | |
| yC14 → yC18 | 5′ GCGCTGAACGCGTCCTAGACGCTATCGAAGC 3′ |
| yC14 → yC16 | 5′ GCGCTGAACGCGTCCTAGACG--ATCGAAGC 3′ |
| yC14 (original) | (5′ GCGCTGAACGCGTCCTAGA----ATCGAAGC 3′) |
| yC14 → yC12 | 5′ GCGCTGAACGCGTCCTA------ATCGAAGCTAGC 3′ |
| yC14 → yC10 | 5′ GCGCTGAACGCGTCC--------ATCGAAGCTAGC 3′ |
One round of mutagenesis starting from pRM9C14 (ref. 23) provided constructs 9C(10,12,16,18) using acceptor side primers and (5,7,11,13)C14 using donor side primers; a second round using the other set of primer pairs provided the rest of the landscape.
Nucleotides added to 9C14 are in bold and underlined.
Dashes indicate deletions with respect to the longest phasing adapters (in 13C18).
A detailed diagram of the DNA constructs and all 25 DNA sequences are available in the Supplementary Data as Supplementary Figure S3 and Supplementary Table S1, respectively.
Plasmids were maintained in XL1-Blue cells (Stratagene/Agilent). Polymerase chain reaction (PCR) templates were prepared by digesting miniprep DNA with BstN I followed by purification of the ∼420 bp fragment on a 7.5% native polyacrylamide gel (40:1 acrylamide: bis-acrylamide). The desired fragment was excised, eluted by crush and soak (50 mM NaOAc pH 7.0, 1 mM EDTA), phenol–chloroform extracted, ethanol precipitated and resuspended in TE buffer (10 mM Tris, 1 mM EDTA, pH 7.0).
The PCR primers shown below were labeled with Alexa555 (DInternal and DExternal primers) or Alexa647 (AInternal and AExternal primers). The locations of amino-modified thymines 2 bp outside of the Osym operator (in capital letters) are underlined and capitalized. Dye labeling was done following the manufacturer's recommendations, except the reaction time was 3 h. Unreacted dye was removed using a P6 column (Bio-Rad) and primers were purified on a 12% acrylamide 8 M urea denaturing gel and worked up as above:
DInternal : 5′ ccgatatctgcaggtcagtctaggtAATTGTGAGCGCTCACAATTaTatct 3′
DExternal : 5′ ccgatatctgcaggtcagtctagTtAATTGTGAGCGC 3′
AInternal : 5′ ttgatatcaaagctttaccacaacgAATTGTGAGCGCTCACAATTaTctagcttcg 3′
AExternal : 5′ ttgatatcaaagctttaccacaaTgAATTGTGAGCGC 3′
PCR amplification to give the four different FPVs used Phusion polymerase. For the DIAI, DEAI and DEAE landscapes, PCR mixtures (50 µl) contained 40 pg of BstN I digested DNA template, 0.5 µM each primer, 250 µM each dNTP, 4% DMSO and 2 U Phusion polymerase, in HF buffer. For the DIAE landscape, Buffer J (from Epicentre) was used without the addition of 4% DMSO. After an initial 2-min incubation at 95°C, 30 cycles of 95°C for 15 s, 58°C for 15 s, 62°C for 15 s, 66°C for 15 s, 68°C for 15 s and 72°C for 30 s were performed, followed by a final extension at 72°C for 5 min. PCR products were purified on a 7.5% gel, eluted by crush and soak and purified using Qiaquick PCR purification kits (Qiagen). DNA concentration was determined by UV absorbance.
FRET experiments with the LacI•DNA looping landscape and spectral decompositions
All FRET experiments were performed on a Varian Cary Eclipse fluorescence spectrophotometer. Excitation of the donor (Alexa 555) was at 514 nm, and the emission spectrum was scanned from 550 to 750 nm, with a 10-nm slit width. Direct excitation of the acceptor (Alexa 647) was at 600 nm, and emission was scanned from 640 to 750 nm.
All experiments were done in LacI buffer. For each FPV landscape, initially donor and acceptor emission spectra were collected for 2 nM DNA-only samples. DNA was then mixed with LacI for 1 min before measuring emission spectra. Then IPTG was added to 5 mM and allowed to incubate for another minute before rescanning. The order of addition of IPTG and LacI had no effect on the measured FRET efficiency after 1 min, suggesting equilibrium was reached. After IPTG addition, all mixtures were supplemented with an additional 3 nM LacI and were rescanned after another minute of incubation.
All experimental spectra were buffer corrected and then resolved into donor and acceptor emission contributions, using refinements of our previous method (28). The reference donor and acceptor emission spectra for each FPV were the average emission spectra obtained for all constructs with the corresponding fluorophores. (For example, the common reference donor emission spectrum used for the DIAE landscape was the average of the 25 spectra obtained at 514 nm excitation for all of the DIAE constructs.) The Matlab backslash operator was used to decompose the experimental spectra into linear combinations of reference spectra, giving coefficients Cdonor and Cacceptor representing the donor and acceptor contributions. FRET efficiency was then calculated for donor quenching and enhanced acceptor emission according to the equations below:
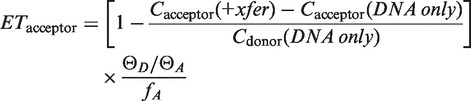 |
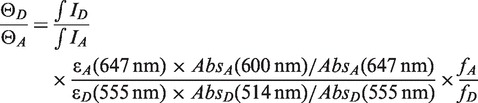
Here Cdonor and Cacceptor are the donor and acceptor contributions, and +xfer refers to (+LacI), (+LacI +IPTG) or (+LacI +IPTG +excess LacI) conditions. The actual ratio of quantum yields  was estimated according to the equation below, from the integrated intensities ID and IA of the emission spectra for each dye excited directly, the observed absorbances at the excitation wavelengths and the absorption maxima, the manufacturer's extinction coefficients at the absorption maxima and the labeling efficiencies fA and fD:
 |
The labeling efficiencies fA and fD were measured to be ∼100% for DI and AE, 70 % for DE, and 75 % for AI (see Supplementary Data for details). The estimated  was about 1 versus 1/3 expected from the manufacturer's quantum yields. The difference may reflect the environment of the dyes near the DNA. The average
  values were 0.86, 1.20, 1.22 and 1.62 for the DIAI, DIAE,DEAI and DEAE landscapes, respectively, versus fA/fD values of 0.75, 1.00, 0.93 and 1.43, respectively: the observed integrated areas of donor and acceptor emission are similar, so the apparent variation in
  is probably due to errors in the labeling efficiencies. This uncertainty in the labeling efficiencies of the final PCR products means that the true FRET efficiency in each landscape could be rescaled by up to about 20%, but it does not affect the relative efficiency in each landscape.
Quenching of donor fluorescence upon addition of LacI is qualitatively apparent in the spectra of Figure 2, but the spectra also show that donor quenching does not correlate quantitatively with acceptor enhancement. Control experiments (Supplementary Figure S1) on donor-only 9C14 showed that LacI and LacI + IPTG can either enhance or quench donor quantum yield, but these donor responses to environmental changes caused by LacI are not uniform across the landscape. Thus, accurate measurements of ETdonor would require two complete landscapes of singly labeled controls, for DI and DE. In contrast, direct excitation of acceptor at 600 nm should be unaffected by energy transfer. It was measured for every sample under each experimental condition, and relatively uniform acceptor quenching (11 ± 4 %) in the presence of LacI was observed throughout, allowing uniform scaling of Cacceptor relative to the DNA-only coefficient. The landscape results below are all based on the energy transfer efficiencies calculated from acceptor enhancement. The complete set of results for ETacceptor and the uncorrected ETdonor, as well as the loop topology distributions described below, are available in Excel format as Supplementary Data.
Figure 2.

Different FPV/construct combinations identify the three FRET-observable loop topologies (P1, A1 and A2). Emission spectra for the constructs exhibiting the highest energy transfer for each FPV landscape are shown for 2 nM DNA alone (black), DNA + 3 nM LacI (red), DNA + LacI + 5 mM IPTG (green) and DNA + LacI + IPTG + 3 nM additional LacI added after IPTG (blue). Enhanced donor quenching and acceptor emission are qualitatively obvious in the spectra. The spectra (dots) were decomposed into a linear combination of donor and acceptor emission components (fits are shown as correspondingly colored lines). Using the emission components, FRET efficiency was calculated separately for both donor quenching and enhanced acceptor emission. The donor quantum yield changed in response to the loop environment and could not be directly measured for each construct. Changes in acceptor emission could be directly measured, so all results described here are for enhanced acceptor emission.
EMSA experiments on P1, A1 and E loops with and without IPTG
EMSA experiments were performed ± IPTG on the 9C16, 5C18 and 13C10 constructs, which adopt P1, A2 and E loop shapes, respectively. Fluorescent DNA (2 nM) was incubated at 22°C with LacI for 15 min in LacI buffer. If IPTG was used, it was added with the DNA. If competitor plasmid DNA (containing the 13C10 sequence) was added after the initial incubation, the samples were allowed to incubate for a further 15 min before analysis of all of the samples on native polyacrylamide gels. In some experiments, competitor DNA was included before the addition of LacI to determine the final equilibrium state between competitor DNA and labeled DNA. Samples were electrophoresed on native 6 % polyacrylamide gels (75:1 acrylamide:N,N′-methylene bis-acrylamide, 50 mM Tris-borate, 1 mM EDTA, 1.5 mm thick by 20 cm long, run at 20 V/cm at 16°C for 2–2.5 h). The gel for the +IPTG samples contained 5 mM IPTG. Gels were imaged on a Typhoon Trio (Amersham, GE Healthcare) by exciting the donor at 532 nm, with the emission filter at 580 nm, 200 µm spot size and sensitivity of 700 V (36).
Calculation of loop population distributions
The loop population distributions were derived from the energy transfer (ET) values for each construct using assumptions (1)–(4) as follows, which were based on observed trends in the data. (1) Each uniform loop type (l = P1, A1, A2 or E) is assumed to have a uniform FRET efficiency (ETl) within each FPV landscape; for example, all P1 loops have the same ET in the DIAI landscape. (2) Based on the observation that the peak ET in each FPV landscape corresponds to minima that are near zero in the other two landscapes, we initially assume that the peak is a uniform population of the dominant loop topology and that the ET for that loop is simply the maximum observed ET; for example, ET for A1 loops is taken to be 24% based on the maximum ET observed in the DIAE landscape. (3) We ignore FRET ‘crosstalk’ between FPV landscapes that in principle could result from weak energy transfer across the 75–85 Å separation shown in Figure 1. We see no energy transfer in the DEAE landscape, showing that at least for A1 and A2 loops crosstalk is not observed. Ignoring crosstalk between landscapes corresponds to setting ET = 0 for all loops other than the dominant loop for each landscape; for example, A1 loops are assumed to make no contribution to ET in the DIAI landscape. (4) The observed landscape of total energy transfer (the sum over the three FPVs in which ET is seen) is not flat, showing that some of the constructs adopt shapes with reduced or zero energy transfer. Based on the observed hyperstability of all of the loops, including those that do not support FRET, the remaining population for each construct is ascribed to proposed extended (E) loops.
From the measured ET values for three FPV landscapes (DIAI, DIAE and DEAI) and the assumptions above we calculate populations for the three loops that support FRET (P1, A1 and A2), and the population of the extended form is taken to be the remainder. This corresponds to assuming that the ET of the extended loops is uniformly zero. Hence, the calculated populations of E loops are minimum estimates. For IPTG•LacI•DNA complexes the same ETl values are used, but ‘E’ represents a state that includes the E loops and also any other complexes that exhibit decreased FRET. Varying the ETl values over any reasonable range maintains the general shapes shown in Figures 3B and 4B. If ETl is increased for all loops, the calculated E loop populations increase.
Figure 3.

FRET results for FPV landscapes differentiate among LacI-mediated DNA loop topologies. (A) The energy transfer efficiencies, obtained as in Figure 2 from enhanced acceptor emission, are presented as 5 × 5 matrices indexed by linker as described in Figure 1. The four FPVs for each construct in the landscape were prepared in parallel PCR reactions using one set of four primers. This yielded a total of 100 double-labeled samples. The adaptor and corresponding construct nomenclature are shown below the surface maps. (B) Loop population distributions for P1, A1, A2 and extended (E) topologies determined from the energy transfer efficiencies in all of the FPV landscapes. The four populations were calculated using the assumptions described in the text. The E loop landscape accounts for the difference between the observed total FRET and the expected total FRET for a population consisting only of loops anchored by V-shaped LacI. The residuals of the population fit (theory – expt) are shown at the bottom; the negative residual for construct 9C16 is discussed in the text.
Figure 4.

P1, A2 and E loops show distinct behaviors in electrophoretic mobility shift assays with and without IPTG. In both polyacrylamide gels, 2 nM (final concentrations) doubly-labeled constructs (DIAI) were mixed with 2 or 4 nM of LacI and incubated at 22°C for 15 min. Then 4 or 10 nM of plasmid competitor was added to the indicated samples with 4 nM LacI and incubated for another 15 min. The asterisk indicates that plasmid competitor was added prior to the addition of LacI. The bottom gel contained 5 mM IPTG, and the samples loaded onto this gel were preincubated with 5 mM IPTG before the addition of LacI. Running times were about 2 h for the top gel and 2.5 h for the bottom gel. The identification of looped (L), singly bound (sb) and doubly bound (db) complexes is based on previous work (23) and the responses to protein and competitor concentrations.
The populations fl for each loop type are given by the solution to the set of three equations below, solved individually for each construct, subject to the constraints that each fl is between 0 and 1 and the fl sum to 1:
where the ETfpv are the observed ET values for each FPV. Given the above assumptions, the populations fl for P1, A1 and A2 should reduce to the ratios ETfpv/ETl and the fraction fE found in extended states should be simply  . In practice, because the small uncertainty in acceptor quenching means that some of the calculated ET values are negative (although small), some of the fl's are calculated to be <0. Also, the peak populations may not be perfectly uniform, and use of the ETfpv/ETl ratios and the uncertainty in the ETl value for the dominant loop lead to some constructs with
  . Therefore, we used the constrained minimization tools in Matlab to give best-fit values for the fl's. Whenever fE is positive, the residuals in Figure 3 are zero, or else slightly positive when observed ET values are negative. The only significant negative residual is for 9C16, indicating excess observed FRET. This could be due to a larger true ETl value, an unusual extent of crosstalk, or differences in labeling efficiency.
The population distributions from Figure 3B were tiled by inserting a 2.5-bp gap between tiles to reflect an assumed 10.5 bp helical repeat, and then populations were linearly interpolated using the interp2 function in Matlab. The tiling considers only the effects of changing interoperator helical phasing, not the small changes in distances per se. All Matlab routines are available upon request.
RESULTS
DNA loop geometry and stability are controlled by a balance among the free energies for DNA bending and twisting, specific and nonspecific protein–DNA binding, protein oligomerization and deformation and entropic localization of binding sites. Our prebent looping constructs are useful for studying loops because they not only reduce the bending free energy but also allow different geometries to be selected based on the helical phasing between the operators and the bend direction. A complete family of related DNA looping substrates should provide examples of all of the accessible loop topologies, and a systematic study of the landscape of loops as a function of DNA shape and sequence can help disentangle all of the contributions to loop free energy. The DNA constructs elaborated from our previous prebent hyperstable looping substrates are illustrated in Figure 1. To allow direct detection of a variety of loop topologies, we further generalized the system by making FPVs with fluorophores both internal (DI, AI) and external (DE, AE) to the operators; our previous work used exclusively the DIAI arrangement. For each FPV, FRET should be maximal for one of the four possible closed form loop topologies, and these signatures are also illustrated in Figure 1. The P1 loop gives maximal FRET with the DIAI FPV, P2 with DEAE, A1 with DIAE and A2 with DEAI, assuming that the LacI V-shape does not change. The fluorophores are all in analogous positions relative to the lac operators, so we expected that the maximal level of energy transfer would be the same for each of the loop topologies.
FPV landscapes differentiate among protein–DNA loop topologies
FRET efficiency was measured for each of the four FPVs of each of the 25 DNA constructs, in the presence of saturating LacI and also LacI + IPTG, with the spectra exhibiting maximal FRET being shown in Figure 2. We refer to each set of 25 constructs measured with a single FPV pair as an FPV landscape, so there are four landscapes. Energy transfer efficiencies for the constructs giving maximal FRET are 29% for 9C16-DIAI (maximal FRET in the P1 topology), 24% for 13C14-DIAE (A1 topology) and 28% for 5C18-DEAI (A2 topology). No FRET was observed for any DEAE construct, suggesting that none of our constructs can form P2 loops and also that ‘sandwich complexes’ in which one LacI tetramer bridges two separate DNA molecules do not contribute measurable FRET for any of these molecules under our conditions. The overall FRET efficiency was lower than expected based on previous single-molecule FRET measurements that showed very efficient energy transfer for the 9C14 construct (24). This discrepancy suggests overestimation of the true fluorophore labeling efficiencies here, which were measured as 100% for DI and AE at the stage of primer labeling but could not be measured in the final PCR products. For robust comparison among FPVs, the quoted FRET efficiencies do include consideration of the measured relative labeling efficiencies of DI versus DE (70%) and of AI (76%) versus AE primer sets, determined as in Supplementary Data. LacI affects donor quantum yield (Supplementary Figure S1), making quantitative measurements of donor quenching through FRET difficult, so all of the apparent energy transfer values discussed here are derived from enhanced acceptor emission. All of the FRET efficiencies for all FPV landscapes and conditions, calculated using both donor quenching and acceptor emission, are provided in the Supplementary Data.
Figure 3 presents the four FPV energy transfer landscapes as 5 × 5 matrices, with each column sharing a donor-side phasing adapter and each row an acceptor-side adapter and the efficiency plotted on the z-axis. The distinct FRET peaks in the separate FPV landscapes identify the regions where P1, A1 and A2 loops dominate. The constructs giving maximum energy transfer in one FPV landscape generally show little or no transfer in the others, confirming the implication in Figure 1 that a loop of a particular topology shows strong energy transfer for only one arrangement of fluorophores. For example, 9C16 shows 29% transfer in the DIAI (P1) landscape but no more than 4–6% in the DIAE or DEAI landscapes, and 13C14 shows 24% transfer in the DIAE (A1) landscape and no measurable transfer in any of the others.
These results confirm that changing the helical phasing between the central DNA bend and the operators can control loop geometry. They confirm expectations based on previous work an Figure 1 that operators directed outward with respect to the center of A-tract curvature favor the P1 topology. Constructs with one operator directed inward prefer A1 or A2 loops if the other operator can be moved into position without excessive twisting. The cause for choosing between A1 and A2 loops is not visually obvious; they differ in that the DNA lengths between the operator and the bend are markedly different on each side.
Calculated loop population distributions suggest the existence of an extended loop
The FPV landscapes of Figure 3 each provides a different window on the underlying population distribution for each construct among P1, A1 and A2 loop topologies. To extract these populations rigorously would require knowledge of the energy transfer efficiency for each topology for each individual construct, which is not available from our data; instead we simply assume that the energy transfer efficiency for a given topology is constant, i.e. that any deformation of the LacI•DNA complex is similar for all the constructs within a given loop topology. The peak FRET efficiencies are similar (though not identical) for each landscape, suggesting that the LacI protein geometry is similar in all V-shaped loops; our previous theoretical work assumed rigid protein (30). The assumption of constant energy transfer efficiency within a topology and the observation above that the peak constructs in each landscape adopt uniform shapes together imply that the population adopting each topology for a given construct is approximately equal to the energy transfer in the corresponding FPV landscape for that construct divided by the maximum amount of transfer in that landscape; the ‘Materials and Methods’ section describes small corrections to give final values.
Competition experiments in which unlabeled competitor is added to LacI–DNA loops show that the observed FRET is resistant to the challenge for many hours, even for low-FRET constructs (Supplementary Figure S2). This suggests that, surprisingly, all of these constructs make loops that are hyperstable: if any of the DNA were found in unlooped forms, they would be destroyed via formation of intermediate sandwich complexes. The total of the calculated loop topology populations should thus be 100% for each construct, but Figure 3 showed that this is clearly not the case. Several constructs (for example 13C10) show an apparent total population of <5%. This dramatic discrepancy is unlikely to be accounted for by small variations in energy transfer efficiency among constructs forming loops with V-shaped LacI, suggesting that there are stable looped states with substantially altered protein conformations that exhibit much lower energy transfer efficiency than P1, A1 or A2. The suggestion of a stable extended loop state is in accord with previous models (20,23). Interpreting the absence of FRET in parts of the landscape as evidence for such a loop is possible only because the complete landscape was shown to be hyperstable.
LacI opening in LacI•DNA looped complexes has been suggested previously by gel mobility variations (23). To confirm that constructs that do not exhibit FRET are still forming stable LacI•DNA loops and to explore their loop shapes we performed EMSAs on the low-FRET construct 13C10 as well as two high-FRET constructs that form P1 and A2 loops, 9C16 and 5C18, respectively. Additionally, we tested the responses of each loop to excess LacI and plasmid competitor. The top gel in Figure 4 confirms that 13C10 forms a loop that is just as stable to competitor as the high-FRET loops. The 9C16 loop (P1) migrates more rapidly than the other two loops, as seen previously (23), while the 13C10 loop and the 5C18 loop (A2) are similar to each other. We conclude that the P1 loop is relatively compact but that the EMSA cannot distinguish between an A2 loop and the proposed extended loop.
We include the extended (E) loop in the population distributions by assuming that it exhibits no energy transfer, such that the population of this state quantifies the total ‘missing energy transfer’ across the landscapes (see ‘Materials and Methods’ section). The calculated population distribution landscapes for P1, A1 and A2 loops for all constructs (Figure 3B) are similar in shape to the observed FRET efficiency, as they must be. The calculated E loop population landscape shows that the constructs that have substantial E contributions are centered on the 13C10/13C18 corner as well as between antiparallel loops. These molecules generally appear in Figure 1 to have operators that are torsionally out of phase.
The residuals for the population distribution fits of Figure 3B are significant only for P1 loops, for which the residuals are negative, indicating greater total FRET than the model accounted for. This could reflect long-distance FRET across the operator, giving crosstalk between landscapes; for example, P1 loops could give weak FRET in the DIAE and DEAI landscapes via head group rotation (7) or compression of the V-shape of the protein. The absence of any transfer in the DEAE landscape shows that A1 and A2 loops do not exhibit any crosstalk, so while we cannot eliminate the possibility that the P1 loops do exhibit crosstalk we ignore it in the population modeling. Thus, the low FRET observed for P1 loops in the DIAE and DEAI landscapes is modeled as small antiparallel populations for all of the constructs that form predominantly P1 loops. The negative residuals could also be due to underestimating the maximum FRET for a uniform P1 population. If we assume that the maximum possible P1 FRET is actually larger, the residuals are eliminated and the calculated contributions of A1 and A2 loops in the predominantly P1 populations increase. This could come about, for example, by compression of the V-shaped LacI. Furthermore, if the E states actually exhibit non-zero FRET then their populations have also been underestimated. The E loop population landscape accounts for 31% of the total population in the DNA sequence space in Figure 3, but this is only a minimum estimate because the calculated total FRET, summed over all the FPVs, never reaches the maximum FRET previously observed for a V-shaped LacI•DNA complex (∼90%). Quantitative interpretation of apparent FRET is complicated by uncertainties in the labeling efficiency and the extent of donor quenching, but single-molecule methods should be able to identify whether variations in maximum FRET efficiency exist.
In summary, the approach of making FPVs for all of the constructs on the DNA sequence landscape gives us confidence that we detect all loops anchored by the canonical V-shaped LacI. We can calculate the relative populations of all of these loops with reasonable precision by assuming that the FRET efficiency is similar for all of them. The hyperstability demonstrated by competition experiments, the missing FRET displayed in Figure 3B and the EMSA on no-FRET LacI•DNA loops all provide evidence for stable loops with extended forms of LacI. We can only set wide upper and lower bounds on the true populations for extended loops. Subtle patterns in the population modeling suggest that the maximum FRET efficiencies and therefore loop geometries may differ even among V-shaped LacI loops. Modeling of the extended forms and of variations in LacI geometry in the V-shaped loops will require consideration of protein flexibility.
IPTG destabilizes loops but does not redistribute loops among different topologies
Based on rod mechanics modeling, we expect that even for the hyperstable looping constructs used here the loop free energies vary widely across the landscape. We cannot detect these variations at the LacI concentrations used (∼nM), which are well above Kd. Previous work has shown that IPTG•LacI•DNA loops are detectable with FRET (28) and sufficiently stable to repress transcription (16), but since IPTG is an inducer the IPTG-bound loops must be much higher in free energy than ligand-free loops. Therefore, studying the IPTG-bound loops may allow study of the relative stabilities of loops as well as giving insight into mechanisms of induction of the operon.
An EMSA performed in the presence of saturating IPTG (5 mM), the bottom gel of Figure 4, showed decreased looping probability and decreased overall binding affinity for the P1, A2 and E constructs. Construct 9C16 (P1) forms a looped complex in the presence of IPTG whose mobility is very similar to the ligand-free loop, but it readily converts to a LacI2•DNA complex when excess LacI is added. Construct 5C18 (A2) forms a loop with increased mobility, and smearing in the gel suggests interconversion among singly bound, looped and doubly bound states. Construct 13C10 (E) converts to a form that migrates slowly in a smear, perhaps representing a mixture of loops or a network that breaks down slowly to enter the gel. In all cases, the addition of excess unlabeled competitor plasmid in the presence of IPTG caused a substantial release of labeled DNA that was not observed in the absence of IPTG. The EMSA results suggest that IPTG•LacI•DNA loops are stable in the absence of competitor but have different shapes than the ligand-free loops.
As seen for the ligand-free loops, the combination of a landscape of DNA constructs and FPVs allowed the effects of IPTG to be monitored in solution. The same samples analyzed in Figure 3A were saturated with IPTG (5 mM) and allowed to equilibrate for 1 min before collection of emission spectra. (Pre-incubation of 9C14 with IPTG gave identical results, suggesting that equilibrium was reached.) The general shapes of the resulting FRET landscapes (Figure 5A) are similar with and without IPTG, confirming that LacI can still effectively loop DNA in the presence of IPTG (16,37). IPTG always decreases FRET, and it almost completely eliminates FRET for six constructs. The observation that IPTG does not increase FRET for any construct on any landscape shows that IPTG binding does not cause substantial redistribution among the P1, A1 and A2 loops; this would have increased at least one of the populations.
Figure 5.

LacI•DNA looped complexes are destabilized by IPTG but they are not redistributed among P1, A1 and A2 topologies. (A) Pre-formed LacI•DNA looped complexes were equilibrated with saturating (5 mM) IPTG, and FRET efficiencies were measured as in Figure 2. Destabilization of loops anchored by V-shaped LacI is apparent from the flattening of each FPV surface relative to the results of Figure 3. Redistribution of loops among topologies would have increased FRET for some constructs, which is not observed. (B) FRET was measured after the addition of excess (3 nM) LacI to the IPTG•LacI•DNA looped complexes. The further loss of FRET with additional LacI suggests that excess LacI partitions the less stable IPTG•LacI•DNA looped complexes partially into doubly bound complexes. FRET did not increase significantly for any of the constructs, indicating that the initial loss of FRET upon IPTG saturation was not due to the release of free DNA, which would have re-bound LacI to give looped DNA.
To understand IPTG effects on LacI•DNA loops it is necessary to establish the nature of the IPTG-bound complexes. Solution data obtained at a single LacI concentration cannot identify whether decreased FRET reflects the appearance of free DNA, unlooped singly bound DNA, alternative loop shapes or doubly bound DNA. The addition of excess LacI can distinguish among these possibilities. If there is free DNA present, excess LacI should repopulate the loop state and increase FRET. On the other hand, excess LacI should readily partition singly bound complexes or relatively unstable loops into doubly bound unlooped complexes, reducing the observed FRET further. Excess LacI can convert even a stable loop to a doubly bound complex, with the extent of conversion depending on the loop free energy and opening kinetics. We suggest that if LacI addition after IPTG addition decreases FRET further, the IPTG must have destabilized the loop enough to make it unstable relative to a doubly bound complex. On the other hand, if IPTG addition causes a decrease in FRET but subsequent LacI addition causes no further change, the IPTG-bound LacI still forms stable loops but with altered conformation(s).
FRET was measured upon increasing LacI from 3 to 6 nM after IPTG saturation, for all constructs and FPVs. Figure 4 shows that IPTG with excess LacI generally decreases FRET with a similar pattern to saturating IPTG alone, suggesting that addition of LacI to an IPTG-bound complex partitions relatively unstable loops into doubly bound complexes. There is incremental FRET recovery or no FRET change for a few A2 loops. Given the EMSA results showing altered loop mobilities but very little free DNA, the small FRET increases for A2 loops probably do not represent the conversion of free DNA to a loop. The resistance of the remaining FRET to excess LacI suggests that these loops are converted to a stable low-FRET form, as suggested by the EMSA. We do not know whether this form resembles the extended loops proposed for ligand-free loops; since IPTG decreases the specificity of LacI, the IPTG-bound loops could instead be loops anchored one operator and one nonspecific site, which would allow the DNA to deform to minimize its deformation energy.
In summary, all of these results are consistent with the initial loss of FRET upon IPTG saturation being due to singly bound complexes, altered loop conformations or quasi-stable loops with unchanged geometry. IPTG binding does not appear to cause redistribution among V-shaped loops, but it leads to relatively stable alternative loop conformations, especially for A2 constructs. These low-FRET loops need not be the same as the extended form loops proposed for ligand-free complexes.
DISCUSSION
Determining the structure and stability of DNA loops is essential for a quantitative understanding of gene regulation. Previous studies have proposed a variety of DNA loop topologies and Lac repressor (LacI) conformations in loops, but it has not been possible to map out the free energy landscape that controls loop shape and stability. The systematically constructed DNA sequence landscape of Figure 1 allows us to stabilize a variety of DNA loop geometries. FPVs allow direct FRET detection of all possible V-shaped LacI loop topologies. This coupled approach provides estimates for the FRET minima and maxima over sequence space for each loop topology, which enables analysis of the population distribution among loop topologies. The looping hyperstability conferred by the A-tract bend makes the experiments much more powerful.
Direct FRET detection of loop topology populations using FPV landscapes
The FRET peaks and valleys in the landscapes for different FPVs reflect the free energy landscape of different LacI•DNA loop topologies, as in Figures 3 and 5. FRET comparisons among FPV landscapes demonstrate unambiguous FRET detection of antiparallel loops for the first time. The FRET maxima for the A1 and A2 FPV landscapes are located at constructs that show near-zero FRET in all the other landscapes, so these maxima represent constructs that adopt a nearly uniform population of a single antiparallel loop type. The maximum in the P1 landscape (9C16) shows a small amount of FRET in the other FPVs. As discussed in ‘Results’ section, this could reflect crosstalk due to compression of the protein or else the admixture of A1 or A2 forms throughout the P1 peak. The boundary DNA constructs, found in the areas between FRET peaks that show significant FRET on multiple FPV landscapes, adopt more than one loop topology because their sequences are not optimal for any single topology. A surprisingly large proportion of the DNA sequence space supported DNA looping: at least 23 of the 25 bend-operator phasing variants form loops that can be detected in one of the FPVs and are stable to challenge by competitor DNA. Even the constructs that do not support efficient FRET are still looped (Figure 4). For example, 13C10 loop, which has among the lowest energy transfer efficiencies, was shown to be stable by EMSA. Based on in vivo repression results and on earlier work on loop stability (16,38–40) we had anticipated that operators that are torsionally out of phase would not support efficient looping, but apparently the decreased bending energy cost due to the A-tracts compensates for the energy cost of twisting the DNA to form a specific loop.
Given our observations of general hyperstability and the uniformity of loops at the FRET maxima, the analysis reported in Figure 3 converts the ‘missing FRET’ summed over all of the FPVs into an estimated population landscape of dark looped states for each construct, referred to as extended (E) states. We have the confidence to interpret the absence of a FRET signal only because of the near-complete coverage of the landscape and the hyperstability of the loops, but we do not have any evidence from bulk FRET as to the shapes of loops that exhibit low FRET. They could adopt any conformation or mixture of conformations on a continuum between low-FRET distorted V-shaped LacI loops and the zero-FRET fully extended loop illustrated in Figure 1. Our population modeling also does not consider LacI headpiece movement, which crosslinking studies have shown to be important for loop formation (6). Varying fluorophore position base pair by base pair might identify these local movements. We cannot convert apparent FRET efficiencies to interfluorophore distances, but single-molecule FRET could address these deficiencies. Techniques like FIONA and SHRImP (41,42) could allow direct analysis of the proposed extended low-FRET LacI geometries. These results all suggest that flexibility of the LacI protein is important in determining loop geometry and stability, especially for loops that do not form optimal V-shaped topologies.
FPV landscapes confirm and extend computational LacI•DNA loop energy landscapes
Our work was motivated in part by the opportunity to systematically compare the experiments with a theoretical LacI•DNA loop energy landscape predicted for the same family of constructs using DNA rod mechanics. The computations identified the most stable loop (P1, A1 or A2) for each construct. The energy landscape in Figure 6A (30) shows the total DNA deformation energy of the most stable V-shaped LacI LacI•DNA loop as a function of helical rotation of the LacI operators. Figure 6B shows an analogous representation of the experimental data obtained by tiling and interpolating the map of populations from Figure 3B. The experimental populations match the rod mechanics energy landscape predictions for the low-energy V-shaped loops remarkably well. The theoretical work did not consider LacI deformation; although subsequent studies proposed an extended form LacI (43), it has not yet been integrated into modeling of our DNA sequence landscape. The E loop populations from Figure 3B are also shown in the distributions of Figure 6B. The E loop area aligns with the operator phasings that were computed to be the highest in energy for V-shaped loops. These constructs benefit the most from LacI flexibility in loop formation.
Figure 6.

Comparisons of the theoretical LacI•DNA looping energy landscape with FPV-derived population landscapes. (A) DNA rod mechanics calculations for the energy of V-shaped LacI-mediated looping, assuming a rigid protein, over the landscape of intrinsically curved DNA (30). The energy for each loop type (P1, A1 and A2) was computed as a function of the helical rotation of each operator through 360°, and the lowest-energy loop was selected. The results were then tiled. The gray box is placed to align the theoretical results with the experimental data shown in (B and C). The diagonal symmetry axis emerges from the model. (B) Combined contour plot of the loop population distributions for the P1, A1, A2 and E topologies calculated from the FPV landscape FRET efficiencies. The population distributions from Figure 3B (black dots within the transparent square) were tiled assuming a 10.5-bp helical repeat (boxes) and linearly interpolated. The populations of V-shaped LacI•DNA loops are in excellent agreement with the rod mechanics model. The E (extended) loops, which require LacI flexibility, align with the computational predictions for high-energy V-shaped LacI•DNA loops. (C) The population distributions for IPTG saturated LacI•DNA loops calculated in the same manner. The ‘dark’ FRET population comprises all LacI•DNA complexes that show no FRET. The high-energy boundaries between V-shaped loops are more apparent in the presence of IPTG, and they also correlate well with the calculated boundaries for V-shaped loops shown in (A).
We cannot quantify the free energy differences among loop topologies, but the concordance of boundaries between populations is a strong validation of the theoretical methods and the underlying models for DNA bending and twisting flexibility and sequence-dependent curvature. Our results do not exclude the possibility of enhanced flexibility of DNA under strain, but because of LacI flexibility, the possible effects of kinked or other unusually flexible DNA states are masked (26,44,45). Kinked or melted DNA would be most important in stabilizing the highest-energy loops, which require substantial DNA deformation, but these are precisely the loops that we believe are actually stabilized predominantly by dramatic protein deformation. The enhanced DNA flexibility models could be more rigorously evaluated using stiffer looping proteins to force more DNA deformation, if such proteins exist.
These experiments on the control of loop topology by bend-operator phasing are consistent with both the calculated loop populations and the expectations derived from the models of Figure 1C. We speculate that the extended form E loops have their own complex energy landscape and that an E loop is observed when its energy drops below that of a V-shaped loop. For example, the P1 loop is the lowest-energy V-shaped loop when the operators are oriented outward relative to the direction of curvature of the A-tract bend, but these operator phasings would also correspond to the highest energy E loop because forming an E loop would require bend inversion or large twist changes on both sides. The A1 and A2 loops are stable when the operators are largely perpendicular to the central bend and parallel to each other, and the E loops are maximally stable when the operators are torsionally out of phase.
The diagonal symmetry (dashed line in Figure 6A) is built in to the computational representation because the bend is idealized and is considered to be centered between the operators, so switching phasings gives the same DNA conformation. The symmetry is largely confirmed by the results in Figure 6B and C, but there are deviations from perfect symmetry that may reflect an imperfect underlying model for sequence-dependent DNA shape, the constraint of a central versus an off-center bend position in the modeling, and/or the omission of protein flexibility from these initial stages of modeling. In spite of these small differences, these results demonstrate that our simple interpretation of population modeling using the observed FRET maxima for each landscape is an efficient method for relating FRET efficiencies for FPV landscapes (Figure 3A) to loop population distribution landscapes (Figures 3B and 6B) and finally to LacI•DNA loop energy landscapes (Figure 6A).
The energy landscape for IPTG-bound LacI•DNA favors low-FRET loops
IPTG may provide a window into the underlying free energies for the V-shaped LacI•DNA looped complexes. Population distributions for the IPTG-bound P1, A1 and A2 loops were calculated from the data of Figure 5A, using the same ETl matrix of FRET efficiencies as for the ligand-free loops. IPTG decreased FRET, so the calculated V-shaped loop populations displayed in Figure 6C decrease for all landscapes. The low-FRET states are identified simply as dark states since they may not all be loops. IPTG did not cause dramatic redistribution among the high-FRET loops, so apparently it does not stabilize a new lowest-energy quaternary structure for LacI•IPTG. The P1, A1 and A2 peaks of the landscapes in Figure 6C appear to be more isolated than in Figure 6B, suggesting that the less stable boundary constructs have been more efficiently converted to IPTG•LacI•DNA complexes that do not support FRET. The EMSA of Figure 4 suggests that the P1 loop conformation is more resistant to IPTG than the A2 loop or the E loop. The A2 loop converts to a shape with a much faster average mobility, but it retains some resistance to challenge by competitor DNA. The addition of excess LacI to IPTG•LacI•DNA looped complexes readily converts singly bound and relatively unstable loops to a doubly bound complex. Excess LacI generally causes a further decrease in FRET, except that some of the A2 loops are unchanged, suggesting that these IPTG•DNA•LacI complexes are partially converted to stable low-FRET loops, in agreement with the EMSA. These could be specific-nonspecific loops as mentioned above.
As expected, IPTG-bound V-shaped LacI•DNA loops are higher in free energy than the ligand-free loops. Based on the relative stability of A2 loops and the sensitivity of the E loops, the increase in free energy does not seem to be constant across the landscape. If IPTG binding does not change the loop shape, then the loop free energy increase upon binding should correspond to converting the specific LacI•DNA interfaces to non-specific interfaces, previously described by Lewis as the transition from an R to R* conformation (46). The different loop types would be expected to behave similarly in accordance to this model, whereas our data show that the loops vary in their behavior. There is in vivo evidence for IPTG loops having an operator phasing preference that is different from the ligand-free loops (16). Our results confirm and extend earlier demonstrations (16,28,37) that IPTG•LacI•DNA loops can be stable but that they are not simply destabilized ligand-free loops.
Biological implications of the control of loop geometry
Many cellular regulatory events depend on manipulating DNA shape to sequester a gene or enhance its expression. Both eukaryotes and prokaryotes utilize DNA deformation to store energy through supercoiling, which can potentiate DNA looping. Our studies using intrinsically bent DNA flanked by two operators may mimic highly bent supercoiled DNA, although our molecules are not torsionally constrained. Our demonstration of loop stability over an entire DNA sequence landscape is in agreement with results showing that loops form similarly in vivo over a wide range of interoperator distances (37). Future work on embedding these constructs in DNA minicircles will determine whether they can also mimic torsional effects in vivo (i.e. changes in the periodicity of repression). Saturating IPTG could not destabilize many of these LacI•DNA loops, in accordance with the periodicity of reporter activity as a function of operator spacing even after induction (16). It is well known that DNA loops can be controlled by the binding of DNA bending proteins in the loop (22,47), and it is also possible that inducer-bound loops, or less stable loops in general, can be controlled by dynamic mechanisms such as the supercoiling or mechanical forces resulting from translocation by helicases or the transcriptional machinery (48,49). If loops are kinetically stable, the persistence of one or another alternative loops could provide a memory of an earlier state of the DNA shape in the chromosome.
CONCLUSION
The phasing construct/FPV landscape system has proven to be a powerful tool not only for determining the preferred DNA sequence-dependent loop topologies for LacI•DNA loops, but also for calculating population distributions among them. The stability of the LacI•DNA loop topologies and geometries observed here suggests that protein flexibility enhances looped complex stability. DNA looping models have often ignored the contributions of protein flexibility, and this is clearly an oversimplification. Systems biology models for gene regulation will need to contend with the complicated dependence of loop free energy on DNA sequence and the distribution of bound proteins as well as on induction, protein flexibility and the DNA supercoiling environment. We believe that multivariate data sets like the one presented here will be valuable in bridging among biochemical experiments, single molecule experiments, theoretical models and in vivo observations.
SUPPLEMENTARY DATA
Supplementary Data are available at NAR Online: Supplementary Table 1, Supplementary Figures 1–3, Supplementary Methods and Supplementary Data Set.
FUNDING
A National Science Foundation grant (CMMI-0825488 to N.C.P.); A.R.H. was supported in part by the Dr. Herman Kraybill Fellowship; and preliminary studies were supported by a National Science Foundation Career Award (to J.D.K.). Funding for open access charge: NSF (grant CMMI-0825488 to N.C.P.).
Conflict of interest statement. None declared.
Supplementary Material
ACKNOWLEDGEMENTS
We are grateful to the Sintim laboratory for access to the fluorimeter and to the Rokita lab for access to other equipment. We acknowledge Daniel Gowetski for help with LacI purification and other members of the Kahn and Perkins laboratories for useful discussion. We are grateful to the one of the anonymous reviewers for prompting us to identify a serious problem with an early version.
REFERENCES
- 1.Oehler S, Eismann ER, Kramer H, Muller-Hill B. The three operators of the lac operon cooperate in repression. EMBO J. 1990;9:973–979. doi: 10.1002/j.1460-2075.1990.tb08199.x. [DOI] [PMC free article] [PubMed] [Google Scholar]
- 2.Daber R, Stayrook S, Rosenberg A, Lewis M. Structural analysis of Lac repressor bound to allosteric effectors. J. Mol. Biol. 2007;370:609–619. doi: 10.1016/j.jmb.2007.04.028. [DOI] [PMC free article] [PubMed] [Google Scholar]
- 3.Friedman AM, Fischmann TO, Steitz TA. Crystal structure of Lac repressor core tetramer and its implications for DNA looping. Science. 1995;268:1721–1727. doi: 10.1126/science.7792597. [DOI] [PubMed] [Google Scholar]
- 4.Lewis M, Chang G, Horton NC, Kercher MA, Pace HC, Schumacher MA, Brennan RG, Lu P. Crystal structure of the Lactose operon repressor and its complexes with DNA and inducer. Science. 1996;271:1247–1254. doi: 10.1126/science.271.5253.1247. [DOI] [PubMed] [Google Scholar]
- 5.Ruben GC, Roos TB. Conformation of Lac repressor tetramer in solution, bound and unbound to operator DNA. Microsc. Res. Tech. 1997;36:400–416. doi: 10.1002/(SICI)1097-0029(19970301)36:5<400::AID-JEMT10>3.0.CO;2-W. [DOI] [PubMed] [Google Scholar]
- 6.Rutkauskas D, Zhan H, Matthews KS, Pavone FS, Vanzi F. Tetramer opening in LacI-mediated DNA looping. Proc. Natl Acad. Sci. USA. 2009;106:16627–16632. doi: 10.1073/pnas.0904617106. [DOI] [PMC free article] [PubMed] [Google Scholar]
- 7.Villa E, Balaeff A, Schulten K. Structural dynamics of the Lac repressor–DNA complex revealed by a multiscale simulation. Proc. Natl Acad. Sci. USA. 2005;102:6783–6788. doi: 10.1073/pnas.0409387102. [DOI] [PMC free article] [PubMed] [Google Scholar]
- 8.Kalodimos CG, Biris N, Bonvin AM, Levandoski MM, Guennuegues M, Boelens R, Kaptein R. Structure and flexibility adaptation in nonspecific and specific protein-DNA complexes. Science. 2004;305:386–389. doi: 10.1126/science.1097064. [DOI] [PubMed] [Google Scholar]
- 9.Romanuka J, Folkers GE, Biris N, Tishchenko E, Wienk H, Bonvin AM, Kaptein R, Boelens R. Specificity and affinity of Lac repressor for the auxiliary operators O2 and O3 are explained by the structures of their protein–DNA complexes. J. Mol. Biol. 2009;390:478–489. doi: 10.1016/j.jmb.2009.05.022. [DOI] [PubMed] [Google Scholar]
- 10.Berg OG, Blomberg C. Association kinetics with coupled diffusional flows. Special application to the Lac repressor–operator system. Biophys. Chem. 1976;4:367–381. doi: 10.1016/0301-4622(76)80017-8. [DOI] [PubMed] [Google Scholar]
- 11.Loverdo C, Benichou O, Voituriez R, Biebricher A, Bonnet I, Desbiolles P. Quantifying hopping and jumping in facilitated diffusion of DNA-binding proteins. Phys. Rev. Lett. 2009;102:188101. doi: 10.1103/PhysRevLett.102.188101. [DOI] [PubMed] [Google Scholar]
- 12.Furini S, Domene C, Cavalcanti S. Insights into the sliding movement of the Lac repressor nonspecifically bound to DNA. J. Phys. Chem. B. 2010;114:2238–2245. doi: 10.1021/jp906504m. [DOI] [PubMed] [Google Scholar]
- 13.Barkley MD, Riggs AD, Jobe A, Burgeois S. Interaction of effecting ligands with Lac repressor and repressor–operator complex. Biochemistry. 1975;14:1700–1712. doi: 10.1021/bi00679a024. [DOI] [PubMed] [Google Scholar]
- 14.O'Gorman RB, Dunaway M, Matthews KS. DNA binding characteristics of Lactose repressor and the trypsin-resistant core repressor. J. Biol. Chem. 1980;255:10100–10106. [PubMed] [Google Scholar]
- 15.Zhan H, Camargo M, Matthews KS. Positions 94-98 of the lactose repressor N-subdomain monomer–monomer interface are critical for allosteric communication. Biochemistry. 2010;49:8636–8645. doi: 10.1021/bi101106x. [DOI] [PMC free article] [PubMed] [Google Scholar]
- 16.Becker NA, Kahn JD, Maher LJ., III Bacterial repression loops require enhanced DNA flexibility. J. Mol. Biol. 2005;349:716–730. doi: 10.1016/j.jmb.2005.04.035. [DOI] [PubMed] [Google Scholar]
- 17.Bellomy GR, Mossing MC, Record MT., Jr Physical properties of DNA in vivo as probed by the length dependence of the lac operator looping process. Biochemistry. 1988;27:3900–3906. doi: 10.1021/bi00411a002. [DOI] [PubMed] [Google Scholar]
- 18.Muller J, Oehler S, Müller-Hill B. Repression of lac promoter as a function of distance, phase and quality of an auxiliary lac operator. J. Mol. Biol. 1996;257:21–29. doi: 10.1006/jmbi.1996.0143. [DOI] [PubMed] [Google Scholar]
- 19.Semsey S, VirnikK, Adhya S. A gamut of loops: meandering DNA. Trends Biochem. Sci. 2005;30:334–341. doi: 10.1016/j.tibs.2005.04.009. [DOI] [PubMed] [Google Scholar]
- 20.Swigon D, Coleman BD, Olson WK. Modeling the Lac repressor-operator assembly: the influence of DNA looping on Lac repressor conformation. Proc. Natl Acad. Sci. USA. 2006;103:9879–9884. doi: 10.1073/pnas.0603557103. [DOI] [PMC free article] [PubMed] [Google Scholar]
- 21.Levandoski MM, Tsodikov OV, Frank DE, Melcher SE, Saecker RM, Record MT., Jr Cooperative and anticooperative effects in binding of the first and second plasmid Osym operators to a LacI tetramer: evidence for contributions of non-operator DNA binding by wrapping and looping. J. Mol. Biol. 1996;260:697–717. doi: 10.1006/jmbi.1996.0431. [DOI] [PubMed] [Google Scholar]
- 22.Lobell RB, Schleif RF. AraC-DNA looping: orientation and distance-dependent loop breaking by the cyclic AMP receptor protein. J. Mol. Biol. 1991;218:45–54. doi: 10.1016/0022-2836(91)90872-4. [DOI] [PubMed] [Google Scholar]
- 23.Mehta RA, Kahn JD. Designed hyperstable Lac repressor•DNA loop topologies suggest alternative loop geometries. J. Mol. Biol. 1999;294:67–77. doi: 10.1006/jmbi.1999.3244. [DOI] [PubMed] [Google Scholar]
- 24.Morgan MA, Okamoto K, Kahn JD, English DS. Single-molecule spectroscopic determination of Lac repressor–DNA loop conformation. Biophys. J. 2005;89:2588–2596. doi: 10.1529/biophysj.105.067728. [DOI] [PMC free article] [PubMed] [Google Scholar]
- 25.Lilja AE, Jenssen JR, Kahn D. Geometric and dynamic requirements for DNA looping, wrapping and unwrapping in the activation of E. coli glnAp2 transcription by NtrC. J. Mol. Biol. 2004;342:467–478. doi: 10.1016/j.jmb.2004.07.057. [DOI] [PubMed] [Google Scholar]
- 26.Cloutier TE, Widom J. DNA twisting flexibility and the formation of sharply looped protein–DNA complexes. Proc. Natl Acad. Sci. USA. 2005;102:3645–3650. doi: 10.1073/pnas.0409059102. [DOI] [PMC free article] [PubMed] [Google Scholar]
- 27.Wiggins PA, van der Heijden T, Moreno-Herrero F, Spakowitz A, Phillips R, Widom J, Dekker C, Nelson PC. High flexibility of DNA on short length scales probed by atomic force microscopy. Nat. Nanotechnol. 2006;1:137–141. doi: 10.1038/nnano.2006.63. [DOI] [PubMed] [Google Scholar]
- 28.Edelman LM, Cheong R, Kahn JD. Fluorescence resonance energy transfer over ∼130 basepairs in hyperstable Lac repressor-DNA loops. Biophys. J. 2003;84:1131–1145. doi: 10.1016/S0006-3495(03)74929-7. [DOI] [PMC free article] [PubMed] [Google Scholar]
- 29.Goyal S, Lillian T, Blumberg S, Meiners JC, Meyhofer E, Perkins NC. Intrinsic curvature of DNA influences LacR-mediated looping. Biophys. J. 2007;93:4342–4359. doi: 10.1529/biophysj.107.112268. [DOI] [PMC free article] [PubMed] [Google Scholar]
- 30.Lillian TD, Goyal S, Kahn JD, Meyhofer E, Perkins NC. Computational analysis of looping of a large family of highly bent DNA by LacI. Biophys. J. 2008;95:5832–5842. doi: 10.1529/biophysj.108.142471. [DOI] [PMC free article] [PubMed] [Google Scholar]
- 31.Kahn JD, Cheong R, Mehta RA, Edelman LM, Morgan MA. Flexibility and control of protein–DNA loops. Biophys. Rev. Lett. 2006;1:327–341. [Google Scholar]
- 32.Brenowitz M, Mandal N, Pickar A, Jamison E, Adhya S. DNA-binding properties of a Lac repressor mutant incapable of forming tetramers. J. Biol. Chem. 1991;266:1281–1288. [PubMed] [Google Scholar]
- 33.Wilson CJ, Das P, Clementi C, Matthews KS, Wittung-Stafshede P. The experimental folding landscape of monomeric Lactose repressor, a large two-domain protein, involves two kinetic intermediates. Proc. Natl Acad. Sci. USA. 2005;102:14563–14568. doi: 10.1073/pnas.0505808102. [DOI] [PMC free article] [PubMed] [Google Scholar]
- 34.Kahn JD, Crothers DM. Measurement of the DNA bend angle induced by the catabolite activator protein using Monte Carlo simulation of cyclization kinetics. J. Mol. Biol. 1998;276:287–309. doi: 10.1006/jmbi.1997.1515. [DOI] [PubMed] [Google Scholar]
- 35.Koo HS, Drak J, Rice JA, Crothers DM. Determination of the extent of DNA bending by an adenine–thymine tract. Biochemistry. 1990;29:4227–4234. doi: 10.1021/bi00469a027. [DOI] [PubMed] [Google Scholar]
- 36.Hieb AR, Halsey WA, Betterton MD, Perkins TT, Kugel JF, Goodrich JA. TFIIA changes the conformation of the DNA in TBP/TATA complexes and increases their kinetic stability. J. Mol. Biol. 2007;372:619–632. doi: 10.1016/j.jmb.2007.06.061. [DOI] [PubMed] [Google Scholar]
- 37.Bond LM, Peters JP, Becker NA, Kahn JD, Maher LJ., III Gene repression by minimal lac loops in vivo. Nucleic Acids Res. 2010;38:8072–8082. doi: 10.1093/nar/gkq755. [DOI] [PMC free article] [PubMed] [Google Scholar]
- 38.Mossing MC, Record MT., Jr Upstream operators enhance repression of the lac promoter. Science. 1986;233:889–892. doi: 10.1126/science.3090685. [DOI] [PubMed] [Google Scholar]
- 39.Kramer H, Niemoller M, Amouyal M, Revet B, von Wilcken-Bergmann B, Muller-Hill B. lac repressor forms loops with linear DNA carrying two suitably spaced lac operators. EMBO J. 1987;6:1481–1491. doi: 10.1002/j.1460-2075.1987.tb02390.x. [DOI] [PMC free article] [PubMed] [Google Scholar]
- 40.Oehler S, Amouyal M, Kolkhof P, von Wilcken-Bergmann B, Muller-Hill B. Quality and position of the three lac operators of E. coli define efficiency of repression. EMBO J. 1994;13:3348–3355. doi: 10.1002/j.1460-2075.1994.tb06637.x. [DOI] [PMC free article] [PubMed] [Google Scholar]
- 41.Balci H, Ha T, Sweeney HL, Selvin PR. Interhead distance measurements in myosin VI via SHRImP support a simplified hand-over-hand model. Biophys. J. 2005;89:413–417. doi: 10.1529/biophysj.105.060608. [DOI] [PMC free article] [PubMed] [Google Scholar]
- 42.Yildiz A, Selvin PR. Fluorescence imaging with one nanometer accuracy: application to molecular motors. Acc. Chem. Res. 2005;38:574–582. doi: 10.1021/ar040136s. [DOI] [PubMed] [Google Scholar]
- 43.Hirsh AD, Lillian TD, Lionberger TA, Perkins NC. DNA modeling reveals an extended lac repressor conformation in classic in vitro binding assays. Biophys. J. 2011;101:718–726. doi: 10.1016/j.bpj.2011.06.040. [DOI] [PMC free article] [PubMed] [Google Scholar]
- 44.Cloutier TE, Widom J. Spontaneous sharp bending of double-stranded DNA. Mol. Cell. 2004;14:355–362. doi: 10.1016/s1097-2765(04)00210-2. [DOI] [PubMed] [Google Scholar]
- 45.Wiggins PA, Phillips R, Nelson PC. Exact theory of kinkable elastic polymers. Phys. Rev. E. 2005;71:021909. doi: 10.1103/PhysRevE.71.021909. [DOI] [PMC free article] [PubMed] [Google Scholar]
- 46.Daber R, Sharp K, Lewis M. One is not enough. J. Mol. Biol. 2009;392:1133–1144. doi: 10.1016/j.jmb.2009.07.050. [DOI] [PMC free article] [PubMed] [Google Scholar]
- 47.Hoover TR, Santero E, Porter S, Kustu S. The integration host factor stimulates interaction of RNA polymerase with NIFA, the transcriptional activator for nitrogen fixation operons. Cell. 1990;63:11. doi: 10.1016/0092-8674(90)90284-l. [DOI] [PubMed] [Google Scholar]
- 48.Finkelstein IJ, Visnapuu ML, Greene EC. Single-molecule imaging reveals mechanisms of protein disruption by a DNA translocase. Nature. 2010;468:983–987. doi: 10.1038/nature09561. [DOI] [PMC free article] [PubMed] [Google Scholar]
- 49.Kouzine F, Sanford S, Elisha-Feil Z, Levens D. The functional response of upstream DNA to dynamic supercoiling in vivo. Nat. Struct. Mol. Biol. 2008;15:146–154. doi: 10.1038/nsmb.1372. [DOI] [PubMed] [Google Scholar]
Associated Data
This section collects any data citations, data availability statements, or supplementary materials included in this article.