

Abstract
The human serine protease inhibitor (serpin) α-1 antitrypsin (α1-AT) protects tissues from proteases of inflammatory cells. The most common disease-causing mutation in α1-AT is the Z-mutation (E342K) that results in an increased propensity of α1-AT to polymerize in the ER of hepatocytes, leading to a lack of secretion into the circulation. The structural consequences of this mutation, however, remain elusive. We report a comparative molecular dynamics investigation of the native states of wild-type and Z α1-AT, revealing a striking contrast between their structures and dynamics in the breach region at the top of β-sheet A, which is closed in the wild-type simulations but open in the Z form. Our findings are consistent with experimental observations, notably the increased solvent exposure of buried residues in the breach region in Z, as well as polymerization via domain swapping, whereby the reactive center loop is rapidly inserted into an open A-sheet before proper folding of the C-terminal β-strands, allowing C-terminal domain swapping with a neighboring molecule. Taken together, our experimental and simulation data imply that mutations at residue 342 that either stabilize an open form of the top of β-sheet A or increase the local flexibility in this region, may favor polymerization and hence aggregation.
Introduction
Alpha 1-antitrypsin (α1-AT) belongs to the serine protease inhibitor superfamily. The native fold of α1-AT is composed of nine α-helices and three β-sheets and an extended reactive center loop (RCL) (Fig. 1 A) (1). The native serpin fold is a kinetically trapped metastable conformation that uses the extended RCL as bait for serine proteases. Upon protease binding the RCL is cleaved and the serpin undergoes a major irreversible structural rearrangement, where the cleaved RCL is inserted between strands 3 and 5 of the A β-sheet (2). As a result, the active site of the bound protease is critically distorted, leaving it inactive and trapped (2). Although this mechanism allows a high degree of regulation of serpin activity, it renders members of this superfamily vulnerable to misfolding and aggregation (3).
Figure 1.
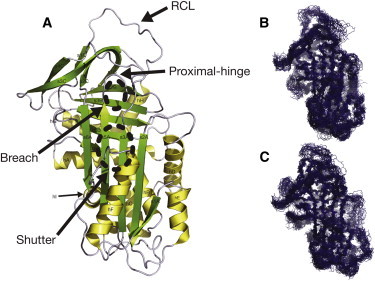
α1-AT structure and representative overviews of the dynamics of different simulated systems. (A) The crystal structure of wild-type α1-AT (PDB 1QLP (1)) indicating the nomenclature of the helices and strands. The positions of the breach, shutter, proximal-hinge, and RCL are indicated. (B and C) Superposition of 30 structures sampled every 10 ns from a 300-ns simulation of wild-type and E342K mutated α1-AT, respectively.
α1-AT is synthesized mainly by hepatocytes (4) and protects lungs cells from excessive elastase activity (5). Several disease-causing mutations of α1-AT have been identified, the most common of them being the Z-variant (E342K) located at the breach region, at the top of the A β-sheet (6) (Fig. 1 A). The Z-variant has an increased propensity to polymerize in the endoplasmic reticulum of hepatocytes leading to cell death and liver damage (6). In addition, α1-AT aggregation causes a reduction in the overall inhibitory capabilities of the plasma that results in unhindered elastase activity and subsequently emphysema (7). Importantly, ∼15% of Z α1-AT does fold correctly and is secreted from the hepatocytes. This Z α1-AT, unlike the WT form, polymerizes under physiological conditions and pathological Z α1-AT polymers have been detected in circulation (8) and in the lung (9). Understanding the molecular mechanisms of serpin polymerization has been an intensely active area of investigation over the past 15 years. Studies have shown that α1-AT polymerization can form a heterogeneous mixture of polymers (10), is temperature-dependent (6), pH-dependent (11), and concentration-dependent (12), and can be blocked by RCL homologous peptides (6,12,13) as well as citrate ions (14). Although the structure of Z α1-AT and its associated polymer are not known, recent structural and biochemical data suggest that polymerization occurs via a domain-swapping event (6,15).
Unfortunately, the structural mechanism by which the mutation E342K facilitates α1-AT polymerization remains unknown. One possible mechanism is that the stability of the already folded protein is lost, leading to a conformational change that results in a polymerogenic species (11,16,17). However, it was shown that although Z α1-AT polymerized faster than wild-type α1-AT, it is as thermodynamically stable as the wild-type (19). Observations that in vivo polymerization of α1-AT occurs mainly in the ER suggest that folding-intermediates, not the native state, play the dominant role in polymerization. Due to the intrinsic short lifespan of the species involved in folding and polymerization, experimental methods such as crystallography are limited. Therefore, theoretical methods such as molecular dynamics (MD) are necessary to understand, at an atomic level, the conformational differences between wild-type α1-AT and the Z-variant. In this article, we use MD simulations and fluorescence spectroscopy to investigate the structural and dynamical differences among wild-type, E342K, E342Q, and E342R mutated α1-AT.
Materials and Methods
System setup
Six systems were simulated: wild-type, E342K, E342Q, E342R, and K290E/E342K mutated α1-AT in solution, and wild-type α1-AT in a crystalline-like environment. The atomic coordinates of wild-type α1-AT were taken from the crystal structure of Elliott et al. (PDB:1QLP (1)). E342K, E342R, E342Q, and K290E/E342K mutated α1-AT atomic coordinates were achieved by in silico mutation of wild-type using PyMOL version 1.3r2 (20). Two models of E342K were built, differing in K342 side chain conformation: E342K_conf1 in which the K342 side chain is pointing toward T203, and E342K_conf2 in which the side chain points directly to solvent. Ionizable residues were in their standard protonation states at pH 7.
Each system was first put into a suitably sized box, of which the minimal distance from the protein to the box wall was 1.4 nm, except in the case of wild-type α1-AT in a crystalline-like environment where no minimal distance was used. This was done to mimic the crystal lattice interactions of 1QLP. Each box was then subjected to energy-minimization before commencing dynamics. To avoid unnecessary distortion of the protein when the molecular dynamics simulation is started, a gradual positional-restraints procedure was used. Three consecutive equilibration runs in which all heavy protein atoms are restrained to their starting positions (using a force constant of 1000, 100, and 10 kJ mol−1 nm−2 respectively) while the water is relaxing around the structure. Each system was then subjected to free simulation with configurations stored every 100 ps for analysis.
Simulation parameters
All simulations were performed using the GROMACS package Ver. 4.0.7 (21) in conjunction with the GROMOS 53A6 united-atom force field (22). Water was represented explicitly using the simple-point-charge model (23). Each system was simulated under periodic conditions in a cubical box. Simulation conditions were roughly the same as described in Oostenbrink et al. (22). Briefly, the temperature of the simulation systems in solution was maintained by independently coupling the protein and the solvent to an external temperature bath at 298 Kelvin (K) with a coupling constant of τT = 0.1ps using a Berendsen thermostat (24). The pressure was maintained at 1 bar by weakly coupling the system to an isotropic pressure bath (24), using an isothermal compressibility of 4.6 × 10⁻⁵ bar−1 and a coupling constant of τP = 1 ps. During the simulations, the length of all bonds within the protein was constrained using the LINCS algorithm (25). The time step for integrating the equations of motion was 2 fs. Nonbonded interactions were evaluated using a twin-range cut-off scheme: interactions falling within the 0.8-nm short-range cutoff were calculated every step whereas interactions within the 1.4-nm long cutoff were updated every three steps, together with the pair list. A reaction-field correction was applied to the electrostatic interactions beyond the long-range cutoff (26), using a relative dielectric permittivity constant of ɛRF = 62 as appropriate for simple-point-charge water (27). Wild-type α1-AT and mutants were simulated three times independently, each system starting with a different distribution of initial velocities.
Simulations of wild-type α1-AT under conditions mimicking the crystalline environment were performed at 100 K, i.e., the temperature of x-ray data collection for PDB:1QLP, and under constant pressure. The temperature of the system was maintained by independently coupling the protein and the solvent to an external temperature bath at 100 K with a coupling constant of τT = 0.1ps using a Berendsen thermostat (24). Long-range electrostatics were calculated using the particle-mesh Ewald (28), with a 1.4-nm cutoff for the direct space calculation. These conditions, although different to those used for parameterizing the force field, were used to mimic the conditions under which x-ray data were collected. Specifically, we used particle-mesh Ewald for the calculation of electrostatic interactions, as this is known to induce order in small simulation boxes (29,30).
Root mean-square deviation
The position deviations of each Cα atom with respect to its initial structure (as described in System Setup, above) were calculated every 100 ps, after performing a least-squares fit to its initial structure.
H-bonds
H-bonds were calculated as a function of time. Two atoms are being defined as having an H-bond if the distance between the donor and the acceptor atoms is ≤0.35 nm and the acceptor-donor-hydrogen angle is <30°.
Electrostatic surface potential calculations
The electrostatic potentials of models were calculated using APBS Ver. 1.3 (31). Atom parameters for the calculation were taken from the GROMOS 53A6 force field (22). Electrostatic potential was visualized using the PyMOL Ver. 1.3r2 (20) with positive potential in blue and negative potential in red in a range between −1 and +1 kBT/ec, where kb is the Boltzmann constant, T is the temperature (set to 298°K), and ec is electron charge.
Materials
4,4′-Dianilino-1,1′-binaphthyl-5,5′-disulfonic acid, dipotassium salt (bis-ANS) was purchased from Invitrogen (Carlsbad, CA).
Production of recombinant α1-AT mutants
The α1-AT mutants were generated using the pHILD2 vector (Invitrogen) carrying the α1-AT gene as a template (32). To introduce the single amino-acid substitution, the E342 residue was mutated with KOD DNA polymerase (Novagen, Madison, WI) using the Quik-Change site-directed mutagenesis approach (Stratagene, La Jolla, CA) and all mutations were verified with DNA sequencing. The α1-AT variants generated were electroporated into Pichia pastoris and expressed and purified as described previously in Levina et al. (32).
Characterization of inhibitory properties
The stoichiometry of inhibition (SI) of the α1-AT variants against bovine chymotrypsin was determined as described previously in Levina et al. (32).
Spectroscopic methods
All spectra were recorded at room temperature on a FluoroMax-4 spectrofluorometer (HORIBA Jobin-Yvon, Edison, NJ) in a 1-cm path-length quartz cell. For tryptophan emission, spectra samples were excited at 295 nm and spectra were collected from 300 to 500 nm (increment 0.5 nm). Excitation and emission slit widths were set at 5 nm and the integration time at 0.1 s. The protein concentration was 2 μM in 50 mM Tris and 90 mM NaCl, pH 8.0. The absorbance at the excitation wavelength remained below 0.05. For bis-ANS emission spectra, samples were excited at 390 nm and spectra were collected from 400 to 600 nm (increment 0.5 nm). Excitation and emission slit widths were set at 3 nm and the integration time at 0.1 s. The protein concentration was 1 μM and the bis-ANS concentration 5 μM in 50 mM Tris and 90 mM NaCl, pH 8.0.
Determination of the rate of polymerization
The rate of polymerization was determined by native polyacrylamide gel electrophoresis (PAGE). Samples of protein (10 μM) were incubated at 42°C in 90 mM NaCl and 50 mM Tris, 1 mM EDTA, and 5 mM β-mercaptoethanol at pH 8.0 and put on ice at various time-points to quench the reaction. Ice-cold nondenaturing sample buffer was added and samples were analyzed using 10% nondenaturing polyacrylamide gel electrophoresis. The rate of polymerization was determined by following the loss of monomer using an exponential decay function.
Results
Wild-type and Z α1-AT are stable throughout simulations
Molecular simulations of both wild-type and modeled E342K α1-AT were performed. The wild-type α1-AT simulation started from the crystal structure of α1-AT in the native state (PDB:1QLP), whereas the simulation of Z started from the E342K mutation modeled into the wild-type α1-AT 1QLP coordinates, in two conformations (see below). For each system, three independent simulations of 300 ns were performed. In all cases, the majority of secondary structure, including helices hA and hB, β-sheets A and most of B (except s1B), remained stable throughout the simulation (Fig. 1, B and C; and see Movie S1 and Movie S2 in the Supporting Material). In contrast, hF, the top of hD as well as the RCL, all showed a high degree of flexibility, consistent with high crystallographic B factors (1) and susceptibility to H/D exchange (33).
Calculated root mean-square deviations (RMSDs) (see Fig. S1 in the Supporting Material) indicate system equilibration times ranging from 25 to 40 ns, with the shifts in Cα values reaching a plateau within the productive stages of the simulations (typically after 50 ns of simulations); the average Cα RMSDs were found to stabilize at 0.37 ± 0.02 nm for wild-type α1-AT, and at 0.43 ± 0.04 nm and 0.41 ± 0.04 nm for E342K-mutated α1-AT starting conformations 1 and 2, respectively. The RMSD values and inspection of snapshots, suggests that despite small shifts, both wild-type and the Z α1-AT are stable during simulations, and that the E342K mutation does not affect the overall stability, conformation, and dynamics (Fig. 1, B and C). The RCL in wild-type and Z α1-AT shows a high degree of movement during simulations (Fig. 2). This is consistent with RCL conformational diversity and high mobility observed in crystallographic structures (1,34,35).
Figure 2.
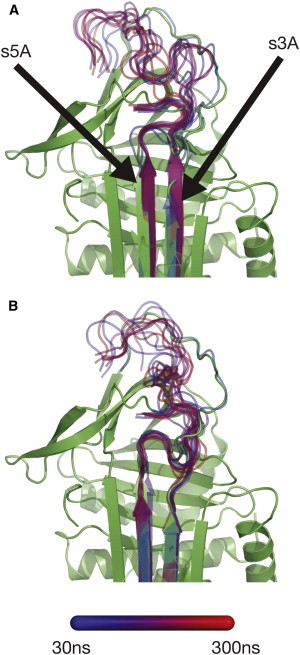
Representative structure of β-sheet A and proximal-hinge of (A) wild-type and (B) E342K mutated α1-AT. Superposition of snapshots taken every 30 ns from 300-ns simulations aligned to the crystal structure of wild-type α1-AT (green, PDB 1QLP (1)), shown as a cartoon representation. For clarity, only s3A, s5A, and the RCL of the snapshots are shown, superposed on the crystal structure. The color coding is indicated in the legend, as a gradient going from early (blue) to late (red), except for the initial structure (green).
The starting conformation of K342 does not affect the dynamics of E342K mutated α1-AT
Two different starting side chain conformations of K342 were modeled to prevent sampling bias from the starting configuration (see Fig. S3). In E342Kconf1, the side chain of K342 forms an H-bond with the side chain of T203 and the backbone carbonyl of V200. In contrast, in E342Kconf2, the side chain of K342 was modeled to extend out toward solvent, having no H-bond interactions with the protein. Nevertheless, after <5 ns of simulation, the conformation of K342 in E342Kconf2 shifts toward that in E342Kconf1 (where K342 forms stable H-bonds with T203 and V200; see Fig. S3). Due to the conformational convergence of E342Kconf1 and E342Kconf2, both systems share a high degree of similarity in structure and dynamics throughout simulations.
The top of β-sheet A zips up in wild-type α1-AT but not in the Z variant
Comparison of the structure at the top of β-sheet A for both wild-type α1-AT and the Z variant during simulations reveals that wild-type and Z α1-AT differ strikingly in the number and length of H-bonds between s3A and s5A, the expulsion of the proximal-hinge from the top of β-sheet A, and the conformation of the RCL (Figs. 2 and 3). In the early stages (20–40 ns) of the wild-type simulations the proximal-hinge (residues 342–347 of the RCL;P17-P12) is expelled from the top of β-sheet A, followed by a zipping-up of β-strands s3A and s5A at the top of β-sheet A, which occurs between 30 and 50 ns (Figs. 2 A and 3 B). As such, two new H-bonds are formed, between the backbone atoms of T339 to G192 and G192 to D341 (Fig. 3 B; and see Table S2 in the Supporting Material).
Figure 3.
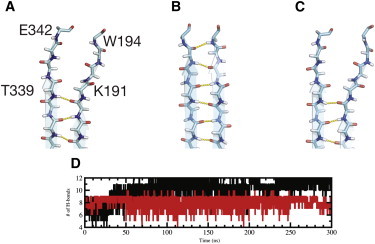
Interstrand H-bonds between strands s3A and s5A during simulations. Interstrand H-bonds between strands s3A and s5A of (A) crystal structure, and representative time-averaged structure (over the last 50 ns of simulation) of (B) wild-type and (C) E342K-mutated α1-AT. Differences in H-bond patterns can be seen, as wild-type α1-AT has H-bond interactions between T339 → G192, G192 → D341, and D341 → W194 that are formed during simulations. (D) Number of H-bonds between s3A and s5A main-chain atoms as a function of simulation time for wild-type and E342K-mutated α1-AT (black and red, respectively). The average number of H-bonds for the last 200 ns of the simulations between s3A and s5A is 10 ± 1 and 8 ± 1 for wild-type and E342K mutated α1-AT, respectively.
In contrast, the conformation of the proximal-hinge region in Z α1-AT is found to be stable throughout simulation, with no structural change observed at the top of β-sheet A (Figs. 2 B and 3 C). Thus, whereas during the simulation of wild-type α1-AT the top of β-sheet A zips up, it remains partially open during the simulation of Z α1-AT.
The breach region is partially solvent-exposed in Z but not in wild-type α1-AT
The breach region, the area at the top of β-sheet A where the RCL first inserts after cleavage by the protease, contains several highly conserved residues, in particular W194 that is present in >95% of all serpins (36). We observed differences in the solvent exposure of W194 side chain during wild-type and Z α1-AT simulations (see Fig. S4). As a result of opening the top of the A-sheet, the solvent-exposed surface area of W194 during the last 100 ns of the simulations was found to be 0.44 ± 0.15 nm2 and 0.78 ± 0.18 nm2 for wild-type and Z α1-AT, respectively. In contrast, the solvent exposure of W238, which is situated on β-sheet B, is similar for both proteins (1.21 ± 0.18 nm2 and 1.20 ± 0.20 nm2, respectively). In the crystal structure of wild-type α1-AT, the side chain of W194 forms a H-bond with the backbone carbonyl of D341, but closure of the top of sheet-A in the breach region early in the simulation of wild-type α1-AT results in the loss of this interaction, with the W194 backbone amine forming a H-bond with the carbonyl of D341 (see Table S1 and Fig. 4 A). In contrast, in Z α1-AT, the H-bond between D341° to W194Nɛ1 is maintained during the productive stage of simulations (Fig. 4 B). These observations are consistent with recent experimental data that indicate conformational differences at the top of β-sheet A between wild-type and Z α1-AT, in addition to increased solvent exposure and polarity of surroundings for W194 in Z compared to wild-type α1-AT (37).
Figure 4.
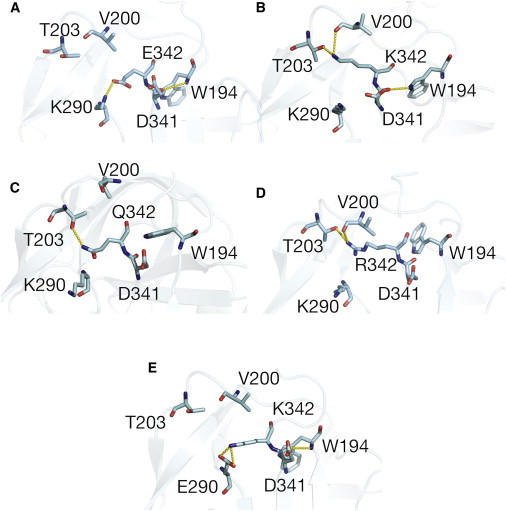
Representative conformations of residue 342 of (A) wild-type, (B) E342K, (C) E342Q, (D) E342R, and (E) K290E/E342K-mutated α1-AT. Structures are time-averaged over the last 50 ns of the simulation. Whereas residues E342 and Q342 (A and C) formed a salt-bridge with K290, K342 and R342 formed H-bonds with T203 and V200 (B and D). In addition, a salt-bridge between D341 and W194 is found in E342K-mutated α1-AT but not in the wild-type protein.
Electrostatic interactions of K342 favor a partially open conformation at the top of β-sheet A in Z α1-AT
In simulations of wild-type α1-AT, E342 maintains a conformation similar to that seen in the crystal structure—being stabilized by a salt-bridge with K290NZ, which is also present in the crystal structure (Fig. 4 A). The H-bond between E342 and T203, present in the crystal structure, is not maintained during the simulations. In contrast, in simulations of Z α1-AT K342 that is electrostatically repelled by the positive potential of this region, particularly K290 (Fig. S5 B), adopts a different conformation in which its side chain forms H-bonds with the backbone of T203 and V200. As a result, the difference in conformations between Glu and Lys at position 342 contribute to the dynamic and structural differences at the top of β-sheet A. Specifically, the conformation of K342 is dictated by the surrounding electropositive potential and stabilized by H-bonds to T203 and V200, thus preventing the expulsion of the RCL hinge-region from the top of β-sheet A. In contrast, in the wild-type structure, E342 can adopt a conformation that allows the expulsion of the proximal-hinge and the closure of the top of β-sheet A.
Stereochemical and physicochemical properties of residues at position 342 dictate the conformation at the top of β-sheet A in α1-AT
To investigate the role of electrostatics, polarity, and the physicochemical nature of residue 342, we performed MD studies of both E342Q and E342R mutations modeled into α1-AT. These mutations were deemed the most stereochemically conservative substitutions while allowing us to alter the chemical properties of the side chain. Both mutations introduce a positive electrostatic potential similar to that in the E342K Z-variant (see Fig. S5, C and D) and thus their proximity to K290 is energetically unfavorable. Both E342Q and E342R were found to be stable during simulations, with average Cα RMSDs of 0.39 ± 0.02 nm and 0.37 ± 0.02 nm, respectively, after 50 ns of simulation (see Fig. S1). However, in contrast to Z α1-AT we found that E342Q and E342R adopt two distinct conformations throughout simulations. Initially, the proximal-hinge of both proteins is expelled after 40–60 ns of simulation (see Fig. S6, A and B) and the top of β-sheet A in both cases closes (see Fig. S2 and Table S2). Thus, although the side chains of Arg and Gln at position 342 adopt a conformation similar to that of K342, they allow the expulsion of the proximal-hinge and the closure of the top of β-sheet A. However, during simulations both E342Q (150–170 ns) and E342R (180–200 ns) undergo a local conformational change, resulting in a small degree of opening of the top of β-sheet A (see Fig. S2 and Table S2). This conformation is stabilized by H-bond interactions between the side chains of Q342 and R342 to T203Nγ and V200°, as seen in E342K (Fig. 4, D and E; and see Movie S3 and Movie S4).
As a result of this slight opening of the top of the A-sheet, the solvent-exposed surface area of W194 during the last 100 ns of simulations was found to be 0.66 ± 0.17 nm2 and 0.61 ± 0.17 nm2 for E342Q and E342R α1-AT, respectively. In contrast, the solvent exposure of W238 is similar to that of WT α1-AT and the Z-variant (1.19 ± 0.18 nm2 and 1.22 ± 0.20 nm2, respectively). Thus, simulations show that both E342Q and E342R can adopt open and closed conformations at the top of β-sheet A. The transition between conformations, seen in E342Q and E342R simulations, but not for Z α1-AT, is likely due to differences in the properties of Arg and Gln side chains. Although the side chains of Arg and Lys are similar, the Arg side chain harbors a bulky guanidinium moiety that may slow the rate of its structural rearrangement, allowing for some plasticity at the top of β-sheet A (see Movie S3). In contrast, the side chain of Gln is shorter compared to that of Lys, having an amide instead of an amino group. As a result, throughout simulations its side chain adopts two conformations—one in which it is close to K290 and another in which it is close to T203 (Fig. 4 C; and see Movie S4).
Taken together, these observations imply that removing the negative charge at position 342 (E342Q) or even replacing it with a positive one (E342R) does affect the final conformation of β-sheet A. However, whereas E342R forms stable interactions with T203 and V200, in a similar manner to E342K, E342Q does not. Rather, it seems to alternate between a conformation in which its side chain is near K290 and a conformation in which it interacts with V200.
The Z reversal mutation K290E/E342K reveals wild-type-like dynamics
The K290E mutation was shown to rescue the Z-variant of α1-AT, maintaining a wild-type-like secretion level from cells (38). Because our simulations indicate that electrostatic and H-bond interactions play an important role in the conformation and dynamics at the top of β-sheet A, we were interested to see whether MD could provide insight into how a second mutation can repair the deleterious effects of the Z mutation. We therefore modeled the double-mutant K290E/E342K and performed MD simulation. K290E/E342K was found to be stable during simulations, with average Cα RMSDs of 0.42 ± 0.02 nm after 50 ns of simulations (see Fig. S1). During simulations, K342 maintained a salt-bridge with E290, as seen in wild-type simulations (Fig. 4 E). As a result, the double mutant is dynamically similar to wild-type α1-AT (see Fig. S6 C and Movie S5), with its proximal-hinge being expelled after 20–40 ns of simulation. Unlike the Z variant, no H-bonds are seen between K290 and T203 or V200. These results indicate that the rescue mutation K290E restores a salt-bridge between position 290 and 342 of α1-AT, allowing the top of β-sheet A to zip up, as seen in the wild-type simulations. As a result of the closed conformation at the top of the A-sheet, the solvent-exposed surface area of W194 during the last 100 ns of simulations was found to be 0.50 ± 0.10 nm2, in contrast to 1.21 ± 0.19 nm2 for W238.
Effect of crystal packing on the conformation of the RCL and the top of β-sheet A
The effect of crystal packing on protein structure has been studied widely by comparing identical molecules crystallized in different forms (39–44). In general, it was observed that whereas more loosely organized segments of secondary structure might be affected, the main protein core is largely invariant. However, in a few cases such as T4 lysozyme, large structural changes have been reported (39). The temperature at which an experiment is performed can also affect the structure. A recent comparison of crystal structures determined at room temperature and 100 K (45) indicate that cryo-cooling can affect the energy-landscape of molecules, resulting in smaller, overpacked models. In addition, cryo-cooling significantly reduces or even eliminates motions important for protein function. We were therefore interested in whether crystal packing or temperature were related to the conformational changes we observed in our simulations.
We ran MD simulations of wild-type α1-AT in a crystalline-like environment at 100 K, simulating the crystal packing forces and the cryogenic temperatures of 1QLP. In contrast to the simulations of wild-type α1-AT in solution, wild-type α1-AT under crystal conditions displays significantly less flexibility (see Fig. S6 D). This is particularly apparent in the RCL, s4C-s3C turn, hD-s2A turn, and hF, all of which are in crystal packing regions (see Fig. S7). This is consistent with experimental hydrogen exchange data that show that the flexibility of hD and hF higher in solution than that predicted based on the crystal structure (33).
Interestingly, in the crystalline simulation the proximal hinge is not expelled from the top of β-sheet A, as seen in the simulations in solution. This suggests that the proximal hinge conformation observed in the crystal structure of 1QLP is stabilized by crystal packing and probably also related to the cryogenic temperature of data collection. In addition, it provides an explanation for the structural changes in this region observed early in the simulation of wild-type α1-AT.
The stoichiometry of inhibition of both E342Q and E342R mutated α1-AT is higher than that of wild-type α1-AT
Wild-type, Z variant (E342K), E342Q-, and E342R-mutated α1-AT were expressed in P. pastoris and purified as described previously (32). The stoichiometry of inhibition (SI) of each α1-AT variant was determined against bovine chymotrypsin (Table 1). All α1-AT variants were functional inhibitors of this proteinase, however, all mutants had elevated SI values compared to the wild-type. It has previously been shown that the Z mutation results in an increased substrate behavior with ∼40% following the substrate pathway (32,46,47). Our data suggest that both E342Q and E342R mutations have a similar effect on α1-AT, increasing the SI from 1.0 ± 0.1 for wild-type α1-AT to 1.4 ± 0.1 and 1.7 ± 0.1, respectively. This indicates that mutations at position 342 decrease the rate of RCL insertion into the A-sheet after proteinase docking to α1-AT, thereby leading to an increase in substrate behavior. Both the Z variant (SI = 1.8 ± 0.3) and E342R mutated α1-AT result in elevated SI values compared to E342Q mutated α1-AT. This suggests that whereas the loss of salt-bridge interactions with K290 impairs the inhibitory process, a positively charged amino acid at position 342 imposes greater effects.
Table 1.
Stoichiometry of inhibition (SI) and polymerization properties of wild-type α1-AT and mutants
| α1-AT variant | SI | kagg (h−1) |
|---|---|---|
| wt | 1.0 ± 0.1 | — |
| E342K | 1.8 ± 0.3 | 4.8 ± 0.3 × 10⁻² |
| E342Q | 1.4 ± 0.1 | 2.3 ± 0.2 × 10⁻² |
| E342R | 1.7 ± 0.1 | 4.3 ± 0.3 × 10⁻² |
Fluorescence analysis of E342Q and E342R mutated α1-AT
To determine the effect of the E342Q and E342R mutations on the structural integrity of α1-AT, intrinsic and extrinsic fluorescence emission scans were performed. Previous work on Z-mutated α1-AT has shown that the molecule is characterized by an increase in tryptophan fluorescence emission intensity and a small red shift in the wavelength of maximum fluorescence intensity (λmax) in comparison to the wild-type (19). Additional work utilizing single tryptophan mutants could then attribute these spectral differences to a conformational change around W194 caused by the E342K mutation (37). Our data indicate that both the E342Q and E342R mutations analyzed in this study led to an increase in the tryptophan emission intensity in comparison to wild-type α1-AT (Fig. 5 A). The data indicate that the local environment of W194 in both mutants differs from that of wild-type α1-AT. A red shift of λmax was, however, only observed if residue 342 was mutated to a positively charged residue. Taken together, the data indicate that in both E342Q and E342R mutated α1-AT, W194 is more solvent-exposed compared to wild-type α1-AT. This is consistent with our simulation data, which show some plasticity at the top of the A-sheet.
Figure 5.
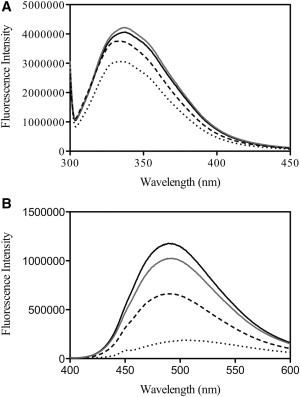
Fluorescence emission spectra of wild-type and mutated α1-AT. (A) Tryptophan emission spectra (λex = 295 nm) of wild-type (dotted line), E342K (solid line), E342Q (dashed line), and E342R (shaded line) mutated α1-AT. (B) bis-ANS emission spectra (λex = 390 nm) in the presence of wild-type (dotted line), E342K (solid line), E342Q (dashed line), and E342R (shaded line) -mutated α1-AT.
To obtain information on the hydrophobicity of the α1-AT variants, the fluorescent probe bis-ANS was used (Fig. 5 B). It has previously been shown that Z α1-AT is characterized by an increased exposure of hydrophobic regions, resulting in an increase in bis-ANS fluorescence emission intensity (19). Our data suggest that both E342Q and E342R mutations lead to an increase in bis-ANS fluorescence emission intensity in comparison to wild-type α1-AT. Similar to the tryptophan emission scans, the bis-ANS emission scans suggest slight differences between the E342Q variants and the E342R and the Z α1-AT variants, with the highest bis-ANS fluorescence intensity observed in the presence of the latter two.
Both E342Q and E342R mutated α1-AT polymerize faster than wild-type α1-AT
The effect of the E342K, E342Q, and E342R mutations on the rate of α1-AT polymerization was determined at physiological temperatures. Protein samples were incubated at 42°C and the loss of monomeric protein was followed by native PAGE (Fig. 6 A). The rate of polymerization as a function of monomer loss (kagg) was determined using an exponential decay function (Fig. 6 B; Table 1). Whereas wild-type α1-AT did not polymerize to a significant extent under those conditions, all of the variants did. Differences in kagg were observed between the mutants, with Z α1-AT (kagg = 4.8 ± 0.3 × 10⁻² h−1) and the E342R (kagg = 4.3 ± 0.3 × 10⁻² h−1) variant polymerizing at approximately double the rate of the E342Q (2.3 ± 0.2 × 10⁻² h−1) variant. This suggests that it is not solely the loss of the salt-bridge that results in the increased polymerization propensity of Z variant α1-AT but also the positive charge at position 342. This is in good agreement with previous work that determined the levels of α1-AT secretion upon mutation of residue 342 in a mammalian cell system (48). This study suggests that the E342Q mutation results in secretion levels of 55% of normal and the E342K in 17% of normal.
Figure 6.
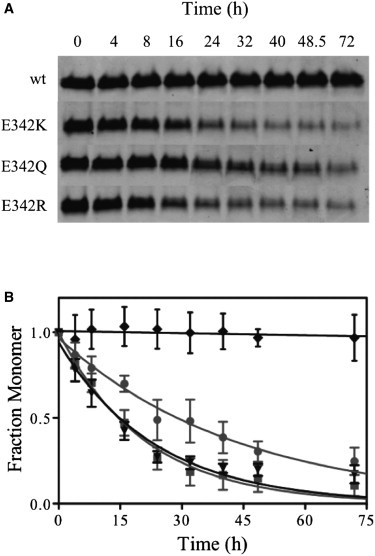
Polymerization properties of wild-type and mutated α1-AT. (A) Protein samples (10 μM) were incubated at 42°C for the time spans indicated and then stored on ice until subjected to native PAGE analysis. (B) The rate of polymerization of wild-type (dash-diamond-dash), E342K (dash-box-dash), E342Q (dash-circle-dash), and E342R (dash-down arrow-dash) -mutated α1-AT was determined as a function of monomer loss using the equation for exponential decay (lines).
Discussion
Z α1-AT is the most common pathological variant of α1-AT (49,50), and differs from the wild-type by only one residue (E342K) located in the breach region. The breach region is important for controlling the conformational change that occurs during protease inhibition (11,16,17), and is thus characterized by a high degree of sequence conservation across the serpin superfamily (36). As such, it is likely that the hydrogen-bond network in this area is particularly important for the inhibitory process (16). Because E342 is located at the top of s5A and the base of the RCL, it is one of these highly conserved residues, forming a salt-bridge to K290 and a H-bond to T203 (16,33). Mutation to K at this position is thus predicted to have significant structural consequences that lie at the cause of the pathological phenotype of Z α1AT.
However, the nature of the structural response to the Z mutation and hence the precise mechanism by which it promotes α1-AT polymerization is unclear (15,16). To investigate the effect of the Z mutation on the structure and dynamics of α1-AT, particularly within the breach region at the top of β-sheet A, we have performed a comparison between the dynamics and structure of wild-type and Z α1-AT using long MD simulations. In a previous theoretical study, done by Jezierski and Pasenkiewicz-Gierula (51), the native fold of both wild-type and E342K mutated α1-AT was modeled, followed by a short simulated annealing protocol. Based on the models, the authors conclude that the mutation introduces an overall instability into the protein. Our study is distinguished from the previous work because our simulations are based on the experimentally determined crystal structure of α1-AT, are significantly longer in timescale (allowing equilibrium to be reached), and include several mutations at position 342, allowing us to explore the role of stereochemistry and physicochemistry at this important location in the protein. Importantly, we also use fluorescence spectroscopy to characterize the properties of variants with mutations at this position.
The simulation data indicate that, in contrast to wild-type α1-AT the presence of the mutation E342K causes the top of β-sheet A to remain in a partially open configuration. Whereas in wild-type α1-AT the proximal-hinge of the RCL is expelled from the top of β-sheet A, the proximal-hinge of E342K α1-AT is partially inserted into the top of β-sheet A. Our findings are consistent with the recent characterization of Z α1-AT using intrinsic fluorescence spectroscopy that showed that W194, a residue in the breach region, is buried in wild-type α1-AT but has increased solvent exposure in the Z form (46).
These observations suggest that the Z mutation induces a conformational change in the region around W194 that leads to W194 being situated in a more polar environment. Further, unfolding data suggest that the Z mutation leads to the disruption of the structural integrity of β-sheet A but does not decrease its thermodynamic stability (19). This is consistent with the net maintenance of hydrogen bonds in Z compared to wild-type α1-AT that we observe during our simulations. Although wild-type α1-AT has two more H-bonds compared with Z α1-AT (at the top of β-sheet A) as well as a salt-bridge between K290 and E342, the Z-form compensates by forming three new H-bonds between V200, T203 to K342, and between D341 and the side chain of T194. This indicates that despite structural differences between wild-type α1-AT and the Z-form, both proteins have a similar number of H-bonds and salt-bridges, and as a result have similar thermodynamic stabilities, consistent with recent fluorescence spectroscopy studies (19,37).
Recently a mechanism for polymerization via domain swapping was proposed based upon crystallographic and biophysical studies, whereby the RCL is rapidly inserted into a conformationally open/labile β-sheet A before proper folding of the C-terminal β-strands, allowing C-terminal domain swapping with a neighboring molecule (15). Our key observation that the Z mutation stabilizes an open conformation at the top of β-sheet A, might indicate that this may also be a structural feature of folding intermediates, thus favoring polymerization.
Our fluorescence and polymerization data for E342Q and E342R mutated α1-AT, show clearly that they behave in a similar fashion to the Z variant. However, our MD results for these mutants predict that their characteristics should be more similar to those of the wild-type protein. Close inspection of the MD trajectories reveals that while the top of the A-sheet does zip up to a large degree in both mutants, unlike the wild-type some plasticity is present, with some side-chain flexibility at position 342. This structural heterogeneity may be sufficient to allow rapid insertion of the RCL into a conformationally open β-sheet A, resulting in polymerization. Taken together, our simulation and experimental results imply that mutations at residue 342 that either stabilize an open form of the top of β-sheet A (E342K) or increase the local flexibility in this region (E342Q and E342R), favor polymerization (Fig. 6).
Our simulations of α1-AT in a crystal-like environment indicate that crystal packing forces, in addition to cryogenic temperatures, may influence the specific conformation of various regions, and suggest that the structure of native wild-type α1-AT in solution may differ from that seen for the crystal form (at least in the case of 1QLP). Simulation in solution indicates that some structural reorganization may occur, specifically zipping up of the top of β-sheet A. These finding are in agreement with biophysical data for wild-type α1-AT in solution that suggest that the protein populates more closed conformations in solution (12,19,46). One explanation for this behavior is that the wild-type protein samples a range of conformations in the breach region, perhaps partitioning between the open and closed forms of β-strands s3A and s5A at the top of β-sheet A, and the crystal lattice stabilizes the open form due to the partial insertion of the RCL and the resulting conformation of the RCL that are favorable for crystal packing. Indeed, inspection of the crystal lattice environment in wild-type α1-AT (1QLP) reveals lattice contacts involving s3C-loop-s4c and the RCL that may serve to stabilize this RCL conformation (Fig. S7).
Conclusions
Our investigations identify specific interactions in the breach region of the Z-variant of α1-AT that may play a role in its greater propensity to misfold, aggregate, and thus cause disease, and are consistent with biophysical and structural data that highlight the importance of this region in serpin folding and polymerization.
Acknowledgments
We thank the Monash eResearch center and the Victorian Life Sciences Computation Initiative for computational resources and assistance.
This work was supported by grants from the National Health and Medical Research Council (NHMRC) and the Australian Research Council. A.M.B. and S.P.B. were supported by an NHMRC senior research fellowship.
Supporting Material
References
- 1.Elliott P.R., Pei X.Y., Lomas D.A. Topography of a 2.0 Å structure of α1-antitrypsin reveals targets for rational drug design to prevent conformational disease. Protein Sci. 2000;9:1274–1281. doi: 10.1110/ps.9.7.1274. [DOI] [PMC free article] [PubMed] [Google Scholar]
- 2.Huntington J.A., Read R.J., Carrell R.W. Structure of a serpin-protease complex shows inhibition by deformation. Nature. 2000;407:923–926. doi: 10.1038/35038119. [DOI] [PubMed] [Google Scholar]
- 3.Cabrita L.D., Bottomley S.P. How do proteins avoid becoming too stable? Biophysical studies into metastable proteins. Eur. Biophys. J. 2004;33:83–88. doi: 10.1007/s00249-003-0356-1. [DOI] [PubMed] [Google Scholar]
- 4.Rogers J., Kalsheker N., Humphries S.E. The isolation of a clone for human α1-antitrypsin and the detection of α1-antitrypsin in mRNA from liver and leukocytes. Biochem. Biophys. Res. Commun. 1983;116:375–382. doi: 10.1016/0006-291x(83)90532-6. [DOI] [PubMed] [Google Scholar]
- 5.Crystal R.G. The α1-antitrypsin gene and its deficiency states. Trends Genet. 1989;5:411–417. doi: 10.1016/0168-9525(89)90200-x. [DOI] [PubMed] [Google Scholar]
- 6.Lomas D.A., Evans D.L., Carrell R.W. The mechanism of Z α1-antitrypsin accumulation in the liver. Nature. 1992;357:605–607. doi: 10.1038/357605a0. [DOI] [PubMed] [Google Scholar]
- 7.Gadek J.E., Fells G.A., Crystal R.G. Role of connective tissue proteases in the pathogenesis of chronic inflammatory lung disease. Environ. Health Perspect. 1984;55:297–306. doi: 10.1289/ehp.8455297. [DOI] [PMC free article] [PubMed] [Google Scholar]
- 8.Cox D.W., Billingsley G.D., Callahan J.W. Aggregation of plasma Z type α1-antitrypsin suggests basic defect for the deficiency. FEBS Lett. 1986;205:255–260. doi: 10.1016/0014-5793(86)80908-5. [DOI] [PubMed] [Google Scholar]
- 9.Elliott P.R., Bilton D., Lomas D.A. Lung polymers in Z α1-antitrypsin deficiency-related emphysema. Am. J. Respir. Cell Mol. Biol. 1998;18:670–674. doi: 10.1165/ajrcmb.18.5.3065. [DOI] [PubMed] [Google Scholar]
- 10.Ekeowa U.I., Freeke J., Lomas D.A. Defining the mechanism of polymerization in the serpinopathies. Proc. Natl. Acad. Sci. USA. 2010;107:17146–17151. doi: 10.1073/pnas.1004785107. [DOI] [PMC free article] [PubMed] [Google Scholar]
- 11.Devlin G.L., Chow M.K., Bottomley S.P. Acid denaturation of α1-antitrypsin: characterization of a novel mechanism of serpin polymerization. J. Mol. Biol. 2002;324:859–870. doi: 10.1016/s0022-2836(02)01088-4. [DOI] [PubMed] [Google Scholar]
- 12.Lomas D.A., Evans D.L., Carrell R.W. Effect of the Z mutation on the physical and inhibitory properties of α1-antitrypsin. Biochemistry. 1993;32:500–508. doi: 10.1021/bi00053a014. [DOI] [PubMed] [Google Scholar]
- 13.Mahadeva R., Dafforn T.R., Lomas D.A. 6-mer peptide selectively anneals to a pathogenic serpin conformation and blocks polymerization. Implications for the prevention of Z α(1)-antitrypsin-related cirrhosis. J. Biol. Chem. 2002;277:6771–6774. doi: 10.1074/jbc.C100722200. [DOI] [PubMed] [Google Scholar]
- 14.Mast A.E., Enghild J.J., Salvesen G. Conformation of the reactive site loop of α1-proteinase inhibitor probed by limited proteolysis. Biochemistry. 1992;31:2720–2728. doi: 10.1021/bi00125a012. [DOI] [PubMed] [Google Scholar]
- 15.Yamasaki M., Sendall T.J., Huntington J.A. Molecular basis of α1-antitrypsin deficiency revealed by the structure of a domain-swapped trimer. EMBO Rep. 2011;12:1011–1017. doi: 10.1038/embor.2011.171. [DOI] [PMC free article] [PubMed] [Google Scholar]
- 16.James E.L., Bottomley S.P. The mechanism of α1-antitrypsin polymerization probed by fluorescence spectroscopy. Arch. Biochem. Biophys. 1998;356:296–300. doi: 10.1006/abbi.1998.0751. [DOI] [PubMed] [Google Scholar]
- 17.Dafforn T.R., Mahadeva R., Lomas D.A. A kinetic mechanism for the polymerization of α1-antitrypsin. J. Biol. Chem. 1999;274:9548–9555. doi: 10.1074/jbc.274.14.9548. [DOI] [PubMed] [Google Scholar]
- 18.Reference deleted in proof.
- 19.Knaupp A.S., Levina V., Bottomley S.P. Kinetic instability of the serpin Z α1-antitrypsin promotes aggregation. J. Mol. Biol. 2010;396:375–383. doi: 10.1016/j.jmb.2009.11.048. [DOI] [PubMed] [Google Scholar]
- 20.Schrodinger, LLC. 2010. The PyMOL Molecular Graphics System, Ver. 1.3r2. http://sourceforge.net/projects/pymol/files/.
- 21.Hess B., Kutzner C., Lindahl E. GROMACS 4: algorithms for highly efficient, load-balanced, and scalable molecular simulation. J. Chem. Theory Comput. 2008;4:435–447. doi: 10.1021/ct700301q. [DOI] [PubMed] [Google Scholar]
- 22.Oostenbrink C., Villa A., van Gunsteren W.F. A biomolecular force field based on the free enthalpy of hydration and solvation: the GROMOS force-field parameter sets 53A5 and 53A6. J. Comput. Chem. 2004;25:1656–1676. doi: 10.1002/jcc.20090. [DOI] [PubMed] [Google Scholar]
- 23.Berendsen H.J.C., Postma J.P.M., van Gunsteren W.F. Interaction models for water in relation to protein hydration. In: Pullman B., editor. Intermolecular Forces. Reidel; Dordrecht, The Netherlands: 1981. pp. 331–342. [Google Scholar]
- 24.Berendsen H.J.C., Postma J.P.M., Haak J.R. Molecular dynamics with coupling to an external bath. J. Chem. Phys. 1984;81:3684–3690. [Google Scholar]
- 25.Hess B., Bekker H., Fraaije J.G.E.M. LINCS: a linear constraint solver for molecular simulations. J. Comput. Chem. 1997;18:1463–1472. [Google Scholar]
- 26.Tironi I.G., Sperb R., Vangunsteren W.F. A generalized reaction field method for molecular-dynamics simulations. J. Chem. Phys. 1995;102:5451–5459. [Google Scholar]
- 27.Heinz T.N., van Gunsteren W.F., Hunenberger P.H. Comparison of four methods to compute the dielectric permittivity of liquids from molecular dynamics simulations. J. Chem. Phys. 2001;115:1125–1136. [Google Scholar]
- 28.Darden T., York D., Pedersen L. Particle mesh Ewald—an N.log(N) method for Ewald sums in large systems. J. Chem. Phys. 1993;98:10089–10092. [Google Scholar]
- 29.Lins R.D., Rothlisberger U. Influence of long-range electrostatic treatments on the folding of the N-terminal H4 histone tail peptide. J. Chem. Theory Comput. 2006;2:246–250. doi: 10.1021/ct0501699. [DOI] [PubMed] [Google Scholar]
- 30.Figueirido F., Del Buono G.S., Levy R.M. On finite-size effects in computer simulations using the Ewald potential. J. Chem. Phys. 1995;103:6133–6142. [Google Scholar]
- 31.Baker N.A., Sept D., McCammon J.A. Electrostatics of nanosystems: application to microtubules and the ribosome. Proc. Natl. Acad. Sci. USA. 2001;98:10037–10041. doi: 10.1073/pnas.181342398. [DOI] [PMC free article] [PubMed] [Google Scholar]
- 32.Levina V., Dai W., Bottomley S.P. Expression, purification and characterization of recombinant Z α1-antitrypsin—the most common cause of α1-antitrypsin deficiency. Protein Expr. Purif. 2009;68:226–232. doi: 10.1016/j.pep.2009.06.011. [DOI] [PubMed] [Google Scholar]
- 33.Tsutsui Y., Liu L., Wintrode P.L. The conformational dynamics of a metastable serpin studied by hydrogen exchange and mass spectrometry. Biochemistry. 2006;45:6561–6569. doi: 10.1021/bi060431f. [DOI] [PubMed] [Google Scholar]
- 34.Whisstock J.C., Bottomley S.P. Molecular gymnastics: serpin structure, folding and misfolding. Curr. Opin. Struct. Biol. 2006;16:761–768. doi: 10.1016/j.sbi.2006.10.005. [DOI] [PubMed] [Google Scholar]
- 35.Bottomley S.P. The structural diversity in α1-antitrypsin misfolding. EMBO Rep. 2011;12:983–984. doi: 10.1038/embor.2011.187. [DOI] [PMC free article] [PubMed] [Google Scholar]
- 36.Irving J.A., Pike R.N., Whisstock J.C. Phylogeny of the serpin superfamily: implications of patterns of amino acid conservation for structure and function. Genome Res. 2000;10:1845–1864. doi: 10.1101/gr.gr-1478r. [DOI] [PubMed] [Google Scholar]
- 37.Knaupp A.S., Bottomley S.P. Structural change in β-sheet A of Z α1-antitrypsin is responsible for accelerated polymerization and disease. J. Mol. Biol. 2011;413:888–898. doi: 10.1016/j.jmb.2011.09.013. [DOI] [PubMed] [Google Scholar]
- 38.Brantly M., Courtney M., Crystal R.G. Repair of the secretion defect in the Z form of α1-antitrypsin by addition of a second mutation. Science. 1988;242:1700–1702. doi: 10.1126/science.2904702. [DOI] [PubMed] [Google Scholar]
- 39.Faber H.R., Matthews B.W. A mutant T4 lysozyme displays five different crystal conformations. Nature. 1990;348:263–266. doi: 10.1038/348263a0. [DOI] [PubMed] [Google Scholar]
- 40.Ely K.R., Herron J.N., Edmundson A.B. Three-dimensional structure of a light chain dimer crystallized in water. Conformational flexibility of a molecule in two crystal forms. J. Mol. Biol. 1989;210:601–615. doi: 10.1016/0022-2836(89)90135-6. [DOI] [PubMed] [Google Scholar]
- 41.Moult J., Yonath A., Saya A. The structure of triclinic lysozyme at 2–5 Å resolution. J. Mol. Biol. 1976;100:179–195. doi: 10.1016/s0022-2836(76)80147-7. [DOI] [PubMed] [Google Scholar]
- 42.Eigenbrot C., Randal M., Kossiakoff A.A. Structural effects induced by mutagenesis affected by crystal packing factors: the structure of a 30–51 disulfide mutant of basic pancreatic trypsin inhibitor. Proteins. 1992;14:75–87. doi: 10.1002/prot.340140109. [DOI] [PubMed] [Google Scholar]
- 43.Sheriff S., Hendrickson W.A., Jensen L.H. Influence of solvent accessibility and intermolecular contacts on atomic mobilities in hemerythrins. Proc. Natl. Acad. Sci. USA. 1985;82:1104–1107. doi: 10.1073/pnas.82.4.1104. [DOI] [PMC free article] [PubMed] [Google Scholar]
- 44.Phillips G.N., Jr. Comparison of the dynamics of myoglobin in different crystal forms. Biophys. J. 1990;57:381–383. doi: 10.1016/S0006-3495(90)82540-6. [DOI] [PMC free article] [PubMed] [Google Scholar]
- 45.Fraser J.S., van den Bedem H., Alber T. Accessing protein conformational ensembles using room-temperature x-ray crystallography. Proc. Natl. Acad. Sci. USA. 2011;108:16247–16252. doi: 10.1073/pnas.1111325108. [DOI] [PMC free article] [PubMed] [Google Scholar]
- 46.Knaupp A.S., Bottomley S.P. Structural change in β-sheet A of Z α(1)-antitrypsin is responsible for accelerated polymerization and disease. J. Mol. Biol. 2011;413:888–898. doi: 10.1016/j.jmb.2011.09.013. [DOI] [PubMed] [Google Scholar]
- 47.Ogushi F., Fells G., Crystal R. Z-type α-1-antitrypsin (Aat) is less competent than M1-type Aat as an inhibitor of neutrophil elastase. Am. Rev. Respir. Dis. 1986;133:A218. [Google Scholar]
- 48.Sifers R.N., Hardick C.P., Woo S.L.C. Disruption of the 290–342 salt bridge is not responsible for the secretory defect of the PiZ α1-antitrypsin variant. J. Biol. Chem. 1989;264:2997–3001. [PubMed] [Google Scholar]
- 49.Fregonese L., Stolk J. Hereditary α-1-antitrypsin deficiency and its clinical consequences. Orphanet J. Rare Dis. 2008;3:16–24. doi: 10.1186/1750-1172-3-16. [DOI] [PMC free article] [PubMed] [Google Scholar]
- 50.Stoller J.K., Aboussouan L.S. α1-antitrypsin deficiency. Lancet. 2005;365:2225–2236. doi: 10.1016/S0140-6736(05)66781-5. [DOI] [PubMed] [Google Scholar]
- 51.Jezierski G., Pasenkiewicz-Gierula M. The effect of the Glu342Lys mutation in α1-antitrypsin on its structure, studied by molecular modeling methods. Acta Biochim. Pol. 2001;48:65–75. [PubMed] [Google Scholar]
Associated Data
This section collects any data citations, data availability statements, or supplementary materials included in this article.