Abstract
Reflectance interference contrast microscopy (RICM) was used to study the mechanics of the endothelial glycocalyx. This technique tracks the vertical position of a glass microsphere probe that applies very light fluctuating loads to the outermost layer of the bovine lung microvascular endothelial cell (BLMVEC) glycocalyx. Fluctuations in probe vertical position are used to estimate the effective stiffness of the underlying layer. Stiffness was measured before and after removal of specific glycocalyx components. The mean stiffness of BLMVEC glycocalyx was found to be ∼7.5 kT/nm2 (or ∼31 pN/nm). Enzymatic digestion of the glycocalyx with pronase or hyaluronan with hyaluronidase increased the mean effective stiffness of the glycocalyx; however, the increase of the mean stiffness on digestion of heparan sulfate with heparinase III was not significant. The results imply that hyaluronan chains act as a cushioning layer to distribute applied forces to the glycocalyx structure. Effective stiffness was also measured for the glycocalyx exposed to 0.1%, 1.0%, and 4.0% BSA; glycocalyx compliance increased at two extreme BSA concentrations. The RICM images indicated that glycocalyx thickness increases with BSA concentrations. Results demonstrate that RICM is sensitive to detect the subtle changes of glycocalyx compliance at the fluid-fiber interface.
Keywords: heparan sulfate, hyaluronan, albumin
in addition to responding to chemical signals, mammalian cells also respond to mechanical stresses (3, 19, 24, 52). For example, mechanical forces alter cell migration (28), cell growth (15), inflammation (22), and disease state regulation (48). The endothelial glycocalyx is of particular interest, as it has been implicated in mechano-transduction (53). The endothelial glycocalyx is a negatively charged, protein and polysaccharide, brush-like layer that resides on the luminal surface of endothelial cells. In the lung vasculature, this multifunctional layer responds to fluid shear (13, 18, 32), fluid pressure (11), and oncotic pressure (23) to regulate inflammation and ultimately the fluid balance (49, 51). The glycosaminoglycan (GAG) heparan sulfate (HS), with associated transmembrane protein syndecan, and the unsulfated GAG hyaluronan (HA) have been implicated in biomechanical activation (11, 32). Additionally, albumin, the dominant protein in blood plasma, has been shown to interact with the glycocalyx and be involved in proper regulation of fluid balance (20, 21, 31, 47).
Currently there are several techniques commonly used to measure mechanical properties of living cells: cell poking, atomic force microscopy (AFM), magnetic tweezers, micropipette aspiration, magnetic twisting cytometry, flow chambers, and others (1, 19, 25). The loading forces used in these techniques vary from 10 pN to 5 μN (1). Typical cell indentation techniques such as AFM use finite loading rates that progressively stress the cellular surface, cell membrane, and underlying cytoskeletal elements, which may result in measuring nonequilibrium mechanical properties of cells (7, 8, 30). Most cellular mechanics models describe the mechanics of cytoskeletal environment without reference to the glycocalyx (19). Interestingly, Satcher and Dewey (41) concluded that, whereas the endothelial cell has been shown to respond to surface stress and elastically deform upon 104 Pa pressure, the elastic modulus of the cell can be 2–10 times higher attributable to underlying cytoskeletal components. This points to the mechanical role of the glycocalyx: glycocalyx components, such as GAGs, serve to sense stresses attributable to fluid flow and transmit them to the anchored transmembrane proteins, thus facilitating cellular mechano-sensing (13, 24).
Recently, we have used AFM with a silica bead serving as an indenter (diameter ∼18 μm) to measure the elastic response of bovine lung microvascular endothelial cells (BLMVEC) (34). We found that the glycocalyx stiffness and thickness changed after removal of GAGs by specific enzymes, which agreed with the literature reports (12, 14, 50). In the present report, we describe how a microinterferometric technique based on reflectance interference contrast microscopy (RICM) can provide information about the outermost cellular layer mechanics, e.g., at the fluid-fiber interface, that is complementary to the bead-AFM study.
RICM, an interferometric technique initially described by Curtis (9), has been quantitatively used to characterize local bending elastic modulus of red blood cells (56), measure absolute distances from a surface (45), perform contour analysis on giant vesicles (4), measure the bending modulus, membrane tension, and adhesion energy of single cells (33), and describe the dynamics of wetting by partially wetting fluids on a solid surface (42). RICM is estimated to have a spatial resolution of ∼300 nm (40) and a subnanometer vertical resolution (26, 54). Rädler and Sackmann (39) utilized polystyrene microspheres hovering over surfaces as force probes to determine weak repulsive interaction with RICM. The balance of the forces (i.e., weight of the particle minus its buoyancy vs. electrostatic repulsion) relied on the stochastic fluctuations of the vertical position of the particle around the equilibrium to find how the interaction energy depended on distance. In a similar manner, RICM could be used to characterize the effective stiffness of the endothelial glycocalyx layer.
The work described herein uses RICM to mechanically interrogate the glycocalyx with a glass bead serving as a force probe that exerts very small loads fluctuating around ∼50 pN and indents the glycocalyx only several nanometers. In contrast to microrheology techniques, the RICM thus measures the mechanical properties resulting from normal loading forces (i.e., pressure). Specifically, we used RICM to study how effective glycocalyx stiffness changes when HS or HA are removed by specific enzyme digestion and when albumin concentration in the media is changed. The results demonstrate the potential of using RICM microinterferometry as a sensitive research tool in cellular biomechanics.
MATERIALS AND METHODS
Cell culture.
BLMVECs (Vec Technologies) were grown in MCDB-131 Complete (Vec Technologies) and in MCDB 131 (M853, Sigma) supplemented with 15 mM sodium bicarbonate, pH 7.4, 1% penicillin/streptomycin, and 10% FBS. BLMVECs were subcultured (1.25 × 10⁵ cells/cm2) on ethanol-dried, autoclaved coverslips (17 mm thick), which were treated with 0.4% gelatin (Sigma-Aldrich) and 100 μg/cm2 fibronectin (Sigma-Aldrich) each for 1 h. Passage 5–7 BLMVECs were maintained at 37°C and 5% CO2 until usage 9–11 days after subculture. The testing medium used during experiments was MCDB-131 (Sigma-Aldrich), pH 7.4, supplemented with 25 mM HEPES and 1% penicillin/streptomycin designated as medium II (MII).
Enzymatic digestion.
Enzymes (Sigma-Aldrich) were used to selectively degrade HA and/or HS from the BLMVEC glycocalyx: hyaluronidase (from Streptomyces hyalurolyticus; no. 4.2.2.1; 50 U/ml) and heparinase III (from Flavobacterium heparinum; no. 4.2.2.8; 15 mU/ml; Sigma) in MII + 1% BSA for 1 h at 37°C and 5% CO2. Pronase (from Streptomyces griseus; no. 2.4.24.31; Sigma; 0.01 mg/ml in MII + 1% BSA for 5 min at 37°C and 5% CO2), a broad-spectrum protease, was used to nonspecifically degrade the glycocalyx. The RICM experiments were performed at room temperature in media not containing the enzyme.
Actin disruption.
The actin cytoskeleton was disrupted with 100 nM cytochalasin D (from Zygosporium mansonii; no. 244-804-1; Sigma) for 30 min in MII + 1% BSA for 5 min at 37°C and 5% CO2. Cytochalasin D is known to inhibit actin polymerization (6, 10, 34). The RICM experiments were performed at room temperature in media not containing the enzyme. Treated and untreated samples were stained for actin after 1 h. BLMVEC monolayers were fixed with 4% paraformaldehyde for 10 min, rinsed with PBS for 5 min, incubated with 0.165 μM Alexa Fluor 594 phalloidin (Invitrogen) for 40 min, rinsed with PBS, air dried, and then mounted with ProLong Gold AntiFade Reagent (Invitrogen). Samples were imaged using a Nikon Diaphot inverted microscope equipped with a ×54 oil immersion objective (NA 0.99, 170/0.17 Leitz) and TRITC filters.
Albumin treatment.
After the preincubation of BLMVEC monolayers for 5 min with MII, experiments were performed in MII + 0.1%, 1.0%, or 4.0% of highly purified BSA (Fraction V, Proliant).
RICM microinterferometry.
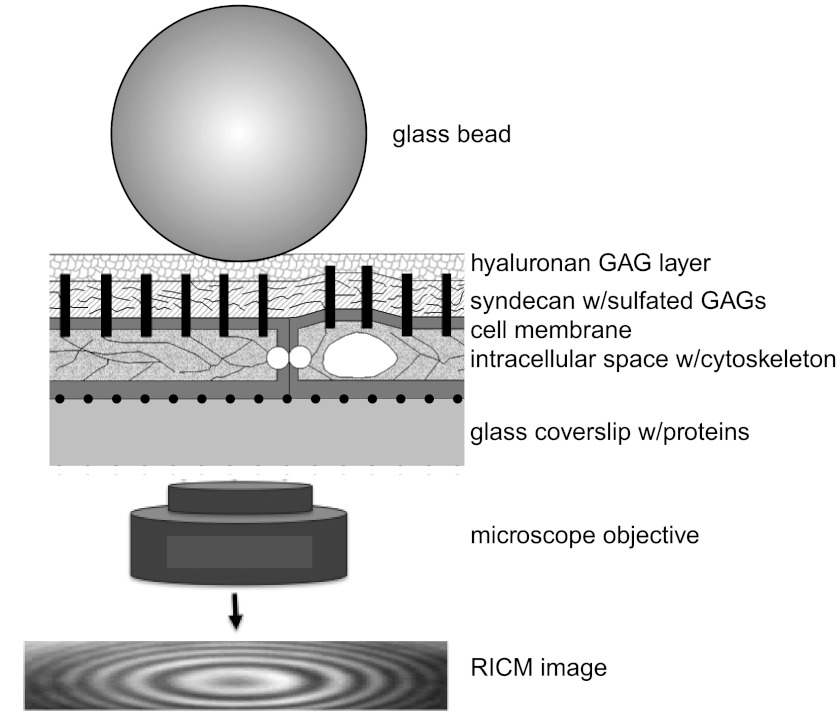
Figure 1 shows a schematic for a spherical glass bead separated from a flat glass coverslip by a cell monolayer. Incident monochromatic light is partially transmitted and reflected at each interface, resulting in an interference pattern attributable to the recombination of reflected light. This interference pattern is used to determine how the vertical separation distance between a probe bead and an underlying reflective glass surface changes as a function of time. For a bead compressing an elastic layer, the system can be modeled as a particle in a potential energy minimum where gravitational and elastic forces balance each other (39). The vertical position of the particle fluctuates around the minimum as described by the Langevin equation (27, 39):
| (Eq. 1) |
where h is the vertical separation distance between the bead probe and the coverslip; m is mass; d2h/dt2 acceleration; γ(h) is the hydrodynamic drag coefficient; dh/dt velocity; U(h) describes the interaction potential; and fstoch represents the stochastic thermal force. Assuming the vertical separation distance to be much smaller than the bead size indicates a strongly overdamped system so that the first l.h.s. term can be disregarded. The hydrodynamic drag coefficient is given by the Stokes formula:
| (Eq. 2) |
where η is the medium viscosity, R is the probe radius, and the dimensionless correction factor Γ(h) is approximately equal to R/h if h ≪ R. For small vertical separation distances and movements, the dissipative forces affect the system only minimally. Under these two assumptions, the bead-underlying layer system is in thermal equilibrium and the bead fluctuations in h follow the Boltzmann law:
| (Eq. 3) |
where p(h) is the probability of finding the bead at separation distance, h, A is the probability normalization constant, U(h) is the interaction potential, k is the Boltzmann constant, and T is temperature.
Fig. 1.
Schematic of reflectance interference contrast microscopy (RICM) bead probe placed on the top of bovine lung microvascular endothelial cell (BLMVEC) glycocalyx (not drawn to scale). Monochromatic light reflected from bead and coverslip surface constructively interferes to create an interference pattern in the RICM image that is captured by microscope objective and CCD camera. The interference pattern changes when the distance between the bead and the coverslip change. GAG, glycosaminoglycan.
Measuring the fluctuations of bead vertical position.
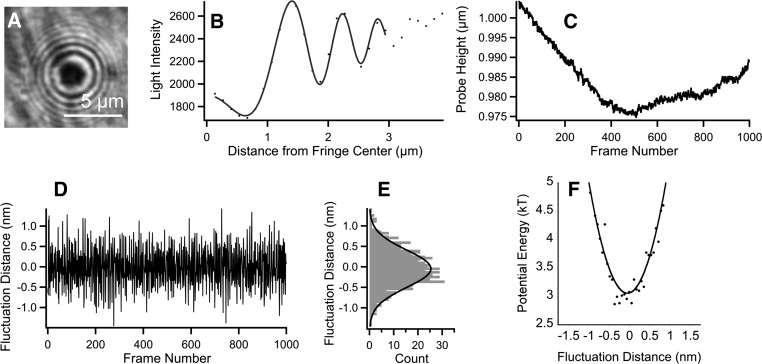
The interference pattern for a spherical bead on the flat shows fringes similar to Newton rings (Fig. 2). Several methods for fitting the fringe profile have been described in the literature including the simple, finite aperture (16, 38), and nonlocal theories (26). At small illumination numerical aperture and for the observation of thick objects, an assumption of normal incidence is justified (16, 39), and the vertical separation distance, h, between the bead and the substrate can be obtained by fitting the fringe intensity profile to the following equation:
| (Eq. 4) |
where I(x,h) is the fringe intensity as a function of both vertical separation distance, h, and the distance from fringe center, x, and R is the bead radius. The constants A2 and l describe the diminishing contrast of the fringes, A1 and g account for the nonlinear background resulting from diffuse reflection away from the bead center; A0 is the intensity offset; n2 is the refractive index of the medium between the bead and the coverslip; and δ is the phase shift at the probe surface. As can be seen from Fig. 2A, the RICM image also shows intensity variations attributable to the cellular layer. These variations arise from the refractive indices of cellular components such as the nucleus and actin cytoskeleton. To average over these intracellular variations, the intensity profile of interference fringes was radially integrated (Fig. 2B) and then fit to Eq. 4 using n2 = 1.33 (water). As a result of incoherent monochromatic light focused with small aperture, the intensity distortions increased with the distance from the fringe center, and therefore only the intensity of the first few fringes was used in fitting. Note that the absolute vertical separation distance between the bead and the coverslip is not known because the actual fringe number is unknown; however, the changes in the vertical separation distance from one RICM image to the next are obtainable. In RICM experiments a sequence of ∼1,000 images was acquired at 15–20 Hz, with an exposure time of 30 ms, and the changes in vertical separation distance were calculated by fitting each successive RICM fringe image.
Fig. 2.
A: RICM image of a glass probe on a BLMVEC monolayer. B: radial intensity profile of a single RICM image frame: the first few fringes were fitted for each frame. C: changes in probe height during an RICM experiment shown as a function of the frame number. D: vertical distance fluctuations obtained from data in C after high-pass Hanning filtering. E: probability function, p(h), is shown as solid line, calculated from the histogram of distance fluctuations. F: potential energy profile U(h) calculated from p(h).
Vertical separation distance changes in time, h(t), were not only due to the stochastic force, fstoch, but also to physiological movements of the cell and its cytoskeleton, including flickering (55), and bead movements resulting from various external causes (Fig. 2C). To separate the fluctuations in h attributable to stochastic thermal force from other causes, the RICM-derived h(t) data were filtered with a high-pass Hanning filter with a frequency cutoff at 2–3 Hz (Igor Pro 5.02; Wavemetrics) (Fig. 2D). It was assumed that slower vertical separation distance changes were due to causes other than thermal motion of the bead. The effects of slower cell movements were thus eliminated.
With sufficient sample size, the probability of finding the bead at the separation distance h, p(h) (Fig. 2E), was used to find the interaction potential, U(h), using Eq. 3 (Fig. 2F). The second derivative of U(h)/kT provided a measure of the effective stiffness for bead-cell interactions. Because the bead was rigid compared with the viscoelastic structure below it and the loading forces were very small, the computed effective stiffness, U″(h) was assigned to the underlying glycocalyx.
RICM experiments.
Borosilicate glass beads (diameter 17.3 μm ± 1.4 μm; Duke Scientific) were dispersed in MII + 1% BSA and then randomly placed on confluent BLMVEC monolayers. Contact area was projected to be > ∼2.8 μm2 based on calculations using AFM with identical probes (34). A coverslip covered with gelatin and fibronectin (no BLMVECs) was used as negative control. Images of interference fringes were recorded utilizing a Zeiss inverted microscope (IM35, Zeiss) equipped with an HBO 50W light source, a ×54 oil immersion objective (NA 0.99, 170/0.17 Leitz), a monochromatic filter (λ = 546.1 nm), and a digital CCD Camera (C4742–80-12AG, Hamamatsu). The microscope was on an antivibration table, and each RICM experiment was conducted in a closed chamber to reduce noise resulting from the movement of air over the sample. Each BLMVEC monolayer experiment lasted ∼1.5 h. During this period, up to 15 RICM image sequences were acquired from beads located at cell-cell junctions. Statistical outliers were thrown out. Effective stiffness results were compared using an unpaired Wilcoxon-Mann-Whitney rank sum test with significant differences assigned when P < 0.05.
RESULTS
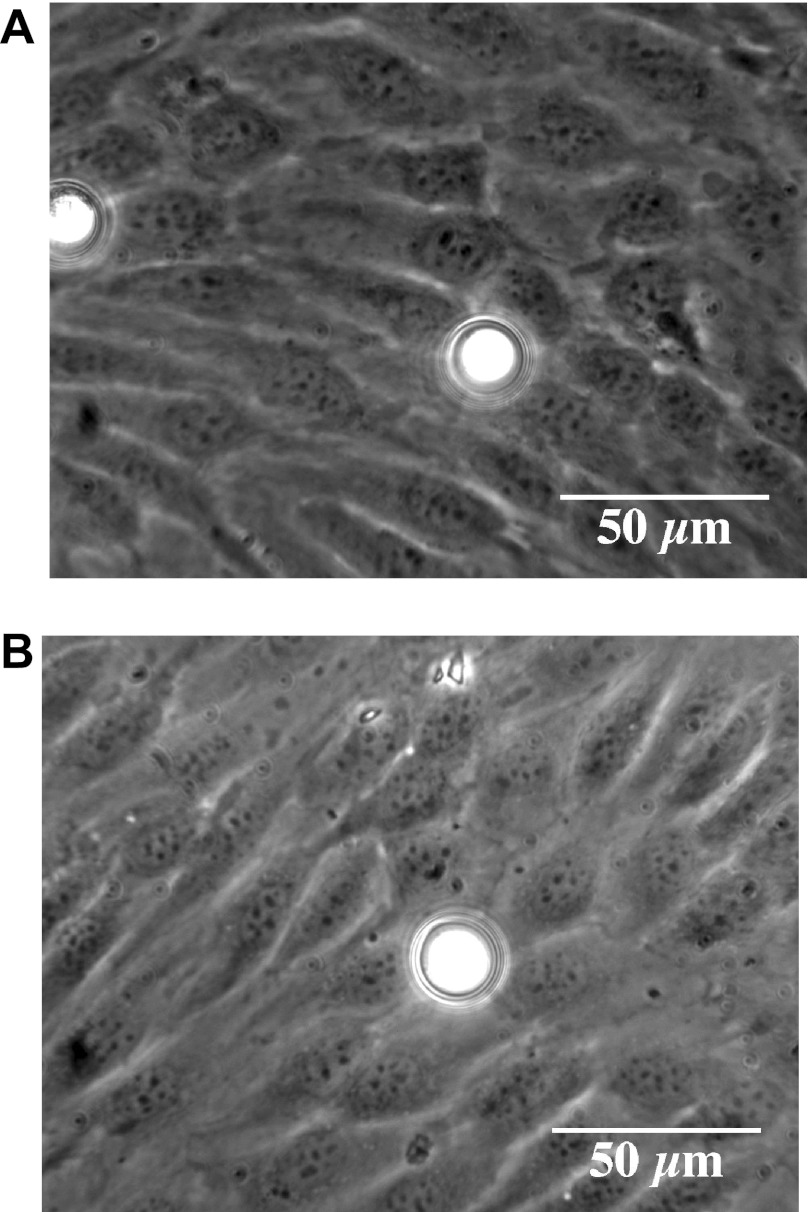
Figure 3 shows the examples of phase contrast images for untreated (Fig. 3A) and heparinase-treated (Fig. 3B) BLMVEC monolayers with a bead probe. Although the placement of each bead was random, the majority of the beads settled in the cell-cell junction regions because of the cell topography. Neither the enzyme treatments nor the albumin concentration change disrupted the confluence and the cobblestone appearance of BLMVEC monolayers.
Fig. 3.
Phase contrast images of BLMVEC monolayers with borosilicate glass probes (diameter ≈ 17.3 μm) that are untreated (A) and heparinase III treated (B).
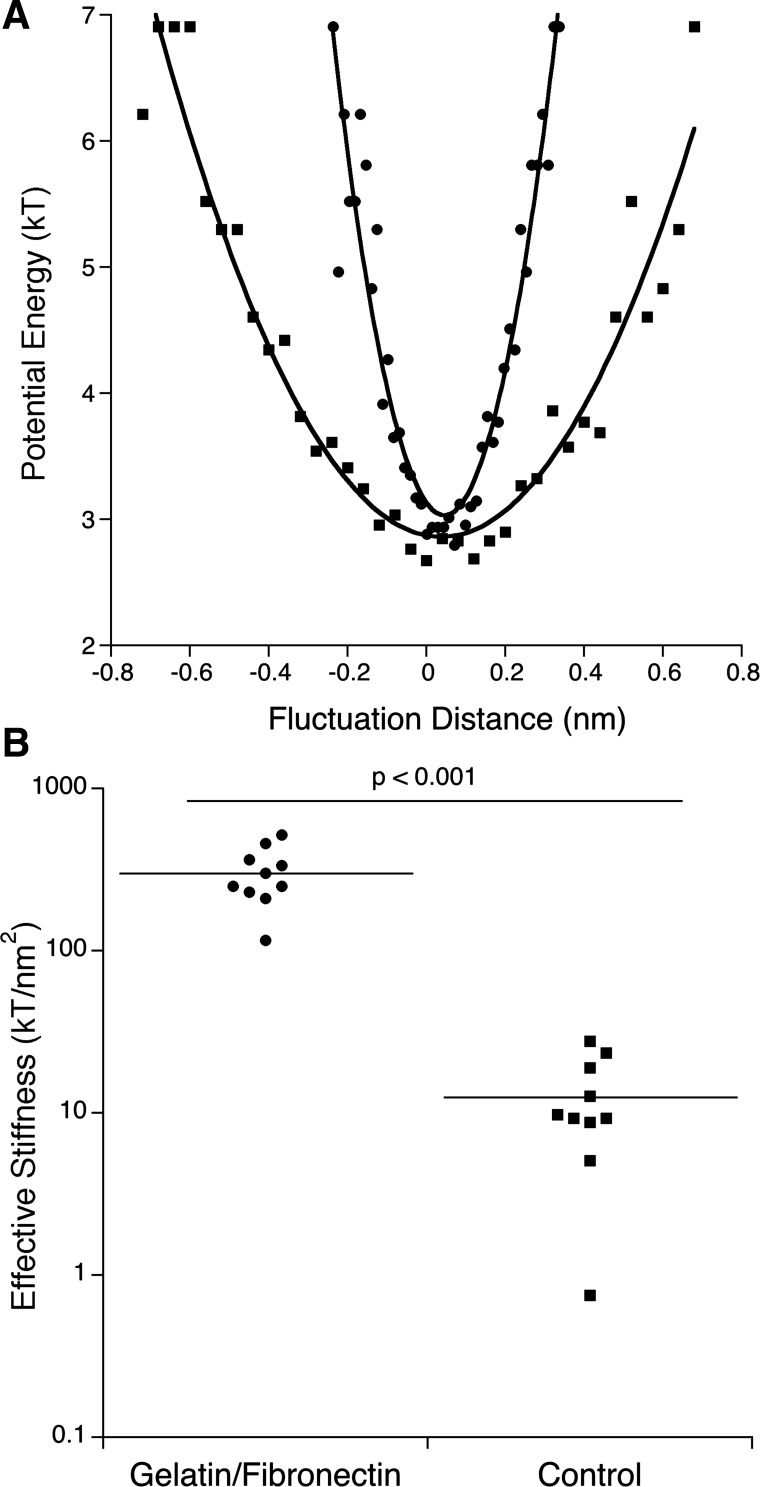
Figure 4 compares the effective stiffness of glass coverslips treated with 0.4% gelatin and 100 μg/cm2 fibronectin against glass coverslips seeded with BLMVECs grown to confluence. Figure 4A shows the typical interaction potential profiles, and Fig. 4B shows the effective stiffness for each sample. The mean effective stiffness of 303.5 ± 120.4 kT/nm2 was found for coverslips without BLMVECs (n = 10) and 12.6 ± 8.4 kT/nm2 for BLMVECs seeded coverslips (n = 10), respectively. The results indicated the upper limit of the stiffness measurable for protein-covered coverslip and suggested a vertical resolution of <1 nm. BLMVEC monolayers were significantly more compliant than unseeded coverslips (P < 0.0001). In other words, the softer the sample is, the better the RICM resolution is for reconstructing U(h) profiles.
Fig. 4.
A: potential energy profiles acquired from RICM data utilizing borosilicate glass probes (diameter ≈ 17.3 μm) for gelatin/fibronectin-incubated glass coverslip (●) and BLMVEC monolayer (■). B: calculated effective stiffness for gelatin/fibronectin-incubated glass coverslips (n = 10) and BLMVEC monolayers (n = 10). BLMVEC monolayers samples were significantly more compliant than protein covered coverslips (P < 0.001).
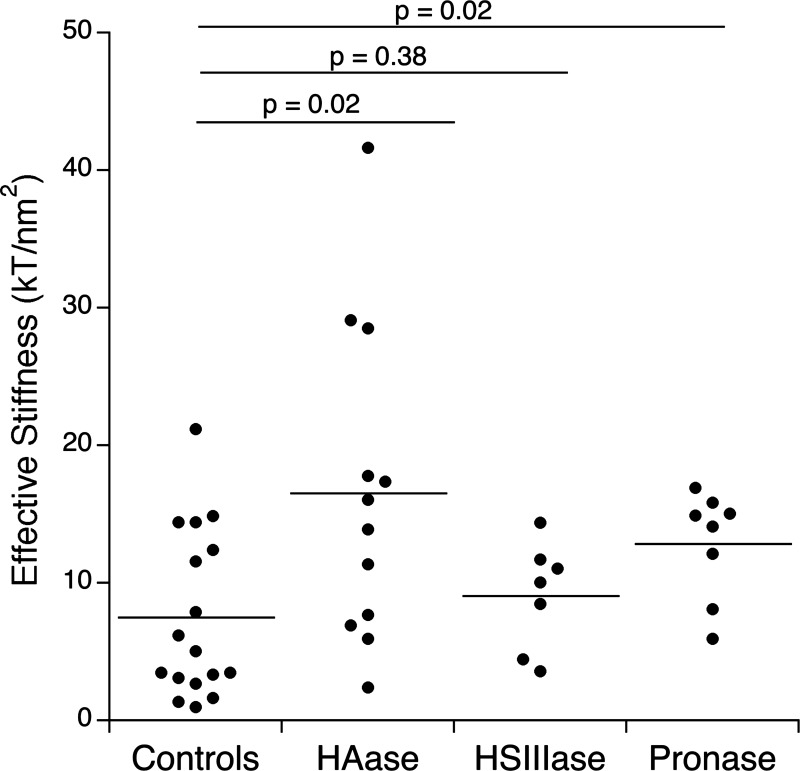
The contributions of HS and HA to the stiffness of BLMVEC glycocalyx were investigated before and after the treatment of BLMVEC monolayers with the medium containing hyaluronidase (HAase), heparinase III (HSIIIase), or pronase. As seen in Fig. 5, with the use of ∼17.3-μm-diameter probes, the RICM experiments yielded the mean effective stiffness 7.53 ± 6.08 (control, n = 17), 16.56 ± 11.48 (HAase-treated cells, n = 12; P = 0.02), 9.10 ± 3.91 (HSIIIase-treated cells, n = 7; P = 0.38), and 12.87 ± 3.90 kT/nm2 (pronase-treated cells, n = 8; P = 0.02). At a significance level of P < 0.05, enzymatic digestion with hyaluronidase or pronase resulted in a significant increase of mean effective stiffness. The spread of measured stiffness values was large, indicating heterogeneity of the BLMVEC glycocalyx and/or uneven enzyme action. Based on immunohistochemistry of HS and HA, the heterogeneous distribution of GAGs both before and after enzymatic degradation is the most likely explanation for the observed variations in effective stiffness (34).
Fig. 5.
Effective stiffness of BLMVEC glycocalyx measured by RICM utilizing borosilicate glass probes (diameter ≈ 17.3 μm) after hyaluronidase (HAse), heparinase III (HSIIIase), and pronase treatments. HAse-treated BLMVEC glycocalyx (n = 12) and pronase-treated BLMVEC monolayers (n = 8) showed significant changes in effective stiffness (P < 0.05) compared with the controls (n = 17); HSIIIase-treated BLMVEC glycocalyx (n = 7) was not statistically different from controls.
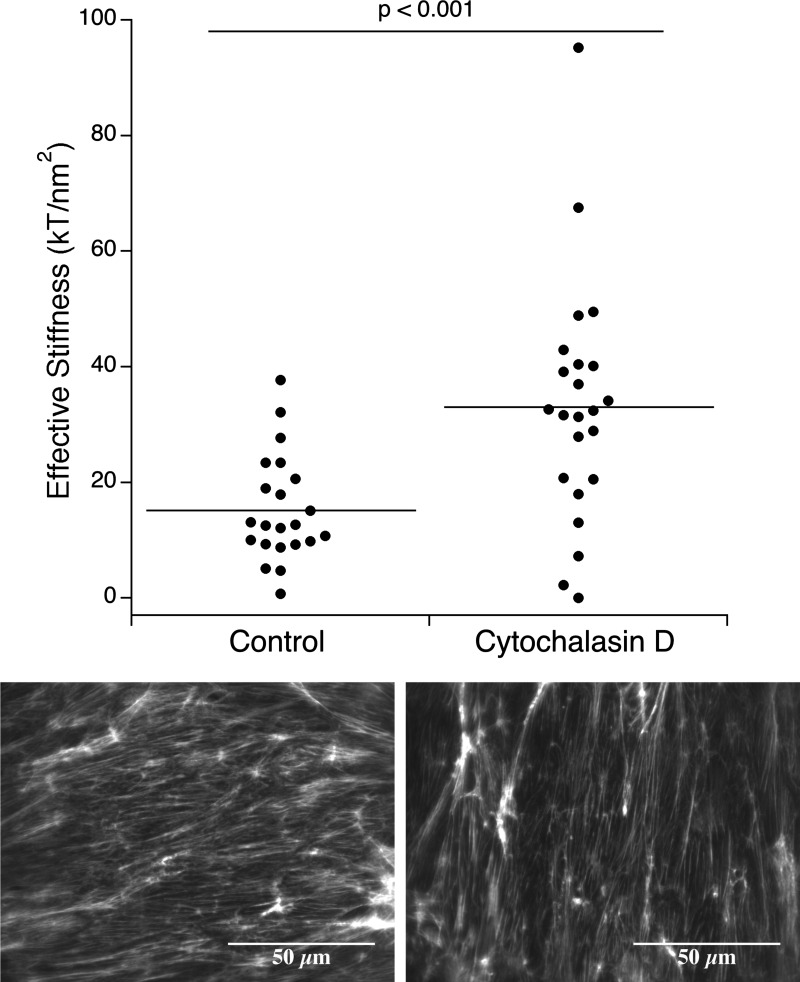
Contributions of underlying cytoskeletal actin components are shown in Fig. 6. Treatment with cytochalasin D increased (P < 0.001) BLMVEC monolayer effective stiffness to 33.12 ± 20.8 kT/nm2 (n = 23) from untreated cell effective stiffness of 15.27 ± 9.18 kT/nm2 (n = 22).
Fig. 6.
Effective stiffness of BLMVEC glycocalyx measured by RICM utilizing borosilicate glass probes (diameter ≈ 17.3 μm) after actin disruption with 100 nM cytochalasin D treatment (30 min). Cytochalasin D treatment of confluent monolayers resulted in increased stiffness. The confocal images (bottom) show the staining of the actin cytoskeleton for control and 100 nM cytochalasin D-treated monolayers.
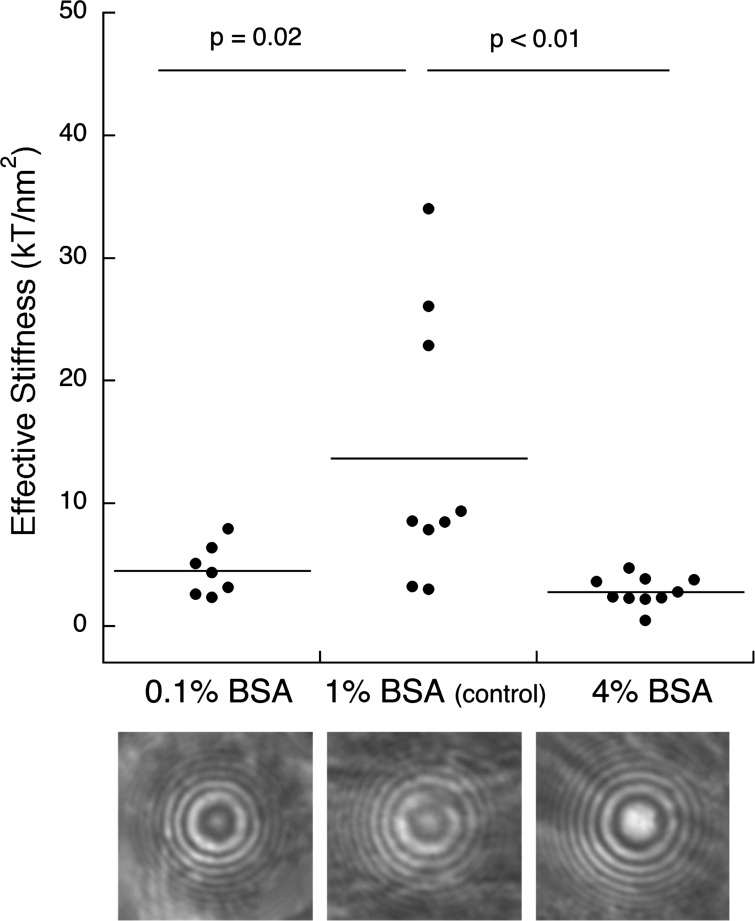
The effect of albumin concentration to the glycocalyx stiffness is shown in Fig. 7. The bottom three images show representative RICM interference images of 17.3-μm-diameter glass bead for 0.1%, 1.0%, and 4% BSA concentrations in MII. The increase of the innermost dark fringe size indicated that the addition of albumin swelled the glycocalyx by ∼100 nm. The glycocalyx mean stiffness was significantly softer in MII with 0.1 and 4.0% BSA compared with results in MII + 1.0% BSA: 4.55 ± 2.07 kT/nm2 (0.1% BSA, n = 7), 13.72 ± 11.07 kT/nm2 (1% BSA, n = 9), and 2.83 ± 1.20 kT/nm2 (4% BSA, n = 10).
Fig. 7.
Effective stiffness of BLMVEC glycocalyx measured by RICM utilizing borosilicate glass probes (diameter ≈ 17.3 μm) in presence of 0.1%, 1.0%, and 4.0% BSA in the medium. Effective glycocalyx stiffness was highest with 1.0% BSA (P < 0.05) when compared with 0.1% and 4.0% BSA samples. The representative RICM images (bottom) show that the glycocalyx thickness increases with the addition of BSA.
DISCUSSION
The study described here explored the feasibility of a novel application for the RICM technique and its potential to provide insight into the biomechanical property of the endothelial glycocalyx. As utilized here, RICM measured the fluctuations of the glass bead vertical position, h(t), at equilibrium where the gravitational pull on the bead and the viscoelastic response of the underlying cellular structures balanced each other. These vertical bead position changes occurred very fast; the instantaneous velocities of the bead are expected to follow the Maxwell-Boltzmann distribution. The positional changes were then translated into a potential energy profile, U(h), from which the estimation of the effective stiffness, U″(h), was made. The main premise for the interpretation of RICM results is illustrated in Fig. 1; the bead probe pushes into the outermost layer of glycocalyx and indents it only a few nanometers at a light load depending on the bead size, density, and buoyancy. With very light loads at equilibrium, the RICM technique is complementary to AFM and can report on the outermost glycocalyx layer with nanometer indentation resolution. In RICM experiments, each bead applies its load (weight minus the buoyancy) to the underlying structure: the loads were ∼50 pN for the 17.3 μm diameter bead probe. The vertical position fluctuations were on the order of ±1 nm (Fig. 2), indicating that the expected stiffness will be on the order of 50 pN/nm or 12 kT/nm2.
As illustrated by Fig. 4, RICM captured the difference between the potential energy profiles for protein-covered glass and softer BLMVEC monolayers. The width of potential energy profile is directly related to the magnitude of vertical position fluctuations (Fig. 4A); these were greater on the BLMVEC-seeded coverslip compared with the gelatin/fibronectin-coated coverslip. The limit of RICM technique thus lies in the measurements of stiffer systems where the CCD camera readout noise may be too large (17). The majority of the potential energy profiles used to calculate the effective stiffness, U″(h), were symmetric, and only a few cases of asymmetry in the probability function, p(h), were observed (Fig. 2E). Prieve (37) described similar asymmetry while using total internal reflection microscopy to measure equilibrium potential energy profiles between spherical polystyrene probes and glass surface. Such asymmetry was accounted for by the probe being unattached to the underlying surface. Comparison analysis was performed on both halves of the energy profile curves showing slight asymmetry in RICM probability function results; differences were insignificant.
Comparison between controls and enzyme-treated BLMVECs showed that hyaluronidase and pronase treatments resulted in mean effective stiffness that was statistically different from control monolayers at a 95% confidence interval (P < 0.05); however, HSIIIase treatment did not significantly alter the stiffness (Fig. 5). The finding that the enzymatic digestion of HA increased the glycocalyx stiffness could be interpreted that HA acted as a cushioning layer to distribute applied forces over glycocalyx structure. HA GAGs are long polymer chains that interpenetrate the glycocalyx and bind to CD44 and other glycocalyx components. This implies different roles for glycocalyx components in mechano-transduction: receptor-anchored HA chains are designed to capture flow shear forces and transmit them to transmembrane syndecans decorated with HS GAGs. Based on that physical picture, the enzymatic removal of HS GAGs would have affected the glycocalyx stiffness to a lesser extent, which was indeed found (Fig. 5). When HS linkages are disrupted, HA linkages may remain and therefore could maintain similar effective stiffness. At 10-fold higher loading forces (∼1 nN), O'Callaghan et al. (34) saw a decrease in BLMVEC elastic modulus upon heparinase treatment, which supports the proposed glycocalyx structure-function relationship (34).
Recently, Oberleithner et al. (35) used a bead-AFM technique to measure glycocalyx stiffness of vascular endothelial cells. Under similar loads, they found glycocalyx to be significantly softer than reported here. The discrepancy is most likely due to the viscoelasticity of glycocalyx and the differences in AFM and RICM loading rates. Oberleithner et al. (35) used slow loading rate with AFM tip velocity of 400 nm/s. Their AFM results, when corrected for the size of the spherical indenter and converted into elastic modulus, were in excellent agreement with our previously reported BLMVEC glycocalyx modulus, E ∼0.3 kPa (34). In contrast to the slow loading rate of AFM, the RICM bead fluctuates very fast; the rms velocity can be predicted by the energy equipartition theorem. These vertical fluctuations thus exert small but fast changing compressive forces to glycocalyx. Even when such velocities are corrected for the viscous drag of water (57), the RICM loading velocities are still faster by an order of magnitude than in typical AFM indentation experiments. Because of the viscoelastic behavior of glycocalyx, such fast changing indentations will make the glycocalyx appear stiffer than what is measured under a slow indenting AFM tip. On the basis of the differences between AFM and RICM measured stiffness, we postulate that the endothelial glycocalyx, like many other cross-linked polymeric networks, undergoes stiffening at faster applied loads.
By indenting several hundred nanometers using AFM, we have showed significant softening of BLMVEC monolayers after treatment with 100 nM cytochalasin D (34). RICM results, however, showed doubling of the effective stiffness of the BLMVEC glycocalyx (Fig. 6) after 100 nM cytochalasin D treatment. It is plausible that cytochalasin D treatment collapses the glycocalyx and/or causes the cell to shed it, or the cell junction regions become much thinner. The effects of cytochalasin D treatment on glycocalyx structure are unclear in the literature; however, support for junctional thinning is provided by the actin-stained images in Fig. 6 (bottom), wherein actin distribution is less uniform. Complete glycocalyx degradation with pronase (Fig. 5) showed that nonglycocalyx components were stiffer than the overlying glycocalyx, thus supporting the assignment of the RICM-measured stiffness to the glycocalyx layer. To determine membrane effects, membrane RICM intensity fluctuations were analyzed based on a linear contrast approximation described by Gönnenwein (17), and the results indicated that the membrane fluctuations and its stiffness (>> 10 kT/nm2) do not significantly contribute to RICM measurement of glycocalyx stiffness.
Within the glycocalyx, syndecan core protein, HS, and HA have all been associated with shear stress transmission (10, 11, 13, 36, 49). Transmembrane syndecans together with HS GAGs are of particular interest because they span the membrane and have the potential for direct interaction with intracellular components (49). HA, unlike HS, is not attached to proteoglycans and is believed to bind directly to the cellular membrane through the CD44 receptor (46) and associate with other glycocalyx components (43, 44). Previous study has shown that removal of HS or HA reduces the endothelial cell shear-induced response (29). Thi et al. (51) labeled HS proteoglycan with an anti-HS proteoglycan antibody and found relatively uniform staining with increased fluorescence at cell junctions (51). Banerjee and Toole (2) used HA-binding protein in cultured pulmonary aortic endothelial cells and found that, when cells were permeabilized, there was greater fluorescence within the cytoplasm as well as perinuclear staining (2). Confocal imaging of HS and HA distribution on BLMVECs showed that HA was more concentrated above the nuclear regions, whereas HS was more concentrated at junctions (34). In the present study, the RICM technique was used to find how the effective stiffness changed when these two GAGs were digested with specific enzymes. One limitation of this approach was that the RICM data acquisition for dozen of bead probes took ∼1-h, during which the cells could have expressed additional GAGs. The RICM measurements were made after the enzymes were removed from the medium. Another limitation was that the bead placements were random. Measurement locations were therefore carefully selected to the probe sites associated with the cell junction regions.
Although the RICM results suggest that the main role of HA is maintaining and cushioning the glycocalyx, it is also known that albumin in circulation associates with HA (47). In the present study, increasing albumin concentrations above BLMVEC monolayers to 4% did significantly soften the mean glycocalyx stiffness. This softening with additional albumin supports the implications of glycocalyx structure and the role of HA within the glycocalyx. Increased stiffness at 1% BSA indicates an ideal albumin concentration for glycocalyx structure and signal transmission capability. Progressive swelling of glycocalyx thickness has been observed upon BSA addition (Fig. 7). It remains to be seen whether the combined action of adding albumin and removing HA and/or HS with specific enzymes will be able to further differentiate the role of these two glycocalyx GAGs.
Summary.
Very light loads and small indentations by bead probes allowed the RICM technique to be used for the measurement of the effective stiffness of endothelial glycocalyx. The mean stiffness of BLMVEC glycocalyx in enzymatic studies was found to be ∼7.5 kT/nm2 (or ∼31 pN/nm). Enzymatic digestion of HA and nonspecific glycocalyx digestion with pronase increased the mean effective stiffness of the glycocalyx; however, the effect of HS digestion was not significant. The results imply that HA chains act as a cushioning layer to distribute applied forces to the glycocalyx structure. Effective stiffness was also measured for the glycocalyx exposed to 0.1%, 1.0%, and 4.0% BSA. The RICM images indicated that glycocalyx thickness and its compliance increases at higher BSA concentrations. Generally, these results demonstrate that RICM is sensitive enough to detect the subtle changes in glycocalyx stiffness attributable to removal of GAG components in a manner that is complementary to bead-AFM indentation technique.
GRANTS
This work was supported by the National Heart, Lung and Blood Institute Grants (5RO1HL85255 and 5RO1HL84586).
DISCLOSURES
No conflicts of interest, financial or otherwise, are declared by the authors.
AUTHOR CONTRIBUTIONS
Author contributions: K.M.J. performed experiments; K.M.J. analyzed data; K.M.J. prepared figures; K.M.J. and V.H. drafted manuscript; R.O.D. and V.H. conception and design of research; R.O.D. and V.H. interpreted results of experiments; R.O.D. and V.H. edited and revised manuscript; R.O.D. and V.H. approved final version of manuscript.
REFERENCES
- 1. Addae-Mensah KA, Wikswo JP. Measurement techniques for cellular biomechanics in vitro. Exp Biol Med (Maywood) 233: 792–809, 2008 [DOI] [PMC free article] [PubMed] [Google Scholar]
- 2. Banerjee SD, Toole BP. Hyaluronan-binding protein in endothelial cell morphogenesis. J Cell Biol 119: 643–652, 1992 [DOI] [PMC free article] [PubMed] [Google Scholar]
- 3. Bao G, Suresh S. Cell and molecular mechanics of biological materials. Nature Mater 2: 715–725, 2003 [DOI] [PubMed] [Google Scholar]
- 4. Bruinsma R, Behrisch A, Sackmann E. Adhesive switching of membranes: experiment and theory. Phys Rev E Stat Phys Plasmas Fluids Relat Interdiscip Topics 61: 4253–4267, 2000 [DOI] [PubMed] [Google Scholar]
- 5. Callies C, Fels J, Liashkovich I, Kliche K, Jeggle P, Kusche-Vihrog K, Oberleithner H. Membrane potential depolarization decreases the stiffness of vascular endothelial cells. J Cell Sci 124: 1936–1942, 2011 [DOI] [PubMed] [Google Scholar]
- 6. Cooper JA. Effects of cytochalasin and phalloidin on actin. J Cell Biol 105: 1473–1478, 1987 [DOI] [PMC free article] [PubMed] [Google Scholar]
- 7. Costa KD. Imaging and probing cell mechanical properties with the atomic force microscope. Methods Mol Biol 319: 331–361, 2006 [DOI] [PubMed] [Google Scholar]
- 8. Costa KD, Yin FC. Analysis of indentation: implications for measuring mechanical properties with atomic force microscopy. J Biomech Eng 121: 462–471, 1999 [DOI] [PubMed] [Google Scholar]
- 9. Curtis AS. The mechanism of adhesion of cells to glass. A study by interference reflection microscopy. J Cell Biol 20: 199–215, 1964 [DOI] [PMC free article] [PubMed] [Google Scholar]
- 10. Davies PF. Flow-mediated endothelial mechanotransduction. Physiol Rev 75: 519–560, 1995 [DOI] [PMC free article] [PubMed] [Google Scholar]
- 11. Dull RO, Mecham I, McJames S. Heparan sulfates mediate pressure-induced increase in lung endothelial hydraulic conductivity via nitric oxide/reactive oxygen species. Am J Physiol Lung Cell Mol Physiol 292: L1452–L1458, 2007 [DOI] [PubMed] [Google Scholar]
- 12. Ebong EE, Macaluso FP, Spray DC, Tarbell JM. Imaging the endothelial glycocalyx in vitro by rapid freezing/freeze substitution transmission electron microscopy. Arterioscler Thromb Vasc Biol 31: 1908–1915, 2011 [DOI] [PMC free article] [PubMed] [Google Scholar]
- 13. Florian JA, Kosky JR, Ainslie K, Pang Z, Dull RO, Tarbell JM. Heparan sulfate proteoglycan is a mechanosensor on endothelial cells. Circ Res 93: e136–e142, 2003 [DOI] [PubMed] [Google Scholar]
- 14. Gao L, Lipowsky HH. Composition of the endothelial glycocalyx and its relation to its thickness and diffusion of small solutes. Microvasc Res 80: 394–401, 2010 [DOI] [PMC free article] [PubMed] [Google Scholar]
- 15. Georges PC, Miller WJ, Meaney DF, Sawyer ES, Janmey PA. Matrices with compliance comparable to that of brain tissue select neuronal over glial growth in mixed cortical cultures. Biophys J 90: 3012–3018, 2006 [DOI] [PMC free article] [PubMed] [Google Scholar]
- 16. Gingell D, Todd I. Interference reflection microscopy. A quantitative theory for image interpretation and its application to cell-substratum separation measurement. Biophys J 26: 507–526, 1979 [DOI] [PMC free article] [PubMed] [Google Scholar]
- 17. Gönnenwein S. Generic and Specific Cell Adhesion: Investigations of a Model System by Micro-Interferometry—PhD Dissertation. Munchen, Germany: Physik-Department, Technischen Universitat Munchen, 2003, pp. 1–145 [Google Scholar]
- 18. Helmke BP, Thakker DB, Goldman RD, Davies PF. Spatiotemporal analysis of flow-induced intermediate filament displacement in living endothelial cells. Biophys J 80: 184–194, 2001 [DOI] [PMC free article] [PubMed] [Google Scholar]
- 19. Hoffman BD, Crocker JC. Cell mechanics: dissecting the physical responses of cells to force. Annu Rev Biomed Eng 11: 259–288, 2009 [DOI] [PubMed] [Google Scholar]
- 20. Huxley VH, Curry FE. Albumin modulation of capillary permeability: test of an adsorption mechanism. Am J Physiol Heart Circ Physiol 248: H264–H273, 1985 [DOI] [PubMed] [Google Scholar]
- 21. Huxley VH, Curry FE. Effect of superfusate albumin on single capillary hydraulic conductivity. Am J Physiol Heart Circ Physiol 252: H395–H401, 1987 [DOI] [PubMed] [Google Scholar]
- 22. Iwaki M, Ito S, Morioka M, Iwata S, Numaguchi Y, Ishii M, Kondo M, Kume H, Naruse K, Sokabe M. Mechanical stretch enhances IL-8 production in pulmonary microvascular endothelial cells. Biochem Biophys Res Commun 389: 531–536, 2009 [DOI] [PMC free article] [PubMed] [Google Scholar]
- 23. Jacob M, Bruegger D, Rehm M, Stoeckelhuber M, Welsch U, Conzen P, Becker BF. The endothelial glycocalyx affords compatibility of Starling's principle and high cardiac interstitial albumin levels. Cardiovasc Res 73: 575–586, 2007 [DOI] [PubMed] [Google Scholar]
- 24. Janmey PA, McCulloch CA. Cell mechanics: integrating cell responses to mechanical stimuli. Annu Rev Biomed Eng 9: 1–34, 2007 [DOI] [PubMed] [Google Scholar]
- 25. Kamm R, Lammerding J, Mofrad M. Cellular nanomechanics. In: Springer Handbook of Nanotechnology, edited by Bhushan B. New York, NY: Springer, 2010, p. 1171–1200 [Google Scholar]
- 26. Kühner M, Sackmann E. Ultrathin hydrated dextran films grafted on glass: preparation and characterization of structural, viscous, and elastic properties by quantitative microinterferometry. Langmuir 12: 4866–4876, 1996 [Google Scholar]
- 27. Lemons DS, Gythiel A. Paul Langevin's 1908 paper “On the Theory of Brownian Motion”. Am J Physiol 65: 1079, 1997 [Google Scholar]
- 28. Lo CM, Wang HB, Dembo M, Wang YL. Cell movement is guided by the rigidity of the substrate. Biophys J 79: 144–152, 2000 [DOI] [PMC free article] [PubMed] [Google Scholar]
- 29. Lopez-Quintero SV, Amaya R, Pahakis M, Tarbell JM. The endothelial glycocalyx mediates shear-induced changes in hydraulic conductivity. Am J Physiol Heart Circ Physiol 296: H1451–H1456, 2009 [DOI] [PMC free article] [PubMed] [Google Scholar]
- 30. Mathur AB, Truskey GA, Reichert WM. Atomic force and total internal reflection fluorescence microscopy for the study of force transmission in endothelial cells. Biophys J 78: 1725–1735, 2000 [DOI] [PMC free article] [PubMed] [Google Scholar]
- 31. Mehta D, Malik AB. Signaling mechanisms regulating endothelial permeability. Physiol Rev 86: 279–367, 2006 [DOI] [PubMed] [Google Scholar]
- 32. Mochizuki S, Vink H, Hiramatsu O, Kajita T, Shigeto F, Spaan JAE, Kajiya F. Role of hyaluronic acid glycosaminoglycans in shear-induced endothelium-derived nitric oxide release. Am J Physiol Heart Circ Physiol 285: H722–H726, 2003 [DOI] [PubMed] [Google Scholar]
- 33. Neumaier KR, Elender G, Sackmann E, Merkel R. Ellipsometric microscopy. Europhys Lett 49: 14–19, 2000 [Google Scholar]
- 34. O'Callaghan R, Job KM, Dull RO, Hlady V. Stiffness and heterogeneity of the pulmonary endothelial glycocalyx measured by atomic force microscopy. Am J Physiol Lung Cell Mol Physiol 301: L353–L360, 2011 [DOI] [PMC free article] [PubMed] [Google Scholar]
- 35. Oberleithner H, Peters W, Kusche-Vihrog K, Korte S, Schillers H, Kliche K, Oberleithner K. Salt overload damages the glycocalyx sodium barrier of vascular endothelium. Pflügers Arch 462: 519–528, 2011 [DOI] [PMC free article] [PubMed] [Google Scholar]
- 36. Pahakis MY, Kosky JR, Dull RO, Tarbell JM. The role of endothelial glycocalyx components in mechanotransduction of fluid shear stress. Biochem Biophys Res Commun 355: 228–233, 2007 [DOI] [PMC free article] [PubMed] [Google Scholar]
- 37. Prieve D. Measurement of colloidal forces with TIRM. Adv Colloid Interface Sci 82: 93–125, 1999 [Google Scholar]
- 38. Rädler J, Sackmann E. Imaging optical thicknesses and separation distances of phospholipid vesicles at solid surfaces. J Physique II 3: 727–748, 1993 [Google Scholar]
- 39. Rädler J, Sackmann E. On the measurement of weak repulsive and frictional colloidal forces by reflection interference contrast microscopy. Langmuir 8: 848–853, 1992 [Google Scholar]
- 40. Sackmann E. Supported membranes: scientific and practical applications. Science 271: 43–48, 1996 [DOI] [PubMed] [Google Scholar]
- 41. Satcher RL, Dewey CF. Theoretical estimates of mechanical properties of the endothelial cell cytoskeleton. Biophys J 71: 109–118, 1996 [DOI] [PMC free article] [PubMed] [Google Scholar]
- 42. Schilling J, Sengupta K, Goennenwein S, Bausch AR, Sackmann E. Absolute interfacial distance measurements by dual-wavelength reflection interference contrast microscopy. Phys Rev E Stat Nonlin Soft Matter Phys 69: 021901, 2004 [DOI] [PubMed] [Google Scholar]
- 43. Scott JE, Heatley F. Hyaluronan forms specific stable tertiary structures in aqueous solution: a 13C NMR study. Proc Natl Acad Sci USA 96: 4850–4855, 1999 [DOI] [PMC free article] [PubMed] [Google Scholar]
- 44. Scott JE, Thomlinson AM, Prehm P. Supramolecular organization in streptococcal pericellular capsules is based on hyaluronan tertiary structures. Exp Cell Res 285: 1–8, 2003 [DOI] [PubMed] [Google Scholar]
- 45. Simson R, Wallraff E, Faix J, Niewöhner J, Gerisch G, Sackmann E. Membrane bending modulus and adhesion energy of wild-type and mutant cells of Dictyostelium lacking talin or cortexillins. Biophys J 74: 514–522, 1998 [DOI] [PMC free article] [PubMed] [Google Scholar]
- 46. Singleton PA, Bourguignon LYW. CD44 interaction with ankyrin and IP3 receptor in lipid rafts promotes hyaluronan-mediated Ca2+ signaling leading to nitric oxide production and endothelial cell adhesion and proliferation. Exp Cell Res 295: 102–118, 2004 [DOI] [PubMed] [Google Scholar]
- 47. Stevens AP, Hlady V, Dull RO. Fluorescence correlation spectroscopy can probe albumin dynamics inside lung endothelial glycocalyx. Am J Physiol Lung Cell Mol Physiol 293: L328–L335, 2007 [DOI] [PMC free article] [PubMed] [Google Scholar]
- 48. Suresh S, Spatz J, Mills JP, Micoulet A, Dao M, Lim CT, Beil M, Seufferlein T. Connections between single-cell biomechanics and human disease states: gastrointestinal cancer and malaria. Acta Biomater 1: 15–30, 2005 [DOI] [PubMed] [Google Scholar]
- 49. Tarbell JM, Pahakis MY. Mechanotransduction and the glycocalyx. J Intern Med 259: 339–350, 2006 [DOI] [PubMed] [Google Scholar]
- 50. Tarbell JM, Weinbaum S, Kamm RD. Cellular fluid mechanics and mechanotransduction. Ann Biomed Eng 33: 1719–1723, 2005 [DOI] [PubMed] [Google Scholar]
- 51. Thi MM, Tarbell JM, Weinbaum S, Spray DC. The role of the glycocalyx in reorganization of the actin cytoskeleton under fluid shear stress: a “bumper-car” model. Proc Natl Acad Sci USA 101: 16483–16488, 2004 [DOI] [PMC free article] [PubMed] [Google Scholar]
- 52. Vogel V, Sheetz M. Local force and geometry sensing regulate cell functions. Nat Rev Mol Cell Biol 7: 265–275, 2006 [DOI] [PubMed] [Google Scholar]
- 53. Weinbaum S, Tarbell JM, Damiano ER. The structure and function of the endothelial glycocalyx layer. Annu Rev Biomed Eng 9: 121–167, 2007 [DOI] [PubMed] [Google Scholar]
- 54. Wiegand G, Neumaier KR, Sackmann E. Microinterferometry: three-dimensional reconstruction of surface microtopography for thin-film and wetting studies by reflection interference contrast microscopy (RICM). Appl Opt 37: 6892–6905, 1998 [DOI] [PubMed] [Google Scholar]
- 55. Zidovska A, Sackmann E. Brownian motion of nucleated cell envelopes impedes adhesion. Phys Rev Lett 96: 048103, 2006 [DOI] [PubMed] [Google Scholar]
- 56. Zilker A, Ziegler M, Sackmann E. Spectral analysis of erythrocyte flickering in the 0.3–4-μm−1 regime by microinterferometry combined with fast image processing. Phys Rev A 46: 7998–8001, 1992 [DOI] [PubMed] [Google Scholar]
- 57. Zwanzig R, Bixon M. Compressibility effects in the hydrodynamic theory of Brownian motion. J Fluid Mech 69; 21–25, 1975 [Google Scholar]


