

Abstract
Rodents have been widely used to study the environmental or therapeutic impact of inhaled particles. Knowledge of airway morphometry is essential in assessing geometric influence on aerosol deposition and in developing accurate lung models of aerosol transport. Previous morphometric studies of the rat lung performed ex situ provided high-resolution measurements (50–125 μm). However, it is unclear how the overall geometry of these casts might have differed from the natural in situ appearance. In this study, four male Wistar rat (268 ± 14 g) lungs were filled sequentially with perfluorocarbon and phosphate-buffered saline before being imaged in situ in a 7-T magnetic resonance (MR) scanner at a resolution of 0.2 × 0.2 × 0.27 mm. Airway length, diameter, gravitational, bifurcation, and rotational angles were measured for the first four airway generations from 3D geometric models built from the MR images. Minor interanimal variability [expressed by the relative standard deviation RSD (=SD/mean)] was found for length (0.18 ± 0.07), diameter (0.15 ± 0.15), and gravitational angle (0.12 ± 0.06). One rat model was extended to 16 airway generations. Organization of the airways using a diameter-defined Strahler ordering method resulted in lower interorder variability than conventional generation-based grouping for both diameter (RSD = 0.12 vs. 0.42) and length (0.16 vs. 0.67). Gravitational and rotational angles averaged 82.9 ± 37.9° and 53.6 ± 24.1°, respectively. Finally, the major daughter branch bifurcated at a smaller angle (19.3 ± 14.6°) than the minor branch (60.5 ± 19.4°). These data represent the most comprehensive set of rodent in situ measurements to date and can be used readily in computational studies of lung function and aerosol exposure.
Keywords: airway resistance, dichotomy, monopodial branching
a comprehensive description of lung geometry is often required to accurately model pulmonary airflow and aerosol particle deposition. Both flow and particle transport are influenced by airway length, diameter, as well as bifurcation, gravitational and rotational angles (3, 23). Such geometric descriptions are not only useful for studies of airflow and/or particle deposition in three-dimensional (3D) numerical models, but they are also applicable in multiscale approaches. Recently, Comerford et al. (4) predicted airflow in a subject-specific model of the human large airways by coupling a 3D airway model to a 1D model of small airways using an impedance boundary condition. Impedance was calculated based on airway morphometric measurements (16). In blood flow simulations, both simple 0D resistance and Windkessel (resistance and capacitance) models as well as more sophisticated closed-loop lumped parameter networks (17) have been used in multiscale models of the cardiovascular system (33). Similar approaches could potentially be applied to model functional parameters in the pulmonary airways. Knowledge of airway resistance and impedance is essential in the study of lung mechanics in both health and disease (2, 8). Furthermore, accurate morphometric measurements of the large and small airways can improve the precision of impedance and resistance calculations and therefore improve multiscale coupling in numerical models and/or aid in characterization of disease states.
Rats have been widely used in experimental deposition studies (24, 35) and in studies aimed at understanding the influence of particle composition on lung pathology (7, 26) as well as aiding in the development of drugs delivered as aerosols (XX). Therefore, an improved understanding of the rat 3D airway morphometry may establish links between aerosol deposition and airway geometry. Previous studies of rat airway morphometry have used casting methods, or excised lungs, and leave some doubt as to whether the geometric angles of the airways represented in these casting or ex vivo lungs represent a realistic in situ state. Raabe et al. (25) performed a complete morphometric analysis of the rat lung using silicone casts that were imaged by electron microscopy. Yeh et al. (36) measured the morphometric parameters from a single silicone rat lung cast to develop a typical path lung model. Rodriguez et al. (27) found that the number of generation of conducting airways varies in the different lobes of the rat lung, with the lower lobes containing more airway generations than the upper lobes. For example, in the right upper (apical) lobe, conducting airways branch over a range of 8 to 25 generations, with an average of 15 generations, whereas in the right lower (diaphragmatic) lobe, airways ranged from 13 to 32 generations.
The use of high-resolution 3D imaging techniques, such as CT and MRI, has the advantage of obtaining 3D datasets that may be analyzed more efficiently than the tedious reconstruction of data collected serially in two dimensions. By using micro-CT, de Backer et al. (1) imaged the upper respiratory tract and thoracic cavity of Sprague-Dawley rats, and Sera et al. (29) showed that for generations 8–16, airway diameter and length decrease exponentially with each generation. Einstein et al. (6) used magnetic resonance imaging, and Lee et al. (12) used CT to obtain detailed images of rat lung silicone casts. With these data, Einstein et al. (6) performed self-similarity analysis of the behavior of airway diameter and length as a function of path length, but did not extend this analysis to obtain bifurcation and gravitational angles. Lee et al. (12) performed a detailed analysis of morphometric data for six rats and argued that there was little intersubject variability among the animals. However, a large variability was seen between airway generations in the intravariability analysis.
This paper presents the first comprehensive set of in situ 3D morphometric measurements of Wistar rat lungs obtained from MR images. The goals of this study were to 1) compare this in situ morphometry to previous measurements taken from excised airway casts, 2) determine the variability between animals of the same strain and weight, and 3) provide all the morphometric measurements needed to fully describe the airways down to an image resolution and to spatial organization that is physiologically relevant.
METHODS
Animal Preparation
This study protocol was approved by the University of California San Diego Institutional Animal Care and Use Committee (IACUC). Four healthy male Wistar rats (268 ± 14 g) were analyzed. The method for preparing and imaging of the lungs in situ has been described previously for mice (28). Animals were deeply anesthetized with pentobarbital sodium (60 mg per kg of body wt ip) and tracheostomized with a 15-gauge plastic cannula. Animals were injected (ip) with heparin (500 units) and 2 ml of gadolinium dimeglumine (Magnevist, Schering, Germany) to ensure a high level of contrast between the lung tissues and blood and the airways during imaging. Animals were ventilated for 10 min with 100% O2 at an airway pressure of 10 cmH2O and then euthanized with a second dose of pentobarbital sodium (60 mg per kg of body wt ip) and instilled at a 45° angle. The lungs were first primed with a small amount of PBS, then filled with perfluorocarbon (PFC; Fomblin Solvay Solexis, Thorofare, NJ) to an airway pressure of 9 cmH2O and finally filled with 0.05% low-melt agarose in PBS (NuSieve Agarose, Cambrex, Rockland, ME) to a final airway pressure of 20 cmH2O. This resulted in an approximate 70:30 ratio of PFC/PBS. The cannula was capped and the animals were immediately transferred to the MR scanner for imaging.
MR Imaging
The lungs were imaged in situ in a 7T small animal MR scanner (Bruker Biospin WI) using a custom built Quadrature volume MR imaging coil. T2-weighted coronal images were acquired using a Turbo-RARE 3D pulse sequence with TR/TE = 1,500/43 ms and FA =180°. The image matrix was 256 × 256 × 128, which generated a voxel dimension of 0.2 × 0.2 × 0.27 mm. Each MR scan took ∼1 h and 40 min. The resulting images had a high level of contrast between the airways (PFC filled: dark) and the surrounding tissue (gadolinium: bright) (28).
3D Airway Construction
Three-dimensional airway models were created from the MR images using a custom version of the open source software, SimVascular (simtk.org) (32), which has been used extensively for cardiovascular model construction in previous studies (15, 33). The procedure involved drawing centerline paths interpolated with splines (Fig. 1A), segmenting contours perpendicular to the path (Fig. 1B), and lofting segmentations to create a 3D geometric model (Fig. 1C).
Fig. 1.
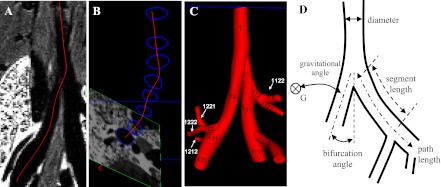
Airway models were constructed by drawing lines through each airway (A), outlining the airway perpendicular to the centerlines (B), and lofting the contours to create the 3D model (C). D shows the measurements taken for each airway model.
Each centerline began at its initial bifurcation point and followed the images through each major daughter bifurcation until the limits of image resolution were reached. Centerlines for each minor branch were created similarly until the entire 1D airway tree was defined. Segmentations spaced a few voxels apart were drawn perpendicular to the centerlines for all airways with a diameter greater than two pixels. Most airway segments contained at least three segmentations, except for airways with a length of less than 6 pixels. All segmentations were lofted together to create the final 3D geometry. Creating the geometry manually removed complications that arise in automated segmentation techniques, i.e., extra faces, holes, and undesired merging of pulmonary vasculature and airways.
All airways were named with a unique numeric string following the binary numbering scheme rules given by Phalen et al. (22). The string began at the trachea with the number 1. At each bifurcation a number was added to the end of the string: 1 for the major daughter and 2 for the minor daughter (Fig. 1C). A few triple bifurcations were encountered, and in this case a 3 was added to the airway with the smallest diameter.
Morphometry Measurements
By using custom software developed in Matlab, segment and path length, hydraulic diameter, minimum, mean and maximum radiuses, bifurcation, gravitational and rotational angles were measured for each segment independently from the centerlines and segmentations created in SimVascular (Fig. 1C). Each segmentation was discretized into 50 points, and each centerline was discretized into 50 to 100 points depending on its length.
Length measurements.
Each segment length was calculated by summing the distance between neighboring points on the centerline within the segment. Airway path length, defined by the distance between the main carina and the end of the airway segment, was then calculated by summing the lengths of all the segments included in the path. Consequently, the length measurements included the airway curvature.
Cross-section analysis.
The hydraulic diameter D was measured for each segmentation and was defined as
where A and C are the area and circumference of the segmentation, respectively. The segmentation's area A, i.e., the cross section of the segment, was calculated by trapezoidal integration as follows
where xi and yi are the local 2D coordinates of each point on the segmentation. The circumference C was calculated by summing the distance between each point on the segmentation.
Minimum, mean, and maximum radii were defined as the minimum, mean, and maximum distance between the centroid of the contour and its perimeter. The deviation of the airway's cross section from a perfect circle was then characterized by its eccentricity
where rmin is the minimum radius and rmax is the maximum radius. For a circular cross section, rmin = rmax and e = 0. The more the eccentricity increases the more the cross section diverges from a perfect circle.
Angles.
The bifurcation angle between a parent and daughter segments was calculated by
where p and d are the parent (p) and daughter (d) vectors and were defined by the beginning and ending points of the segments, l is the length of the vectors, and·denotes the dot product between the two vectors.
The gravitational angle was calculated for each segment by
where g is the gravitational unit vector for a rat in the prone position and d is the daughter vector being analyzed.
Finally, the rotational angle was defined as the angle between two successive bifurcation planes. By using airway 11 as an example (Fig. 1C), the rotational angle was calculated from the normal vectors of the planes defined from airways 1, 11, 12 and airways 11, 111, 112. The rotational angle was specified to be between 0 and 90°.
Morphometric measurements were calculated for all four animals for the first four airway generations. The interanimal variability was assessed by calculating the relative standard deviation (RSD) between the four animals, where RSD was defined as the standard deviation divided by the mean.
Because little interanimal variability was found (see results), lung images from a single animal were used to create a more extended 3D model that included all airways identified in the images. Morphometric measurements from the extended model were organized based on airway generation. RSD was used to determine inter- and intrageneration variability.
Order Analysis
The morphometric data from the extended model were also organized using an ordering scheme (11). Such organization facilitates the calculation of physiologically relevant parameters such as airway resistance and impedance (30). The diameter-defined Strahler procedure outlined by Jiang et al. (11) was used because it is applicable to monopodial airways. In this procedure we first define the airway order using the Strahler ordering scheme and then correct each airway order based on its diameter. The Strahler scheme was applied by starting from the terminal airways and working backward to the trachea (31). Each terminal airway was assigned an order of 1. All other airways were assigned an order based on the order of their respective daughter branches. If both daughter branches were of the same order i, then the parent branch was assigned an order of i+1; if the order of the two daughter branches differed, then the parent branch was assigned the same order as the highest ordered daughter.
An iterative process was then employed to adjust the Strahler order based on each airway's diameter following previous work (11). First, the average and standard deviation of the diameter of all the segments within each order was calculated. Next, an upper and lower limit for the diameters in each order was determined by applying the following equations
where n is the order number, D is the average diameter and SD is the standard deviation of the diameter within that order (11). Each segment was assigned a new order based on these new limits. The correction procedure was performed iteratively until the values of D1′ and D2′ converged to within 1%.
Sequential airway segments of the same order were combined to create an element (11). The diameter of an element was calculated as the average of the diameters of the segments making up the element, and the length was calculated as the sum of the segment lengths. In an electrical analogy, each element represents a single resistor. The combination of all the elements in the airway tree may be used to calculate the tree's total resistance and/or impedance. Following Jiang et al. (11), we defined a connectivity matrix describing the organization of the airway circuit. The columns and rows of the connectivity matrix contained the order of the daughter and parent elements, respectively. A component in the mth row and the nth column represents the average number of elements of order m that grow out of the elements of order n. For example, the value in row 2 and column 3 was calculated by summing the number of 2nd order branches that originated from 3rd order branches and dividing by the total number of 3rd order branches.
Lobar Volume
Finally, the image dataset of each animal was analyzed with Amira software (Template Graphic Software, San Diego, CA) to determine lobar volumes. Volumes were calculated by multiplying the number of voxels within each lobe by the volume of a voxel.
RESULTS
Interanimal Variability
The morphometric measurements made on the four rats used in this study are displayed in Fig. 2. Airway path length (Fig. 2A), hydraulic diameter (Fig. 2B), bifurcation (Fig. 2C), and gravitational angles (Fig. 2D) are shown for the first four generations of the respiratory tract and compared with measurements made on a lung cast of a female Long-Evans rat by Raabe et al. (25). The cast was made of silicone rubber prepared by an in situ technique to replicate the normal lobar orientation and conducting airway sizes at a volume corresponding to end inspiration (25).
Fig. 2.
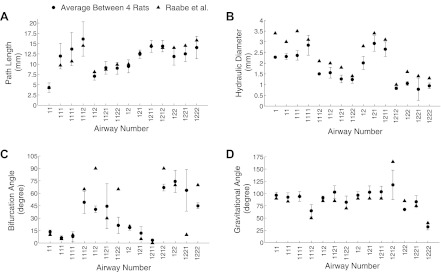
Path length (A), hydraulic diameter (B), bifurcation angle (C), and gravitational angle (D) averaged between the 4 airway models, with the error bars being the standard deviation.
There was good agreement for both path lengths and gravitational angles between the two studies (Fig. 2, A and D), whereas hydraulic diameters from this study were consistently smaller than Raabe's data (Fig. 2B). Finally, there were large differences in bifurcation angles between the two studies (Fig. 2C).
Figure 3 illustrates the inter-animal variability as characterized by RSD for path length (Fig. 3A), hydraulic diameter (Fig. 3B), bifurcation (Fig. 3C), and gravitational angles (Fig. 3D). There was little variability between animals for path length (RSD = 0.18 ± 0.07, mean ± SD), hydraulic diameter (0.15 ± 0.15), and gravitational angle (0.12 ± 0.06). Measurements of bifurcation angles show higher variability (0.32 ± 0.22) most likely because the curvature of the airways makes angle measurements more challenging.
Fig. 3.
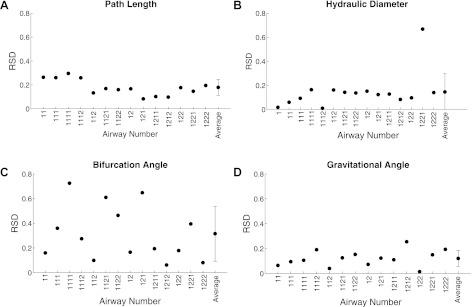
Interanimal variability as characterized by relative standard deviation (RSD) for path length (A), hydraulic diameter (B), bifurcation angle (C) and gravitational angle (D) for the 4 rats.
The minimum and maximum radius value for each contour was normalized by its mean value. The normalized minimum radius ranged from 0.9 to 0.93, and the normalized maximum radius ranged from 1.06 to 1.12. Average eccentricity was calculated to be 0.54 ± 0.04, indicating that the airways have a consistent elliptical shape. Segments did become more elliptic as they reach a bifurcation; however, the elliptical shape appeared far from the bifurcation and throughout the entire airway.
Lobar Volume
Lobar volumes are listed in Table 1 for the four rats. Data are shown in absolute values (mean ± SD, ml) and as a percentage of total lung volume to allow for comparison with previous studies of Raabe et al. (25) and Yeh et al. (36).
Table 1.
Lobar volume distribution
| Volume, ml |
Fraction of Total Lung Volume, % |
|||
|---|---|---|---|---|
| Current study (N = 4) | Current study (N = 4) | Raabe et al. (25) | Yeh et al. (36) | |
| Right apical | 1.27 ± 0.14 | 11.0 ± 1.16 | 10.4 | 9.2 |
| Right diaphragmatic | 3.25 ± 0.14 | 28.0 ± 1.02 | 28.8 | 31.8 |
| Right intermediate | 1.56 ± 0.06 | 13.5 ± 0.36 | 13.9 | 13.3 |
| Right cardiac | 1.35 ± 0.06 | 11.6 ± 0.51 | 12.1 | 12.5 |
| Left lung | 4.15 ± 0.09 | 35.9 ± 1.3 | 34.8 | 33.3 |
| Right lung (all lobes) | 7.42 ± 0.25 | 64.1 ± 1.3 | 65.2 | 66.8 |
| Total lung | 11.57 ± 0.16 | |||
Values are the average ± SD. N, number of animals.
Extended Airway Model
The extended model built from MR images from a single animal is shown in Fig. 4 and includes up to 16 airway generations and 81 terminal branches. The diameter of the minor daughter branches decreased below the limits of image resolution more proximally than that of the major daughter branches. Therefore, it was not possible to determine the airway diameter in the most distal generations for all airways. As a result, the first five generations account for all airways in the model.
Fig. 4.

Extended airway model with the main lobar bronchi identified.
Morphometric measurements (mean ± SD) from the extended model are shown in Fig. 5 as a function of airway generation for hydraulic diameters (Fig. 5A), segment length (Fig. 5B), gravitational angles (Fig. 5C), and rotational angles (Fig. 5D). Bifurcation angles for both major and minor airways are shown in Fig. 6. These measurements were compared with available data from previous studies (12, 25). Raabe et al. (25) reported length, diameter, bifurcation, and gravitational angles for each airway individually, and only data from the same airways as those identified in the present study are used in the comparison in Figs. 5 and 6. Lee et al. (12) reported airway length diameter and rotational angle averaged for each generation and mean values were used in the comparison. Hydraulic diameters were systematically smaller than Raabe's and Lee's data, whereas there was more variability between the datasets for segment length.
Fig. 5.

Average hydraulic diameter (A), segment length (B), gravitational angle (C); and rotational angle (D) for each generation of the single extended airway model. Each airway's diameter, length, and gravitational measurements were compared with data provided in Raabe et al. (25). Only the first 5 generations for diameter and length were compared with the average values reported by Lee et al. (12). Mean rotational angles for all generations were compared with Lee et al.
Fig. 6.

Bifurcation angles for major and minor airways of the single extended model compared with measurements by Raabe et al. (25).
The RSD within each generation's diameter was on average 0.39; our measurements, 0.42 ; Raabe et al. (25) and the RSD for airway length was 0.67; our measurements, 0.5; Raabe et al. (25). The high RSD indicated that there was a high variability in the diameter and length within each generation.
Gravitational (Fig. 5C) and rotational angles (Fig. 5D) remained relatively constant across generations and agreed well with previous studies. Averaged over all airways, gravitational angle was 82.9 ± 37.9° compared with 85.1 ± 35.6° in Raabe et al.'s study (25), and rotational angle was 53.6 ± 24.1° compared with 50.6 ± 20.4° in Lee et al.'s study (12). Figure 6 shows the bifurcation angles for each airway generation with the major daughter bifurcating at a smaller angle (19.3 ± 14.6°) than the minor daughter branch (60.5 ± 19.4°).
The diameter of the major and minor airways at each path length from the main carina is shown in Fig. 7 for each lobe in the right lung (Fig. 7, A-D) and for the left lung (Fig. 7E). Three diameter measurements at different locations within the segment were taken for each airway segment, except for short airways (less than a few pixels in length) for which only one or two measurements were made. Unlike the other lobes, the apical lobe branches dichotomously, as shown by similar major and minor branch diameters.
Fig. 7.

Airway diameter as a function of path length from the main carina for the 4 lobes in the right lung for the single expanded airway model. Major and minor airways are shown separately.
Order Analysis
The extended model contains five diameter-defined Strahler orders (11). The resulting segment and element diameter determined by the iterative process is shown in Fig. 8A. Table 2 and Fig. 8 give the average diameter and length for the major and minor branches in each order. The average segment and element diameter increases with order (Fig. 8A); a RSD of 0.12 ± 0.05 indicates low intraorder variability for segment diameter. The major and minor segment had similar lengths; except for order four segments (Fig. 8B). The RSD for length was 0.16 ± 0.16 and the order four segments have the highest intraorder variability. There are order five segments in between order four segments because the rat airways increase in diameter in the first generations. The number of elements for each order and their average diameter and length are given in Table 3. Depending on their location in the airway tree, elements are either a series of multiple segments or just one segment.
Fig. 8.

Order analysis. A: diameter as a function of order number (diameter increases as order number increases) for both the segments and the elements. B: segment lengths for major and minor airways as a function of order.
Table 2.
Segment diameter and length for major and minor airways of each order
| Major Airway |
Minor Airway |
|||||||||
|---|---|---|---|---|---|---|---|---|---|---|
| Diameter (mm) | Length (mm) | Diameter (mm) | Length (mm) | |||||||
| Order | Average | SD | Average | SD | Nseg | Average | SD | Average | SD | Nseg |
| 1 | 0.45 | 0.06 | 0.24 | 0.54 | 44 | 0.44 | 0.06 | 0.25 | 0.55 | 34 |
| 2 | 0.72 | 0.10 | 1.22 | 1.09 | 39 | 0.75 | 0.12 | 1.32 | 1.11 | 24 |
| 3 | 1.29 | 0.20 | 2.68 | 1.87 | 17 | 1.23 | 0.25 | 1.77 | 1.09 | 9 |
| 4 | 2.22 | 0.07 | 1.44 | 1.31 | 5 | 2.08 | 0.15 | 5.36 | 3.68 | 4 |
| 5 | 2.50 | 0.16 | 1.08 | 1.02 | 4 | 2.70 | 0.00 | 2.01 | 0.00 | 1 |
Nseg, number of segments.
Table 3.
Element diameter and length for each order
| Diameter (mm) |
Length (mm) |
||||
|---|---|---|---|---|---|
| Order | Average | SD | Average | SD | Nelem |
| 1 | 0.45 | 0.06 | 0.31 | 0.75 | 62 |
| 2 | 0.72 | 0.09 | 2.31 | 1.75 | 35 |
| 3 | 1.26 | 0.16 | 6.15 | 3.04 | 11 |
| 4 | 2.15 | 0.13 | 6.29 | 4.24 | 5 |
| 5 | 2.54 | 0.15 | 3.16 | 1.82 | 3 |
Nelem, number of elements.
The connectivity matrix is given in Table 4; the values are the number of daughter branches of each row order springing from parent elements of each column order, divided by the total number of branches in the column order. For example, the value 1.343 was calculated by dividing the total number or order one elements coming from order two elements, 47, by the total number of order two elements, 35. As shown by the values in the matrix diagonal, some elements of the same order may be connected in parallel if the minor and major branches have the same order. The value 0.4 in the lower triangle of the matrix shows that there are order five elements coming from order four elements.
Table 4.
Connectivity matrix of elements in airway tree
| Parent Element Order |
||||||
|---|---|---|---|---|---|---|
| 1 | 2 | 3 | 4 | 5 | ||
| Daughter element order | 1 | 0.016 | 1.343 | 1.273 | 0 | 0 |
| 2 | 0 | 0.171 | 2 | 0.8 | 0.667 | |
| 3 | 0 | 0 | 0.091 | 1.4 | 0.667 | |
| 4 | 0 | 0 | 0 | 0 | 1.333 | |
| 5 | 0 | 0 | 0 | 0.4 | 0 | |
Values are number of elements in order m splitting from number of elements in order n, divided by the total number of elements in each order.
DISCUSSION
Despite numerous previous studies of conducting airway morphometry, none of these studies have included all measurements needed to describe the airways three dimensionally. Most airway measurements were collected from excised silicone lung casts imaged by electron microscopy (25) or from CT (12, 29, 36) or MRI (6). Excellent contrast between the silicone airways and the background material resulted in a high image resolution [Lee et al. = 43 μm (12) and Einstein et al. = 125 μm (6)]. However, because imaging was performed ex vivo, there is a danger that the casts may have deformed from their original physiological in situ shape. In situ airway imaging in the Sprague-Dawley rat has been previously performed using micro-CT (1); however, this study only captured the first few airway generations. Ideally, a 3D airway atlas should include airway diameter, length, gravitational, bifurcation, and rotational angles taken from lungs in their most natural state at the highest resolution possible. The present study provides all relevant geometric measurements taken from in situ lungs of Wistar rats at a greater resolution than previous in situ studies. Airway variability between rats of similar weight was first analyzed for the first four generations of conducting airways. Next, measurements for up to 16 airway generations were compared with morphometric data from previous studies (12, 25). Last, the highly monopodial airways were organized based on a diameter-defined Strahler ordering scheme (11).
Interanimal variability.
Recently, patient or animal-specific 3D airway models have been used to study lung mechanics, airflow, and particle deposition using computational methods (4, 13, 34, 37). Because the accurate description of airway morphometry is laborious and time intensive, subject-specific models need only be developed when intersubject variability is high. By using solid casts of eight human lungs, Nikiforov and Schlesinger (20) previously measured the length, diameter, and branching angle of the first nine generations of conducting airways by measuring directly from the cast, and showed high intersubject variability in their measurements. The RSD of length, diameter, and branching angle was 0.42 ± 0.11, 0.31 ± 0.8, and 0.76 ± 0.30, respectively. These results strongly advocate for the use of subject-specific models of the human lung. In contrast, the much lower interanimal variability between the Wistar rat lung shown by our and previous results suggests that generic airway models may reliably be used in computational or lung mechanics studies of healthy rats of similar size. These findings agree with previous studies that also showed low interanimal variability for same weight, strain, and sex (16).
Sensitivity analysis.
An analysis was performed to assess user sensitivity of creating the morphometric models. An independent operator created and measured the airway path length and diameter of one of the rats used in the interanimal variability study. All diameter and path length measurements were within one standard deviation measured between the four rats (see Fig. 2). Additionally, the average difference between the mean values of Fig. 2, were 8.1 and 8.8% for the diameter and path length, respectively. The operator sensitivity was small and therefore was assumed to be insignificant.
Extended airway model.
Traditionally, airway tree dimensions have been organized based on generation number (16, 29). Generation organization offers a straightforward technique with which the morphometric data from several different studies may be easily compared. Our results confirmed the expected finding that airway diameter and length decreased with increasing generation number (Figs. 5, A and B). However, the variability of measurements within each generation was high and often larger than the intergeneration variability (Figs. 5, C and D). The large intrageneration variability suggests that generation organization may not be the most appropriate method to describe rat airways.
The rat airway tree exhibits both monopodial and dichotomous branching characteristics depending on the branch location in the airway tree. The branches springing from the lobar bronchus have a smaller diameter than their major sibling (Fig. 4) for the left, diaphragmatic, cardiac, and intermediate lobes. However, the differences between daughter branches are smaller toward the periphery of the lobe, and as a consequence the branching pattern there becomes more dichotomous. In contrast, the apical lobe exhibits a dichotomous branching pattern from the lobar bronchus.
Comparison with Previous Studies
We observed relatively good agreement between our data and measurements from Raabe et al. and Lee et al. (Figs. 2 and 5). The generation average diameters for the extended model were 36.6 ± 11.4% smaller than Raabe et al.'s measurements and 22.1 ± 6.7% smaller than Lee et al. for the first seven generations (Fig. 5A). Raabe et al. (25) used a silicone cast of a 330-g female Long Evans rat at approximately TLC. This casting procedure caused the diameters of the major bronchi to increase by ∼15% (25). Lee et al.'s measurements were taken on 302-g Sprague-Dawley rats at an airway pressure of 30 cmH2O. Trachea diameter has been previously shown to increase with airway pressure (28). The different techniques, different airway pressure, and larger animal weight likely explain the higher values measured in these previous studies compared with data from the present study. Segment lengths matched well with the previous studies (Fig. 5B); however, our measurements were slightly longer for most generations. Our length measurements included airway curvature, whereas previous studies only measured the linear length of the airway, and therefore this may have contributed to the longer lengths measured. Gravitational and rotational angle measurements agreed well with previous studies, whereas bifurcation angle did not. The average gravitational angle was 2.6% smaller than Raabe et al. and the average rotational angle was 5.9% larger than Lee et al. Because Lee et al. reported a possible error of 6 to 7% in their angle measurements due to deformation of the cast while scanning, this provides a possible explanation for this difference. Our measured bifurcation angles (Fig. 6) were 36.7% larger than those of Raabe et al. for the major airway and 4.6% smaller than those of Raabe et al. for the minor airways. Raabe et al. reported a 0 bifurcation angle for many of the major bifurcations; however, a bifurcation angle was found for all airways in this study and therefore explains the high difference between the numbers reported here and the number reported by Raabe et al.
Our results for percent lobe volume agreed well with data of Raabe et al. (25) and Yeh et al. (36) (Table 1), with an average difference of 9.3% compared with values reported by Yeh et al. and an average difference of 3.7% compared with values reported by Raabe et al.
Order organization.
The diameter defined Strahler ordering scheme (11) was applied to the extended airway model to provide an alternate method for organizing the morphometric data that better allows for high intrageneration variability and missing airways due to the limitation in the image resolution. Incorporating both airway diameter and location in the airway tree ordering system allows us to obtain lower intraorder variability compared with ordering with diameter alone. Additionally, the increased variability found in the fourth-ordered segments (Fig. 8) is likely the result of the nonmonotonic decrease of airway diameter from the trachea to the peripheral airways. Typically, in this type of order analysis, there would be only one segment of the highest order (order 5 in this case). However, because the diameter of the airways increases in the main bronchi before monotically decreasing with increasing generation number (6), six order five segments were measured.
A connectivity matrix describes the branching of the airway tree based on the number and order of the elements. The upper diagonal of Table 4 shows that most of the elements of order n branch from parent elements order n + 1. When daughter branches are of the same order as the parent branch, this appears as a diagonal entry in the connectivity matrix. Typically, daughter elements do not have a higher order than their parent element; however, due to increasing diameter in the major right and left bronchi, there were order five elements springing from order four elements.
Physiological Relevance
An extended geometric description of the airways is highly desirable for accurate predictions of airflow and particle deposition. Airway dimensions and angle measurements are needed to solve equations that govern fluid dynamics or particle physics. The inclusive dataset provided here can be used to construct typical 3D rat airway trees for use in future computational studies.
Airway resistance, a physiological measure of pressure drop for a given flow rate, may be used to aid in airway disease diagnostics (2, 8). Also, airway resistance may be used as a downstream boundary condition in numerical models (31). Assuming Poiseuille flow, airway resistance may be calculated for each airway using
where μ is the fluid viscosity, l is the length of the segment, and d is the diameter of the segment. The resistance for airways in series is additive. The resistance for airways in parallel is the inverse of the sum of the inverse of the resistances. The total resistance in the rat airways for the bronchioles that this model represents, was calculated by summing the resistance of each airway. The resistance calculated using the exact tree structure was compared with the estimated resistance computed using the average lengths and diameters, and the airway tree described by the connectivity matrix (30). The total resistance was 0.0046 cmH2O·s−1·ml−1 and the approximate resistance was 0.0039 cmH2O·s−1·ml−1. The small difference (less than 15%) demonstrates the usefulness of the connectivity matrix in estimating relevant physiological parameters.
Airway resistance in Wistar (19) and Fischer (5) rats has been previously measured using the alveolar capsule technique. Nagase et al. (19) found the airway resistance to be 0.066 ± 0.010 cmH2O·s−1·ml−1 and Dolhnikoff et al. (5) found the airway resistance to be 0.051 ± 0.012 cmH2O·s−1·ml−1. Both of these studies found the airway resistance to be larger than what was found using the morphometric data. However, the resistance calculated with the morphometric data only includes Poiseuille resistance and not the additional resistance that occurs in the presence of bifurcating airways. Pedley et al. (21) described the resistance for a bifurcating system to be
where Rp is the Poiseuille resistance, C is a constant, 1.85, Re is the Reynolds number, d is the diameter of the airway, and L is the length of the airway. Using the experimental breathing conditions given by Nagase et al. (19) (tidal volume of 9 ml/kg, breathing frequency of 60 breaths/min), the morphometric data of our extended rat model and applying Pedley's equation, the resistance was found to be 0.0489 cmH2O·s−1·ml−1. Decreasing and increasing the airway diameter throughout the model by 5% resulted in a calculated resistance of 0.060 and 0.0402 cmH2O·s−1·ml−1, respectively. Assuming an isotropic expansion of the lung, a decrease in airway diameter of 5% would result in a decrease in lung volume of ∼40%. Our airway model is based on images of lungs inflated at an airway pressure of 20 cmH2O, which is close to total lung capacity. Reducing the lung volume by 40% from total lung capacity would result in lung volumes similar to those occurring during tidal breathing, i.e., to those encountered in Nagase et al. (19) and Dolhnikoff et al. (5) studies. The calculated resistance for the model with decreased airway diameter agrees well with those experimentally measured by the alveolar capsule technique.
Limitations
The rat airways were measured inside the thoracic cavity from in situ MR images. Although in situ imaging offers the advantage of obtaining measurements from lungs in their most natural state, such approach resulted in images with a smaller resolution than previous studies have obtained with lung casts (6, 12). The voxel size (0.2 × 0.2 × 0.27 mm) was chosen such that there was sufficient tissue to airway contrast. This resolution limited measurements to airways with a diameter larger than 0.4 mm, with a potential measurement error of 33%. To obtain the in situ images, the lungs were first filled with a contrasting fluid to avoid air/tissue artifacts and to be able to identify the airways in the images. In most cases the lung filled uniformly, except for the periphery of the diaphragmatic and intermediate lobes. The uneven filling resulted in a limited amount of contrast, which made it difficult to identify some of the peripheral airways in these lobes. The liquid-filled lungs may have expanded the lungs more than air-filled lungs; however, this expansion is likely to be less than in silicone-filled lungs that are traditionally used in morphometric studies. Silicone has a larger viscosity than the PBS and agarose mixture used in this study and therefore requires a larger pressure force to fill the lungs (6). Silicone-filled lungs may thus be artificially more overexpanded than liquid-filled lungs.
Errors in defining the bifurcation end point location may be present due to the difficulty in determining the exact bifurcation location of the airways from the MR images. In an attempt to decrease uncertainty, we also measured bifurcation angles using end points at mid-lengths of the daughter branches; however, this did not reduce our variability as measured by RSD (Fig. 2). The 3D airway trees were manually segmented from the MR images and additional uncertainties may arise from noise in image data. Despite these limitations, the airways were accurately described both geometrically and spatially, and findings agreed well with previously reported data.
It should be noted that airway disease may alter the morphometry of the lung and that these alterations are likely to be heterogeneously distributed among airways. A previous study by Lee et al. (12) demonstrated the importance of airway-to-airway comparison between animals in characterizing the influence of air pollutants on lung development. It is also known that bronchial airway diameter decreases with asthma (18) and COPD (9); however, the heterogeneous distribution has not been fully investigated.
Summary
This paper is the first to present in situ morphometric measurements from MR images for airway diameters greater than 0.4 mm in healthy Wistar rat lungs. The little interanimal variability found in the first four airway generations strongly suggests that a generic model can adequately describe the airway morphometry of rats of similar size. Measurements from this study matched previous studies for airway length, gravitational, minor bifurcation, and rotational angles. However, the major bifurcation angles were larger than the previous studies and the airway diameters were smaller than in previous studies. The rat lungs proved to have both dichotomous and monopodial characteristics, depending on the lobe and location in the lung. Organizing the measurements using the diameter-defined Strahler ordering scheme resulted in low intraorder variability for airway lengths and diameters and proved to be a useful tool to calculate physiological parameters such as lung resistance.
GRANTS
The study was funded by National Heart, Lung, and Blood Institute Grant 1R21HL087805, a Burroughs Wellcome Fund at the Scientific Interface, and a National Science Foundation Graduate Fellowship (to J. M. Oakes). Software was provided by the open source SimVascular project at simtk.org.
DISCLOSURES
No conflicts of interest, financial or otherwise, are declared by the authors.
AUTHOR CONTRIBUTIONS
Author contributions: J.M.O., M.S., E.C.B., and C.D. performed experiments; J.M.O. and M.S. analyzed data; J.M.O., A.L.M., and C.D. interpreted results of experiments; J.M.O. prepared figures; J.M.O. drafted manuscript; J.M.O., E.C.B., A.L.M., and C.D. edited and revised manuscript; J.M.O., E.C.B., A.L.M., and C.D. approved final version of manuscript; C.D. conception and design of research.
REFERENCES
- 1. De Backer JW, Vos WG, Burnell P, Verhulst SL, Salmon P, De Clerck N, De Backer W. Study of the variability in upper and lower airway morphology in Sprague-Dawley rats using modern micro-CT scan-based segmentation techniques. Anat Rec 292: 720–7, 2009 [DOI] [PubMed] [Google Scholar]
- 2. Bates JHT, Suki B. Assessment of peripheral lung mechanics. Respir Physiol Neurobiol 163: 54–63, 2008 [DOI] [PMC free article] [PubMed] [Google Scholar]
- 3. Cai FS, Yu CP. Inertial and interceptional deposition of spherical particles and fibers in a bifurcating airway. J Aerosol Sci 19: 679–688, 1988 [Google Scholar]
- 4. Comerford A, Förster C, Wall AW. Structured tree impedance outflow boundary conditions for 3D lung simulations. J Biomech Eng 132: 081002, 2010 [DOI] [PMC free article] [PubMed] [Google Scholar]
- 5. Dolhnikoff M, Mauad T, Ludwig MS. Extracellular matrix and oscillatory mechanics of rat parenchyma in bleomycin induced fibrosis. Am J Respir Crit Care Med 160: 1750–1757, 1999 [DOI] [PubMed] [Google Scholar]
- 6. Einstein DR, Neradilak B, Pollisar N, Minard KR, Wallis C, Fanucchi M, Carson JP, Kuprat AP, Kabilan S, Jacob RE, Corley RA. An automated self-similarity analysis of the pulmonary tree of the Sprague-Dawley rat. Anat Rec 291: 1628–1648, 2008 [DOI] [PMC free article] [PubMed] [Google Scholar]
- 7. Griffiths NM, Van der Meeren A, Fritsch P, Abram MC, Bernaudin JF, Poncy JL. Late-occurring pulmonary pathologies following inhalation of mixed oxide (uranium + plutonium oxide) aerosol in the rat. Health Phys 99: 347–356, 2010 [DOI] [PubMed] [Google Scholar]
- 8. Henderson AC, Ingenito EP, Salcedo ES, Moy ML, Reilly JJ, Lutchen KR. Dynamic lung mechanics in late-stage emphysema before and after lung volume reduction surgery. Respir Physiol Neurobiol 155: 234–242, 2007 [DOI] [PubMed] [Google Scholar]
- 9. Hogg JC. Chronic obstructive pulmonary disease in high and low income countries. Blood 12: 467–479, 2008 [Google Scholar]
- 10. Horsfield K, Dart G, Olson DE, Filley GF, Cumming G. Models of the human bronchial tree. J Appl Physiol 31: 207–217, 1971 [DOI] [PubMed] [Google Scholar]
- 11. Jiang ZL, Kassab GS, Fung YC. Diameter-defined Strahler system and connectivity matrix of the pulmonary arterial tree. J Appl Physiol 76: 882–892, 1994 [DOI] [PubMed] [Google Scholar]
- 12. Lee D, Fanucchi MV, Plopper CG, Fung J, Wexler AS. Pulmonary architecture in the conducting regions of six rats. Anat Rec 291: 916–926, 2008 [DOI] [PubMed] [Google Scholar]
- 13. Ma B, Lutchen KR. CFD simulation of aerosol deposition in an anatomically based human large-medium airway model. Ann Biomed Eng 37: 271–285, 2009 [DOI] [PubMed] [Google Scholar]
- 14. March TH, Cossey PY, Esparza DC, Dix KJ, McDonald JD, Bowen LE. Inhalation administration of all-trans-retinoic acid for treatment of elastase-induced pulmonary emphysema in Fischer 344 rats. Exp Lung Res 30: 383–404, 2004 [DOI] [PubMed] [Google Scholar]
- 15. Marsden AL, Vignon-Clementel IE, Chan FP, Feinstein JA, Taylor CA. Effects of exercise and respiration on hemodynamic efficiency in CFD simulations of the total cavopulmonary connection. Ann Biomed Eng 35: 250–263, 2007 [DOI] [PubMed] [Google Scholar]
- 16. Menache MG, Patra AL, Miller F. Airway structure variability in the Long Evans rat lung. Neurosci Biobehav Rev 15: 63–69, 1991 [DOI] [PubMed] [Google Scholar]
- 17. Migliavacca F, Balossino R, Pennati G, Dubini G, Hsia TY, de Leval MR, Bove EL. Multiscale modelling in biofluidynamics: application to reconstructive paediatric cardiac surgery. J Biomech 39: 1010–1020, 2006 [DOI] [PubMed] [Google Scholar]
- 18. Montaudon M, Lederlin M, Reich S, Begueret H, Tunon-de-Lara JM, Marthan R, Berger P, Laurent F. Bronchial measurements in patients with asthma comparison of quantitative thin section CT findings with those in healthy subjects and correlation with pathologic findings. Radiology 253: 844–853, 2009 [DOI] [PubMed] [Google Scholar]
- 19. Nagase T, Aoki T, Matsue H, Ohga E, Katayama H, Teramoto S, Matsuse T, Fukuchi Y, Ouchi Y. Airway and lung tissue behavior during endothelin 1 induced constriction in rats effects of receptor antagonists. Can J Physiol Pharmacol 75: 1369–1374, 1997 [PubMed] [Google Scholar]
- 20. Nikiforov AI, Schlesinger RB. Morphometric variability of the human upper bronchial tree. Respir Physiol 59: 289–299, 1985 [DOI] [PubMed] [Google Scholar]
- 21. Pedley TJ, Schroter RC, Sudlow MF. The prediction of pressure drop and variation of resistance within the human bronchial airways. Respir Physiol 9: 387–405, 1970 [DOI] [PubMed] [Google Scholar]
- 22. Phalen RF, Yeh HC, Schum GM, Raabe OG. Application of an idealized model to morphometry of the mammalian tracheobronchial tree. Anat Rec 190: 167–176, 1978 [DOI] [PubMed] [Google Scholar]
- 23. Pich J. Theory of gravitational deposition of particles from laminar flows in channels. J Aerosol Sci 3: 351–361, 1972 [Google Scholar]
- 24. Raabe OG, Al-Bayati MA, Teague SV, Rasolt A. Regional deposition of inhaled monodisperse coarse and fine aerosol particles in small laboratory animals. Ann Occup Hyg 32: 53–63, 1988 [Google Scholar]
- 25. Raabe OG, Yeh HC, Schum GM, Phalen RF. Tracheobronchial Geometry; Human, Dog, Rat, Hamster. Alburquerque, NM, 1976 [Google Scholar]
- 26. Rajendrasozhan S, Hwang JW, Yao H, Kishore N, Rahman I. Anti-inflammatory effect of a selective IkappaB kinase-beta inhibitor in rat lung in response to LPS and cigarette smoke. Pulm Pharmacol Ther 23: 172–181, 2010 [DOI] [PMC free article] [PubMed] [Google Scholar]
- 27. Rodriguez M, Bur S, Favre A, Weibel ER. Pulmonary acinus geometry and morphometry of the peripheral airway system in rat and rabbit. Am J Anat 180: 143–155, 1987 [DOI] [PubMed] [Google Scholar]
- 28. Scadeng M, Rossiter HB, Dubowitz DJ, Breen EC. High-resolution three-dimensional magnetic resonance imaging of mouse lung in situ. Invest Radiol 42: 50–57, 2007 [DOI] [PubMed] [Google Scholar]
- 29. Sera T, Fujioka H, Yokota H, Makinouchi A. Three-dimensional visualization and morphometry of small airways from microfocal X-ray computed tomography. J Biomech 36: 1587–1594, 2003 [DOI] [PubMed] [Google Scholar]
- 30. Spilker RL, Feinstein J, Parker DW, Reddy VM, Taylor C. Morphometry-based impedance boundary conditions for patient-specific modeling of blood flow in pulmonary arteries. Ann Biomed Eng 35: 546–559, 2007 [DOI] [PubMed] [Google Scholar]
- 31. Strahler AN. Quantitative analysis of watershed geomorphology. Trans Am Geophys Union 38: 913–920, 1957 [Google Scholar]
- 32. Taylor C. Finite element modeling of blood flow in arteries. Comp Methods Appl Mech Eng 158: 155–196, 1998 [Google Scholar]
- 33. Vignon-Clementel IE, Figueroa C, Jansen KE, Taylor C. Outflow boundary conditions for 3D simulations of non-periodic blood flow and pressure fields in deformable arteries. Comp Methods Biomech Biomed Eng 13: 625–640, 2010 [DOI] [PubMed] [Google Scholar]
- 34. Wall WA, Wiechert L, Comerford A, Rausch S. Towards a comprehensive computational model for the respiratory system. Int J Numerical Methods Biomed Eng 26: 807–827, 2010 [Google Scholar]
- 35. Wichers LB, Rowan WH, Nolan JP, Ledbetter AD, McGee JK, Costa DL, Watkinson WP. Particle deposition in spontaneously hypertensive rats exposed via whole-body inhalation: measured and estimated dose. Toxicol Sci 93: 400–410, 2006 [DOI] [PubMed] [Google Scholar]
- 36. Yeh HC, Schum GM, Duggan MT. Anatomic models of the tracheobronchial and pulmonary regions of the rat. Anat Rec 195: 483–492, 1979 [DOI] [PubMed] [Google Scholar]
- 37. Yin Y, Choi J, Hoffman a E, Tawhai MH, Lin CL. Simulation of pulmonary air flow with a subject-specific boundary condition. J Biomech 43: 2159–2163, 2010 [DOI] [PMC free article] [PubMed] [Google Scholar]