

Executive Summary
Objective
The objective of this analysis is to review a spectrum of functional brain imaging technologies to identify whether there are any imaging modalities that are more effective than others for various brain pathology conditions. This evidence-based analysis reviews magnetoencephalography (MEG), magnetic resonance spectroscopy (MRS), positron emission tomography (PET), and functional magnetic resonance imaging (fMRI) for the diagnosis or surgical management of the following conditions: Alzheimer’s disease (AD), brain tumours, epilepsy, multiple sclerosis (MS), and Parkinson’s disease (PD).
Clinical Need: Target Population and Condition
Alzheimer’s disease is a progressive, degenerative, neurologic condition characterized by cognitive impairment and memory loss. The Canadian Study on Health and Aging estimated that there will be 97,000 incident cases (about 60,000 women) of dementia (including AD) in Canada in 2006.
In Ontario, there will be an estimated 950 new cases and 580 deaths due to brain cancer in 2006. Treatments for brain tumours include surgery and radiation therapy. However, one of the limitations of radiation therapy is that it damages tissue though necrosis and scarring. Computed tomography (CT) and magnetic resonance imaging (MRI) may not distinguish between radiation effects and resistant tissue, creating a potential role for functional brain imaging.
Epilepsy is a chronic disorder that provokes repetitive seizures. In Ontario, the rate of epilepsy is estimated to be 5 cases per 1,000 people. Most people with epilepsy are effectively managed with drug therapy; but about 50% do not respond to drug therapy. Surgical resection of the seizure foci may be considered in these patients, and functional brain imaging may play a role in localizing the seizure foci.
Multiple sclerosis is a progressive, inflammatory, demyelinating disease of the central nervous system (CNS). The cause of MS is unknown; however, it is thought to be due to a combination of etiologies, including genetic and environmental components. The prevalence of MS in Canada is 240 cases per 100,000 people.
Parkinson’s disease is the most prevalent movement disorder; it affects an estimated 100,000 Canadians. Currently, the standard for measuring disease progression is through the use of scales, which are subjective measures of disease progression. Functional brain imaging may provide an objective measure of disease progression, differentiation between parkinsonian syndromes, and response to therapy.
The Technology Being Reviewed
Functional Brain Imaging
Functional brain imaging technologies measure blood flow and metabolism. The results of these tests are often used in conjunction with structural imaging (e.g., MRI or CT). Positron emission tomography and MRS identify abnormalities in brain tissues. The former measures abnormalities through uptake of radiotracers in the brain, while the latter measures chemical shifts in metabolite ratios to identify abnormalities. The potential role of functional MRI (fMRI) is to identify the areas of the brain responsible for language, sensory and motor function (sensorimotor cortex), rather than identifying abnormalities in tissues. Magnetoencephalography measures magnetic fields of the electric currents in the brain, identifying aberrant activity. Magnetoencephalography may have the potential to localize seizure foci and to identify the sensorimotor cortex, visual cortex and auditory cortex.
In terms of regulatory status, MEG and PET are licensed by Health Canada. Both MRS and fMRI use a MRI platform; thus, they do not have a separate licence from Health Canada. The radiotracers used in PET scanning are not licensed by Health Canada for general use but can be used through a Clinical Trials Application.
Review Strategy
The literature published up to September 2006 was searched in the following databases: MEDLINE, MEDLINE In-Process & Other Non-Indexed Citations, EMBASE, Cochrane Database of Systematic Reviews, CENTRAL, and International Network of Agencies for Health Technology Assessment (INAHTA). The database search was supplemented with a search of relevant Web sites and a review of the bibliographies of selected papers.
General inclusion criteria were applied to all conditions. Those criteria included the following:
Full reports of systematic reviews, randomized controlled trials (RCTs), cohort-control studies, prospective cohort studies (PCS’), and retrospective studies.
Sample sizes of at least 20 patients (≥ 10 with condition being reviewed).
English-language studies.
Human studies.
Any age.
Studying at least one of the following: fMRI, PET, MRS, or MEG.
Functional brain imaging modality must be compared with a clearly defined reference standard.
Must report at least one of the following outcomes: sensitivity, specificity, accuracy, positive predictive value (PPV), receiver operating characteristic curve, outcome measuring impact on diagnostic testing, treatment, patient health, or cost.
Summary of Findings
There is evidence to indicate that PET can accurately diagnose AD; however, at this time, there is no evidence to suggest that a diagnosis of AD with PET alters the clinical outcomes of patients.
The addition of MRS or O-(2-18F-Fluoroethyl)-L-Tyrosine (FET)-PET to gadolinium (Gd)-enhanced MRI for distinguishing malignant from benign tumours during primary diagnosis may provide a higher specificity than Gd-enhanced MRI alone. The clinical utility of additional imaging in patients to distinguish malignant from benign tumours is unclear, because patients with a suspected brain tumour will likely undergo a biopsy despite additional imaging results.
The addition of MRS, FET-PET, or MRI T2 to Gd-enhanced MRI for the differentiation of recurrence from radiation necrosis may provide a higher specificity than Gd-enhanced MRI alone. The clinical utility of additional imaging in patients with a suspected recurrence is in the monitoring of patients. Based on the evidence available, it is unclear if one of the imaging modalities (MRS, FET-PET, or MRI T2) offers significantly improved specificity over another.
There may be a role for fMRI in the identification of surgical candidates for tumour resection; however, this requires further research.
Based on the studies available, it is unclear if MEG has similar accuracy in localizing seizure foci to intracranial electroencephalogram (ICEEG). More high-quality research is needed to establish whether there is a difference in accuracy between MEG and ICEEG.
The results of the studies comparing PET to noninvasive electroencephalogram (EEG) did not demonstrate that PET was more accurate at localizing seizure foci; however, there may be some specific conditions, such as tuberous sclerosis, where PET may be more accurate than noninvasive EEG.
There may be some clinical utility for MEG or fMRI in presurgical functional mapping; however, this needs further investigation involving comparisons with other modalities. The clinical utility of MRS has yet to be established for patients with epilepsy.
Positron emission tomography has high sensitivity and specificity in the diagnosis of PD and the differential diagnosis of parkinsonian syndromes; however, it is unclear at this time if the addition of PET in the diagnosis of these conditions contributes to the treatment and clinical outcomes of patients.
There is limited clinical utility of functional brain imaging in the management of patients with MS at this time. Diagnosis of MS is established through clinical history, evoked potentials, and MRI. Magnetic resonance imaging can identify the multifocal white lesions and other structural characteristics of MS.
Objective
The objective of this analysis is to review a spectrum of functional brain imaging technologies to identify whether there are any imaging modalities that are more effective than others for various brain pathology conditions. This evidence-based analysis reviews magnetoencephalography (MEG), magnetic resonance spectroscopy (MRS), positron emission tomography (PET), and functional magnetic resonance imaging (fMRI) for the diagnosis or surgical management of the following conditions: Alzheimer’s disease (AD), brain tumours, epilepsy, multiple sclerosis (MS), and Parkinson’s disease (PD).
Each condition was reviewed separately investigating each of the imaging modalities. Unique questions were developed for each of the conditions to assess the potential role of functional imaging in each.
Background
Clinical Need: Target Population and Condition
Alzheimer’s Disease
Alzheimer’s disease is a progressive, degenerative, neurologic condition, characterized by cognitive impairment and memory loss. The progressive condition causes deterioration over 8 to 10 years. Patients with advanced disease have difficulties with basic activities such as eating, dressing, and bladder control. There is no cure for AD; however, there are some drug therapies that can slow disease progression. These drugs include cholinesterase inhibitors, tacrine and donepezil. (1)
The Canadian Study on Health and Aging (2) has been observing the incidence and prevalence of AD since 1991. There will be an estimated 97,000 incident cases (about 60,000 women) of dementia (including AD) in Canada in 2006. (3;4) The estimated prevalence of dementia (including AD) in the Canadian population over 65 years is 435,000 (about two-thirds of these patients have AD). In 2006, there will be an estimated 164,000 people with AD in Ontario. (3) The incidence of AD increases with age. By age 85 years, 1 in 3 Canadians has dementia. (2)
According to the Alzheimer’s Society of Canada, (5) the diagnosis of AD involves a systematic assessment including, at least, medical history, mental status examination, and physical examination. Imaging with MRI, computed tomography (CT), single photon emission computed tomography (SPECT), PET, or electroencephalogram (EEG) may also be used in the diagnosis.
Brain Tumour
In 2006, there will be an estimated 2,500 new cases of brain cancer diagnosed in Canada, and an estimated 1,670 deaths due to brain cancer. (6) In Ontario, there will be 950 new cases and 580 deaths due to brain cancer. Statistics Canada (6) has calculated that the 5-year survival ratio was 23% (95% confidence interval [CI], 22%–25%) in brain cancer cases diagnosed between 1995 and 1997. The 5-year survival ratio was 59% for all invasive cancers (95% CI, 59%–60%), with only esophageal (13%), lung (16%), and pancreatic (6%) cancers having a lower 5-year survival ratio than brain cancer. (6)
Primary brain tumours arise from glial cells. There are 4 types of glial cells: astrocytes, oligodendrocytes, microglia, and ependymocytes. Brain tumours are classified by cell type or by World Health Organization grading classification. Grading criteria include cellular atypia, mitoses, infiltration, necrosis, and vascular changes. Low-grade gliomas are grade I and II, and are typically less aggressively treated than high-grade (grade III–IV) gliomas (e.g., glioblastoma multiforme). Low-grade tumours are less likely to invade surrounding tissue and to recur compared with high-grade tumours. (7)
Currently, the gold standard for the noninvasive diagnosis of primary or recurrent tumours is the use of MRI with gadolinium (Gd). If surgical confirmation is contraindicated or suspicion of radionecrosis is high, then MRS may be considered (personal communication, clinical expert, November 15, 2006).
Treatment for brain tumours typically includes surgery to resect the tumour; however, the entire tumour may not be resected during surgery depending on a variety of factors, including the numbers, size, and location of the tumour. Incomplete resection may be necessary to spare healthy brain tissue surrounding the tumour. Radiation therapy may be used alone or in addition to surgery. More recently, the use of chemotherapy to treat high-grade tumours has resulted in improved survival (personal communication, clinical expert, December 14, 2006).
Radiation therapy can be delivered as whole-brain radiotherapy, conformal 3-dimensional radiotherapy, or stereotactic radiotherapy (targeted high-dose radiation at lesion). However, these therapies are not without limitations. Radiation therapy damages tissue though necrosis and scarring. Computed tomography and MRI may not distinguish between radiation effects and resistant tissue. Thus a potential role of functional brain imaging is to differentiate the cells in the lesions caused by radiation therapy.
Individuals with brain tumours typically have neurological symptoms, and are rarely diagnosed without symptoms of a brain tumour. Diagnostic imaging provides the potential opportunity to avoid unnecessary biopsy, or provide more precision for stereotactic biopsies. Throughout the course of treatment, imaging has the potential to determine response to treatment and manage therapies efficiently. (8)
Epilepsy
Epilepsy is a chronic disorder characterized by repetitive seizures. It may have a variety of etiologies that range from genetic or developmental anomalies, to multiple types of brain trauma (e.g., injury, stroke, or tumour). For some patients, there may be no apparent cause.
Seizures are classified by location focus and etiology.
For most people with epilepsy, their condition is effectively managed with drug therapy; however, about 30% do not respond to drug therapy (personal communication, clinical expert, December 1, 2006). Surgical resection of the epileptic focus is an option for some of these patients. (9)
The rate of epilepsy in Canada is 5.2 cases per 1,000 population (95% CI, 4.9–5.4 cases) based on the results of the 1998–1999 National Population Health Survey (NPHS), and 5.6 cases per 1,000 population (95% CI, 5.1–6.0 cases) based on the results of the 2001 Canadian Community Health Survey (CCHS). (10) In Ontario the rate is 5.0 cases per 1,000 (95% CI, 4.2–5.9 cases) in the NPHS, and 5.2 cases per 1,000 (95% CI, 4.5–6.1 cases) in the CCHS. (10) Thus, there are about 66,000 Ontario residents diagnosed with epilepsy.
Current Practice for Localization of Seizure Foci in Patients with Epilepsy
Patients with refractory epilepsy being considered for surgery must undergo a series of tests to establish the location of the seizure foci. All patients undergo scalp EEG with video monitoring, which is a noninvasive test to localize the seizures. Basically, it involves videotaping the patient while undergoing an EEG. The scalp video EEG monitors patients for a few days (usually 5-10 days) in hospital while a patient is off their medication to measure several seizures. If a patient does not suffer any seizures in this time, they will continue to monitor the patient for a longer period of time (sometimes up to 1 month). Patients will also undergo a MRI to identify structural abnormalities, and to attempt to correlate structural abnormalities with EEG results. SPECT may also be performed. Patients will also undergo a neuropsychological evaluation to assess if a patient’s language, motor or sensory function are affected by their seizures. These results will also be compared with the MRI, EEG and SPECT (if performed) results to identify consistencies. In some cases, as part of the neuropsychological evaluation, patients will also undergo a fMRI for functional mapping.
If, at this point, there is suspicion that the seizures are focal, intracranial EEG (ICEEG) is used to localize the seizure foci. ICEEG is an invasive procedure either involving drilling holes into the skull in order to place electrodes on the brain, or by craniotomy to place a mesh of electrodes (subdural grid) on the brain. Patients remain in hospital for a few days, just like the scalp video EEG, to measure several seizures in order to localize the foci. This procedure involves surgery to place the electrodes, and then another surgery to remove the electrodes, which may or may not be combined with surgery for resection of the seizure foci. If the foci are localized, surgery is considered; if multifocal, surgery is no longer an option.
Surgery for patients with drug-refractory epilepsy is effective in eliminating seizures or significantly decreasing the frequency of seizures. Long-term follow-up studies indicate that 66% of patients with temporal lobe epilepsy are seizure-free 5 years after surgery. (11) Approximately another 20% of patients with have a “worthwhile improvement” in the frequency of seizures. (12)
Multiple Sclerosis
Multiple sclerosis is a progressive, inflammatory, demyelinating disease of the central nervous system (CNS). The cause of MS is unknown; however, it is expected to have a combination of etiologies including genetic and environmental components. (13)
Initial symptoms of MS include optic neuritis, transverse myelitis, double vision, and numbness of the leg. (14) The symptoms associated with MS are not always present, and patients often have periods of remission during which they are free of symptoms. During these periods of clinical silence, the disease continues to progress. One of the proposed advantages of functional brain imaging for MS is that it would allow for earlier diagnosis because, despite a lack of symptoms, there are changes that can be observed, including the formation of new white-matter plaque in the CNS. Earlier diagnosis may allow for earlier initiation of treatment with the intention of delaying disease progression.
Based on results of the CCHS, the prevalence of MS in Canada is 240 cases per 100,000 (95% CI, 210–280 cases). (13) The lowest prevalence of MS provincially in Canada is in Quebec (about 180/100,000), and the highest prevalence is in Atlantic Canada (about 350/100,000). In Ontario the prevalence of MS is estimated to be 230 cases per 100,000 based on CCHS data from 2000/2001. (13)
Parkinson’s Disease
Parkinson’s disease is the most prevalent movement disorder. It affects an estimated 100,000 Canadians. (15) Parkinson’s disease is characterized by bradykinesia (slow, incomplete movements), tremor, rigidity, and impaired balance. Parkinson’s disease is a progressive disease that affects an individual’s quality of life at each stage of the disease.
Parkinson’s disease is caused by a degeneration of dopaminergic neurons that project from the substantia nigra in the midbrain to the striatal complex in the forebrain. (16) This region is called the nigrostriatal pathway. Essential tremor, vascular parkinsonism, and AD are not associated with the degeneration of the nigrostriatal pathway; thus, imaging of the nigrostriatal pathway can assist in excluding these diagnoses. Idiopathic Parkinson’s disease (IPD), progressive supranuclear palsy, multiple system atrophy (MSA), and corticobasal ganglionic degeneration all involve degeneration of the nigrostriatal pathway, thus imaging of the nigrostriatal pathway will not allow differentiation between these conditions. (16)
A clinical pathology study (17) from the United Kingdom in 1992 reported that the diagnostic accuracy for diagnosing IPD was 75%. The remaining 25% of patients diagnosed with IPD had other parkinsonian syndromes or dementia. In 2001, the same group of authors (18) reported that the diagnostic accuracy for IPD was 90%, indicating that clinicians had improved their ability to distinguish IPD from other neurological conditions since 1992. It is important to note that in the updated study, patients had endstage disease, which may have made it easier to achieve an accurate diagnosis. Thus, 90% accuracy reflects a “best-case” scenario, and is unlikely to represent the norm. (16)
Currently, the standard for measuring disease progression is through the use of scales (e.g., Unified Parkinson’s Disease Rating Scale (UPDRS), Hoehn and Yahr’s, modified Columbia score, etc.), which are subjective measures of disease progression. (19) One of the proposed advantages of using PET in patients with PD is that it can be an objective measure of diagnosis, disease progression, or assessing the efficacy of drugs. (20)
New Technology Being Reviewed
Functional Brain Imaging
Functional brain imaging technologies measure blood flow and/or metabolism. The results are often used in conjunction with structural imaging (i.e., MRI or CT). Unlike CT and MRI, functional brain imaging modalities, such as PET, MRS, and fMRI, can isolate areas with changes in activity prior to structural change.
Positron Emission Tomography
Positron emission tomography uses radioactive tracer isotopes attached to metabolically active molecules (e.g., glucose) to investigate functionality in the body. Briefly, PET generates an image when positrons are released from the nuclei of the radiotracers. Once released, the positrons collide with negatively charged electrons. When a positron and an electron collide, this causes annihilation, whereby both the positron and electron are converted into energy. This energy is divided between 2 photons traveling 180 degrees from each other. The released photon pair can be detected as a line—these lines are called “coincidence events.” A group of coincidence events are used to generate a sinogram, which is used to create PET images. (21)
Positron emission tomography scans can be used in conjunction with structural imaging modalities, such as CT or MRI, and PET can be used in a variety of settings, including in cancer imaging, heart function studies, and brain imaging.
Radiopharmaceuticals have varying half-lives (time to decrease radioactivity by half). Table 1 lists the half-lives of some of the radiopharmaceuticals used in PET imaging. A cyclotron is needed to create radiopharmaceuticals. The radiopharmaceuticals are incorporated into the metabolically active molecules (e.g., glucose).
Table 1: Radiopharmaceuticals Used in Studies of Positron Emission Tomography.
| Radiopharmaceutical | Examples of Radiotracers | Half-Life, Minutes | |
|---|---|---|---|
| FDG | 18 F-labelled-fluorodeoxyglucose | ||
| 18-Fluorine | FET | O-(2-18F-Fluoroethyl)-L-Tyrosine | ~110 |
| FLT | 18 F-labelled-fluoro-3′-deoxy-3′-L-fluorothymidine | ||
| 11-Carbon | MET | L-methyl-11C-methionine | ~20 |
| 13-Nitrogen | N-13 ammonia | ~10 | |
| 15-Oxygen | O-15 water | ~2 | |
Functional Magnetic Resonance Imaging
Functional magnetic resonance imaging is also called blood oxygenation level-dependent MRI. Functional magnetic resonance imaging images neuronal activity through blood flow (oxyhemoglobin delivery) which increases with brain activity and measures activity in the sensorimotor cortex, such as language, sensory, and motor function. Functional magnetic resonance imaging uses the MRI platform to generate functional images of the brain. There is no radiation exposure associated with fMRI, and it can be performed on a standard MRI system after a software upgrade.
Magnetic Resonance Spectroscopy
Magnetic resonance spectroscopy uses a MRI system to measure the concentration of several metabolites in the brain. Magnetic resonance spectroscopy distinguishes the chemical properties of a certain area of the brain relative to the surrounding areas. Magnetic resonance spectroscopy detects different chemicals by their different vibration frequencies, creating a chemical shift. Commonly measured metabolites include N-acetyl acetate (NAA), myoinositol, choline (Cho), and creatine (Cr).
One of the potential limitations of MRS is that it may not be able to distinguish patients with tissues with mixed histological findings. For instance, in patients with suspected tumour recurrence, MRS may be able to distinguish pure tumour tissue from pure necrosis tissue; however, many patients will have mixed histological findings with both tumour tissue and necrosis tissue, limiting the utility of MRS. (22)
Magnetoencephalography
Magnetoencephalography is a noninvasive imaging modality that measures the magnetic fields of the electric currents in the brain, that is, it measures the electromagnetic activity in the brain. The small magnetic fields are detected by superconducting quantum interference devices. The information gathered from the superconducting quantum interference devices is analyzed and typically fused with a structural image (e.g., MRI). The resultant MEG on MRI images can also be referred to as Magnetic source images (MSI). Magnetoencephalography has a 2 to 3 millimeter spatial accuracy and the ability to identify brain activity in real time, unlike fMRI, MRI, PET, CT, and SPECT. (23)
Advantages of Magnetoencephalography:
Superior temporal resolution (milliseconds) compared with fMRI, MRI, PET, CT, and SPECT
Does not require strong external magnetic fields like fMRI
Does not require injections of radiotracers
Potential roles of Magnetoencephalography:
To identify sensorimotor cortex in presurgical patients
To localize epileptic foci in presurgical patients
The first MEG system was housed in a protected (shielded) room at the Massachusetts Institute of Technology (MIT). In 1968, Dr. David Cohen performed the first MEG at MIT. (24)
In 2000, the Hospital for Sick Children in Toronto, Ontario, installed the first clinical MEG site in Canada (and the first in the world to be installed in a pediatric institution). (25)
Alternative Technologies
Alternative imaging technologies include CT, MRI, ultrasound, and SPECT. Computed tomography and MRI create structural images; they do not measure function. In most cases, functional brain imaging will be used in conjunction with CT or MRI. Single photon emission computed tomography uses standard nuclear medicine cameras, which are available in every hospital. At many centres, ictal SPECT with Tc-99m hexamethylpropylene amine oxime is the standard of care for the evaluation of epilepsy (personal communication, clinical expert, December 11, 2006).
An alternative to MEG in patients with epilepsy is ICEEG. Intracranial electroencephalogram includes electrocorticography (subdural grid placement) and the placement of depth electrodes on the brain. Intracranial electroencephalogram is the gold standard for localizing epileptic foci. Intracranial electroencephalogram is an invasive procedure either involving drilling holes into the skull in order to place electrodes on the brain, or by craniotomy to place a mesh (subdural grid) of electrodes on the brain. The grid is connected to a portable EEG to measure electrophysiology to identify the seizure foci. Patients undergoing this procedure are required to remain in hospital for a few days under observation for seizures, and then if the epileptic foci are localized, surgery is considered. This is a highly invasive procedure that involves 2 surgeries, one to implant the grid or place electrodes, and then another to remove the grid or electrodes. Intracranial electroencephalogram involves patient discomfort and the potential risk of complications (personal communication, clinical expert, October 27, 2006).
Although ICEEG is the accepted gold standard, it has limitations. In 1995, Cascino et al. (26) retrospectively reviewed the results of 30 patients undergoing presurgical evaluation for localization of seizure foci. The patients had undergone ICEEG monitoring, and the decision regarding the localization of the seizure foci was based on multiple recorded seizures. Cascino and colleagues reported 1-year follow-up data on 21 patients. Of these 21 patients, 9 were seizure-free, 3 reported t least a 95% improvement in seizures, 4 reported at least a 50% improvement in seizures, and 5 reported minimal improvement or no change. Thus, about 57% of patients had success with surgery based on results of the ICEEG.
In another study by Weinand et al., (27) 36 patients underwent surgery for the resection of seizure-foci after ICEEG. At 1 year, 23 (64%) patients were seizure-free, 9 (25%) were significantly improved, 3 (8%) were improved, and 1 (3%) patient was unchanged. Thus, based on the results of these studies, the range of surgical success (seizure-free or significantly improved) based on ICEEG results ranged from 57% to 89%.
Currently, the standard procedure for presurgical functional mapping is the intracarotid sodium amobarbital procedure (known as the ISAP or the Wada test), which maps language and memory on each side of the brain. Prior to the Wada test, patients underwent a cerebral angiogram to assess blood flow in the brain by using a catheter threaded through the femoral artery to the carotid artery, to inject dye into the arteries in the brain.
During a Wada test, sodium amobarbital is injected into the right or left carotid artery (an injection in the right carotid artery will numb the right side of the brain and vice-versa). Patients are then stimulated with objects and pictures to assess cognitive function. When the sodium amobarbital wears off on one side of the brain, the procedure is repeated on the other side. Due to the insertion of the catheter, the Wada test is considered an invasive procedure. Functional brain imaging through fMRI or MEG has the potential to provide information similar to the Wada test without the invasiveness of the catheter.
Regulatory Status
There are a few companies that manufacture PET systems that are licensed by Health Canada. The PET systems are not licensed for specific indications. They are intended to be used to image and measure the distribution of injected radiopharmaceuticals. The radiotracers used in PET scanning are not licensed by Health Canada for general use but can be used through a clinical trials application, which are submitted to Health Canada when researchers want to conduct clinical trials with drugs in humans.
There are 2 MEG systems licensed by Health Canada. They are licensed to identify locations of visual, auditory, somatosensory, and motor cortex in the brain; the MEG systems are not licensed to be used for a specific patient population with a specified condition.
There are no unique licences from Health Canada for MRS and fMRI, because both of these technologies use a MRI platform. Magnetic resonance imaging systems are licensed by Health Canada. Most new MRI systems have MRS and fMRI capability if additional software is purchased (or may be included with the MRI purchase price) (personal communication, clinical expert, August 10, 2006).
Literature Review on Effectiveness
It is important to define how the effectiveness of functional brain imaging for the diagnosis of AD, brain tumours, epilepsy, MS, or PD will be assessed. The Medical Advisory Secretariat was primarily interested in how the accuracy of the various imaging modalities has an impact on clinical or patient outcomes, compared with the current standard of diagnosis or presurgical evaluation.
Measuring Accuracy
For the purpose of this review, the following formulas are being used for sensitivity, specificity, PPV, and negative predictive value (NPV).
Sensitivity = true positives / (true positives + false negatives)
Specificity = true negatives / (true negatives + false positives)
Positive predictive value = true positives / (true positives + false positives)
This refers to the probability that a patient with positive test results actually has the condition. Positive predictive value depends on the prevalence of the condition in the population being tested.
Negative predictive value = true negatives / (true negatives + false negatives)
This refers to the probability that a patient with negative test results is truly free of the condition.
Negative predictive value depends on the prevalence of the condition in the population being tested.
Research Questions
The questions that this review aims to answer have been formatted in Table 2. Each condition has a different question or questions. The years included in the literature search vary across conditions and imaging modalities because this was dependent on the timing of the most recent health technology assessment reviewing functional brain imaging for each condition.
Table 2: Question, Patient Population, and Years Searched for Literature for Each Condition Being Reviewed*.
| Condition | Question(s) | Patient Population | Years Searched† |
|---|---|---|---|
| Alzheimer’s disease | What is the potential role of functional brain imaging in the diagnosis of Alzheimer’s disease? | Patients with suspected AD | PET, MRS, fMRI: 2004–Sep. 2006 MEG: 1966–Sep. 2006 |
| Brain tumour | What is the potential role of functional brain imaging:
|
Patients with suspected brain tumour or suspected recurrence | PET: 2003–Sep. 2006 MRS: 2005–Sep. 2006 fMRI, MEG: 1966–Sep. 2006 |
| Epilepsy | What is the potential role of functional brain imaging:
|
Patients with refractory epilepsy being considered surgery | PET, MRS: 2004–Sep. 2006 MEG: 2003–Sep. 2006 fMRI: 1966–Sep. 2006 |
| Multiple sclerosis | What is the potential role of functional brain imaging in the diagnosis of multiple sclerosis? | Patients with suspected MS | PET, MRS, fMRI, MEG: 1966–Sep. 2006 |
| Parkinson’s disease | What is the potential role of functional brain imaging:
|
Patients with suspected PD or the differentiation of parkinsonian syndromes | PET, MRS, fMRI: 2001–Sep 2006 MEG: 1966–Sep 2006 |
AD indicates Alzheimer’s disease; fMRI, functional magnetic resonance imaging; MEG, magnetoencephalography; MRS, magnetic resonance spectroscopy; MS; multiple sclerosis; PD, Parkinson’s disease; PET, positron emission tomography.
The decision regarding which years to search was based on the availability of previous health technology assessments. The search for this review began at the time where the search for the most recent health technology assessment ended.
Methods
Diagnostic studies differ from treatment studies in their design and the outcomes that can be reported. Demonstrating effectiveness and clinical utility of a diagnostic test can be more challenging than demonstrating effectiveness of a treatment, because it can be difficult to measure whether the diagnostic method has an impact on patient outcomes. In 1991, Fryback and Thornbury (28) proposed a hierarchical model of the efficacy for diagnostic tests, describing the complexity of diagnostic studies. Table 3 describes the model.
Table 3: Hierarchy of Diagnostic Evaluation for Assessing Epilepsy With Functional Brain Imaging.
| Level | Description | Examples of Outcomes Reported |
|---|---|---|
| 1 | Technical feasibility and optimization |
|
| 2 | Diagnostic accuracy |
|
| 3 | Diagnostic thinking impact |
|
| 4 | Therapeutic choice impact |
|
| 5 | Patient outcome impact |
|
| 6 | Societal impact |
|
Source: Fryback DG, Thornbury JR. The efficacy of diagnostic imaging. Medical Decision Making 1991; 11:88–94
The purpose of this review is to investigate the clinical utility of functional brain imaging in patients with AD, brain tumours, epilepsy, MS, or Parkinson’s disease. Because the focus is on clinical utility, the added clinical information that would be provided by Level 1 studies (i.e., studies of technical feasibility) is limited. For this reason, Level 1 studies were not included in this review; only studies in Levels 2 to 6 were eligible for inclusion.
Inclusion Criteria
General inclusion criteria were applied to all conditions. These criteria include the following:
Full reports of systematic reviews, RCTs, cohort-control studies, prospective cohort studies, retrospective studies;
Samples of at least 20 patients (≥ 10 with condition being reviewed);
English-language studies;
Human studies;
Any age;
Studying at least 1 of the following functional brain imaging modalities: fMRI, PET, MRS, MEG;
Functional brain imaging modality must be compared with a clearly defined reference standard;
At least Level 2 on the Fryback and Thornbury hierarchy; and (28)
Must report at least one of the following outcomes: sensitivity, specificity, accuracy, PPV, receiver operating characteristic curve, outcome measuring impact on diagnostic testing, treatment, patient health, or cost.
Exclusion Criteria
Regardless of condition, studies were excluded if they were:
Level 1 studies (technical feasibility) based on the Fryback and Thornbury model; (28)
Editorials, letters, case reports, abstracts;
Non-English-language studies;
Studies including only normal, healthy individuals; or
Studies reporting only technical feasibility of imaging without providing clinical or diagnostic results.
Results of Literature Review
Summary of Existing Health Technology Assessments
Table 4 describes the health technology assessments and systematic reviews identified that reviewed functional brain imaging for AD, brain tumours, epilepsy, and Parkinson’s disease. There were no health technology assessments or systematic reviews identified that reviewed functional brain imaging for patients with suspected or confirmed MS. Most health technology assessments and systematic reviews investigated the use of PET; 4 reviews specifically reviewed MRS (3 for patients with suspected brain tumours, and 1 for the differential diagnosis of parkinsonian syndromes), and 1 health technology assessment reviewed the use of MEG in patients with epilepsy.
Table 4: Description of Systematic Reviews and Health Technology Assessments of Functional Brain Imaging*.
| HTA/ Systematic Review | Question(s) | Years | Sources Searched† | Inclusion Criteria | # of Studies Included | Authors’ Conclusions |
|---|---|---|---|---|---|---|
| Alzheimer’s dementia | ||||||
| Matchar et al., 2004 (AHRQ) (33) |
|
2001–Jan 2004 for PET 1995–Jan 2004 for other imaging | MEDLINE, INAHTA, NICE, GIN, HTA database (NHS) |
|
4 for PET 12 for SPECT 2 for fMRI 4 for MRS 9 for CT/MRI | There is insufficient evidence to revise conclusions from 2001 AHRQ report. (34) |
| Patwardhan et al., 2004 (35) | What is the role of PET in the diagnosis of AD? | 1989-2003 | MEDLINE, CINAHL, HealthSTAR |
|
15 | Sensitivity and specificity is limited by study design and patient characteristics—the clinical value of these parameters is uncertain. |
| Gill et al., 2003 (36) | What incremental diagnostic value does PET provide in the evaluation of patients with suspected dementia? | 1975–Jan2001 | MEDLINE, Cochrane Library, HTAs |
|
16 original reports 7 HTAs | There is little evidence to support the addition of PET to the routine clinical evaluation of patients with suspected or established dementia. |
| ECRI, 2002 (37) | What is the role of PET in the diagnosis of AD? | NR | NR |
|
12 | PET can accurately diagnose AD, however, the effect on patient outcomes is unclear |
| Matchar et al., 2001 (AHRQ) (34) |
|
1995-2001 | MEDLINE, HealthSTAR, CINAHL |
|
18 | PET improves the overall accuracy of diagnosis compared with accuracy of an examination based of AAN guidelines. Treatment based on AAN examination guidelines leads to better health outcomes than treatment based on PET results. |
| AETMIS, 2001 (29) | What is the role of PET in the diagnosis of AD? | 1999-2001 | MEDLINE, EMBASE, CancerLit, Cochrane library |
|
2 | In AD, the clinical utility of PET is not recognized. |
| Adams et al., 1998 (VATAP) (38) | What is the role of PET in the diagnosis of AD? | NR | NR |
|
8 (for AD) | Evidence does not support the use of PET as a diagnostic test for AD |
| Brain tumour | ||||||
| Hollingworth, 2006 (39) | Primary focus—update to previous HTAs. No questions explicitly stated |
Jan 2002 – Dec 2004 | MEDLINE, EMBASE, Cochrane Library |
|
22 | The evidence is promising, however, more high quality studies are required for policy makers to make decisions. |
| AHRQ, 2004 (40) |
|
1966–April 2003 | MEDLINE |
|
8 | There is insufficient evidence to answer the questions posed. |
| AHRQ, 2003 (41) |
|
1966–Oct 2002 | MEDLINE, INAHTA, NGC, and abstracts from 2001–2002 professional society proceedings for ASNR, RSNA, and ISMRM |
|
96 (85 studies of technical feasibility) | There is a paucity of high quality direct evidence demonstrating an impact of MRS on diagnostic thinking and therapeutic decision making. |
| Blue Cross, Blue Shield Association, 2003 (42) |
|
1966–May 2003 | MEDLINE, ACR contacted, reference lists of pertinent reviews |
|
7 | MRS for the evaluation of suspected brain tumour does not meet the criteria in order to recommend coverage. |
| ECRI, 2002 (7) | Can positron imaging be used to identify and/or characterize tumours that may recur after cancer treatment? | 1964–July 2002 | Cancerlit, MEDLINE, Cochrane Library, ECRI databases, CMS, NHS, FDA, NGC Web sites |
|
6 met inclusion criteria for PET, 7 for SPECT | There is insufficient evidence to conclude that PET or SPECT imaging is better than other modality for the diagnosis of recurrent brain tumours. |
| AETMIS, 2001 (29) | What is the role of PET in the diagnosis and management of brain tumours? | 1999-2001 | MEDLINE, EMBASE, CancerLit, Cochrane library |
|
9 | The clinical utility of PET is recognized for evaluating residual lesions after treatment of a recurrent glioma and differentiating between radionecrosis and recurrence in patients with radiation therapy who have abnormalities on diagnostic imaging. It may have a role in the future for diagnosis, staging and grading of tumours. |
| MSAC, 2000 (31) | What is the role of PET in the detection of residual/recurrent mass in patients treated for malignant glioma? | 1966–Jan. 2000 | MEDLINE, Cochrane library, HTA Web sites |
|
21 | There is insufficient evidence to conclude that PET is superior to SPECT in differentiating radionecrosis from recurrence. |
| Epilepsy | ||||||
| NHS, 2006 (Whiting et al.) (9) |
|
1986–Dec. 2003 | MEDLINE, EMBASE, BIOSIS, Pascal, Science Citation Index, LILACS Hand searched the following journals: Epilepsia, Neurology, Epilepsy Research, Seizure, Brain |
|
94 | There is insufficient evidence on effectiveness and cost-effectiveness of imaging techniques in the work-up for epilepsy surgery to inform clinical practice. |
| MSAC, 2004 (30) | What is the value of PET prior to surgery in patients with refractory epilepsy where there is no focus with concordant results on usual | 1999–June 2004 | MEDLINE, EMBASE, Cochrane Library, Current Contents, Pre- |
|
12 | In patients where there is no focus with concordant results on usual structural imaging and EEG, PET is safe, |
| structural imaging and EEG? | MEDLINE, CINAHL, DARE, CCTR, HTA databases |
|
provides localizing information and is likely cost-effective over the long-term. | |||
| Blue Cross Blue Shield, 2003 (43) |
|
1995–July 2003 | MEDLINE |
|
13 | MEG/MSI for presurgical localization of seizure foci does not meet the criteria to recommend coverage. *The national Blue Cross Blue Shield does not cover MEG, however, some state-run Blue Cross Blue Shield organizations do cover MEG (personal communication, November 17, 2006). |
| AETMIS, 2001 (29) | What is the value of PET prior to surgery in patients with refractory epilepsy? | 1999-2001 | MEDLINE, EMBASE, CancerLit, Cochrane library |
|
5 | In refractory epilepsy, the clinical utility of PET is recognized for localizing epileptogenic foci in patients with refractory epilepsy being considered for surgery, and where inconclusive localizing information is provided by standard assessment, including seizure semiology, EEG and MRI. |
| MSAC, 2000 (31) | What is the value of PET prior to surgery in patients with refractory epilepsy? | 1966-January 2000 | MEDLINE, Cochrane library, HTA Web sites |
|
5 | Patients undergoing surgery may benefit from a PET scan, however, it is unclear if PET will benefit all patients with refractory epilepsy. |
| Parkinson’s disease | ||||||
| Tolosa et al., 2006 (44) | What is the most appropriate method for diagnosing PD? Methods investigated included: drug challenge, olfactory testing, clinical neurophysiology, ultrasound, CT, MRI, SPECT, and PET | 1966-2005 | MEDLINE, hand searches of citations from previous reviews |
|
unclear | Clinical diagnosis is still the gold standard even though up to 30% of patients with parkinsonism will be reclassified. SPECT and PET could improve the differential diagnosis of parkinsonism, however, the cost-effectiveness of this has yet to be established. |
| AHRQ, 2003 (45) | What are the results of neuroimaging studies or other diagnostic tests in determining the diagnosis of PD? | 1990-2000 | MEDLINE, Current Contents, Cochrane Library |
|
10 | Evidence regarding PET & SPECT is inconsistent. MRI may be able to rule out other conditions, NOT useful for diagnosing PD. |
| Clarke & Lowry, 2001 (46) | The differential diagnosis of parkinsonian syndromes with MRS | 1966-1999 | MEDLINE |
|
11 groups of authors | No clear conclusions could be drawn from the heterogeneous results. |
AD indicates Alzheimer’s disease; CT, computed tomography; ECoG, electrocortography; EEG, electroencephalogram; FDA, Food and Drug Administration; FDG, 18F-labelled-fluorodeoxyglucose; fMRI, functional magnetic resonance imaging; HTA, health technology assessment; ICEEG, Intracranial electroencephalogram; MCI, mild cognitive impairment; MEG, magnetoencephalography; MRI, magnetic resonance imaging; MRS, magnetic resonance spectroscopy; MSI, magnetic source images; NR, not reported; PD, Parkinson’s disease; PET, positron emission tomography; SPECT, single photon emission computed tomography.
Sources searched: AAN indicates American Academy of Neurology; ACR, American College of Radiology; AHRQ, Agency for Health Research and Quality; ASNR, American Society of Neuroradiology; CINAHL, Cumulative Index to Nursing & Allied Health Literature; CCTR, Cochrane Controlled Trials Register; CMS, Centers for Medicare & Medicaid Services; DARE, Database of Abstracts of Reviews of Effectiveness; ECRI, ECRI Institute; GIN, Guidelines International Network; HealthSTAR, Health Services Technology, Administration, and Research; ISMRM, International Society for Magnetic Resonance in Medicine; INAHTA, The International Network of Agencies for Health Technology Assessment; LILACS, Latin American and Caribbean Health Sciences Literature; MSAC, Medical Service Advisory Committee; NGC, National Guideline Clearinghouse; NHS, National Health Service; NICE, National Institute of Clinical Evidence; RSNA, Radiological Society of North America; VATAP, Veteran Affairs Technology Assessment Program.
There were 4 health technology assessments identified that investigated the role of PET in patients with epilepsy: one by the National Health Service (NHS) in the United Kingdom (9), one by the Agence d'Évaluation des Technologies et des Modes d'Intervention en Santé, (AETMIS) in Canada (29) and 2 by the Medical Services Advisory Committee (MSAC) in Australia. (30;31)
The most recent review by the NHS (9) in 2006 incorporated various neuroimaging technologies including PET, MRS, and SPECT. It did not include MEG or fMRI. Based on their thorough review of the literature, they concluded that the limitations of the neuroimaging studies identified “...did little to inform clinical practice.”
The first health technology assessment by MSAC (31) was published in 2000, and reviewed PET for various indications, including epilepsy. Based on this review they concluded that some patients with refractory epilepsy may benefit from presurgical PET scans; however, it was unclear if PET scans could benefit all patients with refractory epilepsy. In 2004, MSAC (30) published a health technology assessment on the use of PET specifically in patients with epilepsy. Despite a lack of high-quality evidence and substantial limitations with the available evidence (including inconsistency in defining a reference standard and assuming that PET results alter patient management without evidence), MSAC concluded that PET scans are clinically useful in patients with refractory epilepsy, where there are inconsistent results on structural imaging and EEG.
The 2001 health technology assessment by AETMIS (29) made a similar conclusion to MSAC.
In addition to the health technology assessments presented in Table 4, in 1999 INAHTA (32) published a review of systematic reviews investigating the role of PET for various conditions and indications. They grouped the systematic reviews into 3 main categories: neuropsychiatry, cardiology and oncology (non-CNS tumours). The category of neuropsychiatry included AD, PD, epilepsy, brain tumours, cerebrovascular disorders, other neurodegenerative disorders, and other neuropsychiatry conditions. Between 1990 and 1999, they identified 13 systematic reviews by 10 health technology assessment organizations investigating one or a combination of the aforementioned neuropsychiatry conditions. The INAHTA review reported that most of the studies included in the systematic reviews used 18F-labelled-fluorodeoxyglucose (FDG)-PET to study glucose metabolism.
Three of the systematic reviews identified included studies of patients with brain tumours. According to the INAHTA review, the 3 systematic reviews were not able to demonstrate an added benefit of PET in the management of patients with brain tumours. Based on the limited evidence available, they reported that SPECT was superior to PET, while CT and MRI were inferior to PET for the differentiation between brain tumour recurrence and radiation necrosis. There was a paucity of high-quality controlled studies available to review effectively the evidence on the use of PET in patients with suspected brain tumours.
The INAHTA review identified 8 health technology assessments and systematic reviews on the clinical utility of PET in the management of epilepsy. Diagnostic imaging is most frequently used in patients with intractable epilepsy undergoing presurgical evaluation to identify the epileptogenic foci and to determine resectability. Among the 8 reviews, there were conflicting reports on study quality; however, all of the reviews’ authors agreed that there was insufficient evidence to support replacing ICEEG or MRI with PET. The review reported that more high-quality evidence was required on the clinical utility of PET for epilepsy.
The review by Tolosa et al. (44) summarized the usefulness of various strategies for diagnosing PD. They concluded that drug challenge and MRI were useful in routine practice for making differential diagnoses of parkinsonism, and that SPECT was useful in routine practice in the early diagnosis of PD. Positron emission tomography was deemed to be of limited clinical use at this time, and further research was required to attempt to establish a role for PET in the diagnosis of PD (Table 5).
Table 5: Role of Diagnostic Techniques in Parkinson’s Disease*.
| Diagnostic Test | Early Diagnosis | Differential Diagnosis | Available in Ontario |
|---|---|---|---|
| Drug challenge | Not useful | Useful in routine practice | Yes |
| CT | Not useful | Limited use | Yes |
| MRI | Not useful | Useful in routine practice | Yes |
| SPECT-DAT | Useful in routine practice | Limited use | Yes |
| SPECT-IBZM | Not useful | Limited use | Yes |
| PET-FDOPA | Limited use | Limited use | Restricted |
| PET-FDG | Not useful | Limited use | Restricted |
| PET-RACLO | Not useful | Limited use | Restricted |
CT refers to computed tomography; DAT, dopamine transporter; FDOPA, fluorodopa; FDG, 18F-labelled-fluorodeoxyglucose; IBZM, 123-iodobenzamide; MRI, magnetic resonance imaging; PET, positron emission tomography; RACLO, 11-C-Raclopride; SPECT, single photon emission computed tomography.
Reprinted from Lancet Neurology, 5(1), Tolosa E, Wenning G, Poewe W., The diagnosis of Parkinson's disease, pp 75–86, Copyright 2006, with permission from Elsevier.
Summary of Medical Advisory Secretariat Review of Functional Brain Imaging
The literature review did not identify any RCTs that studied the clinical utility of functional brain imaging in the management or diagnosis of patients with any of the conditions being reviewed. Table 8 lists the level of evidence and number of studies identified.
Table 8: Characteristics of Studies of Functional Brain Imaging in the Diagnosis of Alzheimer’s Disease*.
| Study | Type of Study | Imaging Modality | N | Description of Patients | Reference Standard | % Male | Mean (SD) Age, Years |
|---|---|---|---|---|---|---|---|
| Kawachi et al, 2006 (47) | Prospective cohort-control | FDG-PET | 62 (60 healthy volunteers) | Very mild or mild AD | Clinical criteria (NINCDS/ADRDA), follow-up 1 year | 27 | 67(5.8) |
| Dobert et al., 2005 (48) | Prospective cohort | FDG-PET, SPECT | 24 | Clinical suspicion of beginning dementia | Clinical follow-up 16 SD=12 months | 46 | 69 (6.8) |
| Drzezga et al., 2005 (49) | Prospective cohort | FDG-PET | 30 | MCI | Clinical follow-up 16 SD=2 months | 47 | 70 (8) |
AD indicates Alzheimer’s disease; FDG, 18F-labelled-fluorodeoxyglucose; MCI, mild cognitive impairment; NINCDS/ADRDA, National Institute of Neurological and Communicative Disorders and Stroke/Alzheimer’s Disease and Related Disorders Association; PET, positron emission tomography; SD, standard deviation; SPECT, single photon emission computed tomography.
Table 6: Level of Evidence of Included Studies*.
| Study Design | Level of Evidence |
Number of Eligible Studies |
|---|---|---|
| Large RCT, systematic reviews of RCT | 1 | 0 |
| Large RCT unpublished but reported to an international scientific meeting | 1(g) | 0 |
| Small RCT | 2 | 0 |
| Small RCT unpublished but reported to an international scientific meeting | 2(g) | 0 |
| Non-RCT with contemporaneous controls | 3a | 4 |
| Non-RCT with historical controls | 3b | 0 |
| Non-RCT presented at international conference | 3(g) | 0 |
| Surveillance (database or register) | 4a | 1 |
| Case series (multisite) | 4b | 22 |
| Case series (single site) | 4c | 0 |
| Retrospective review, modeling | 4d | 14 |
| Case series presented at international conference | 4(g) | 0 |
g indicates grey literature; RCT, randomized controlled trial.
In addition to determining the level of evidence, studies were also classified according to the hierarchy of diagnostic evaluation defined by Fryback and Thronbury. (28) Examples of each level in the hierarchy are described in Table 3. Table 7 outlines the number of studies identified for this review according to the hierarchy. It is important to note that level 1 studies (i.e., technical feasibility studies) were not eligible for inclusion in this review.
Table 7: Hierarchy of Diagnostic Evaluation and the Number of Studies Available for Assessing the Diagnosis of Parkinson’s Disease*.
| Level | Description | Number of Studies (References) | ||||
|---|---|---|---|---|---|---|
| Alzheimer’s Disease | Brain Tumour | Epilepsy | Multiple Sclerosis | Parkinson’s Disease | ||
| 1 | Technical feasibility and optimization | N/A† | N/A† | N/A† | N/A† | N/A† |
| 2 | Diagnostic accuracy | 3 PET (47-49) | 7 PET (50-56) 4 MRS (57-60) 1 PET + MRS (61) |
4 PET (62-65) 5 fMRI (66-70) 8 MEG (71-78) |
--- | 3 PET (79-81) |
| 3 | Diagnostic thinking impact | — | — | 1 PET (82) 1 fMRI (67) 1 MEG (83) |
— | — |
| 4 | Therapeutic choice impact | 1 PET (84) | 1 fMRI (85) | — | — | — |
| 5 | Patient outcome impact | — | 1 fMRI (86) | — | — | — |
| 6 | Societal impact | — | — | — | — | — |
fMRI indicates functional magnetic resonance imaging; MEG, magnetoencephalography; N/A, not applicable; PET, positron emission tomography.
Level 1 studies of technical feasibility and optimization were not eligible for inclusion..
Results: Alzheimer’s Disease
What is the role of functional brain imaging in the diagnosis of Alzheimer’s disease?
There were no studies identified that met the inclusion criteria for this review that investigated the role of MEG, MRS or fMRI in the diagnosis of AD compared with a reference standard for diagnosis.
In 2003, Kulasingam et al. (84) developed a decision analysis regarding the use of PET in the diagnosis and management of AD. Their Markov-model-based decision analysis included asymptomatic men and women with a first-degree relative with AD or patients with mild dementia. The subjects were diagnosed based on the American Academy of Neurology (AAN) criteria alone or with PET and the AAN criteria. The AAN criteria consist of a complete history, physical and neuropsychological evaluations, and structural imaging tests (e.g., MRI or CT). Kulasingam et al. concluded that even though PET may provide a more accurate diagnosis than the AAN evaluation alone, there is not likely to be a clinical benefit of using PET. Their conclusion was based on the fact that cholinesterase inhibitors are the standard current medical management for AD, which is associated with few severe adverse events. Kulasingam et al. argued that if the most effective medical management for AD was associated with significant severe adverse events, then the use of PET may be more applicable in minimizing the number of false positive cases.
In a more recent publication, Kulasingam et al. (87) proposed a pragmatic trial of PET for AD; however, at this time, it does not appear that this trial has been initiated (personal communication, November 2, 2006).
Since the publication of the Agency for Health Research and Quality (AHRQ) health technology assessment in 2004, there were 3 additional studies (47-49) identified for this review confirming the accuracy of PET in the diagnosis of AD. However, none of these studies assessed whether the clinical outcomes for patients diagnosed with AD by PET are better than the outcomes for patients diagnosed by clinical evaluation. Table 8 describes the characteristics these studies.
Each of the studies used a different comparison with PET (MRI, SPECT, genetic assessment) (Table 9).
Table 9: Sensitivity and Specificity Reported in the Studies of Functional Brain Imaging for Alzheimer’s Disease*.
| Study | Imaging Modality |
N | Condition | Accuracy, % | Sensitivity, % | Specificity, % | PPV, % | NPV, % |
|---|---|---|---|---|---|---|---|---|
| Kawachi et al., 2006 (47) | PET | 30 + 60 healtdy volunteers | Very mild AD | 88.5 | — | — | — | — |
| VBM-MRI | 82.9 | — | — | — | — | |||
| Dobert et al., 2005 (48) | PET | 24 | Alzheimer’s or mixed type of dementia | — | 91.7 | 88.9 | 94.1 | 100 |
| SPECT | — | 64.0 | 84.2 | 70.0 | 64 | |||
| Drzezga et al., 2005 (49) | PET | 30 | MCI | 90.0 | 92.0 | 89.0 | 85.0 | 94 |
| Genetic assessment (APOE genotype) | 63.0 | 75.0 | 56.0 | 53.0 | 77 |
AD indicates Alzheimer’s disease; MCI, mild cognitive impairment; MRI, magnetic resonance imaging; NPV, negative predictive value; PET, positron emission tomography; PPV, positive predictive value; SPECT, single photon emission computed tomography; VBM, voxel-based morphology.
Also, as mentioned previously, none of these studies reported patient outcomes on the basis of the PET diagnosis. Consistent with the results of the AHRQ health technology assessment, the sensitivity and specificity of PET in these 3 studies was high (about 92% sensitivity and 89% specificity). From this it was concluded that despite diagnostic accuracy, evidence of clinical utility for PET in AD is lacking.
Results: Brain Tumours
There were 3 questions this review asked with respect to functional brain imaging for brain tumours:
What is the role of functional brain imaging in the detection of primary tumours?
What is the role of functional brain imaging in the differentiation of recurrence from radiation necrosis?
What is the role of functional brain imaging in the selection of surgical candidates for tumour resection?
What is the Role of Functional Brain Imaging in the Detection of Primary Tumours?
In all of the studies identified that investigated the role of functional brain imaging in the detection of primary tumours, a suspicious lesion had already been identified; thus, the role of functional brain imaging was to determine if the lesion was benign or malignant. In most cases the reference standard was biopsy; however, in some cases, postoperative follow-up was used as the reference standard.
Six studies were identified that met the inclusion criteria for this review and that had been published since the most recent health technology assessments on functional brain imaging for brain tumours. Five investigated the role of PET using various radiotracers (18F-FDG, 18F-FLT, 11C-MET), and the other study investigated PET and MRS. Table 10 describes the characteristics of these studies. It is important to note that the half-lives for the radiotracers are variable, making some more appropriate for clinical practice than others. (Table 2 lists the half-lives of commonly used radiopharmaceuticals in PET scans)
Table 10: Characteristics of Studies Investigating the Detection and Grading of Primary Tumours With Functional Brain Imaging*.
| Study | Type of Study | Imaging Type | N | Type of Tumour |
Blind | Reference Standard |
Male, % | Mean Age, Years |
|---|---|---|---|---|---|---|---|---|
| Wang, 2006 (50) | PCS | 18F-FDG-PET | 117 (156 scans) 5 patientslost |
39 primary tumours; 78 with metastases | No | Biopsy, resection, or clinical follow-up ≥ 2 years for primary tumours | 50 | 52.9 (range, 7.9–81.4) |
| Choi, 2005 (51) | PCS | 18F-FLT PET | 26 | 26 with suspected tumours on MRI: 19 primary, 7 previously treated | No | 23 biopsy (no time frame reported) 3 clinical follow-up | 58 | Median 34(range, 2–67) |
| Jacobs, 2005 (53) | PCS | 11C-MET PET 18F-FLT PET | 23 | Grade I=1; Grade II=8; Grade III=7 ; Grade IV=7; 15 treated; 8 untreated |
No | Biopsy | 48 | 47.1 (SD, 14.6; range 20–70) |
| Pauleit, 2005 (52) | PCS | 18F-FET PET | 31 -3 patients excludeed | Grade I=2; Grade II=7; Grade III=12; Grade IV=2; Reactive astrogliosis= 5 |
Yes | Biopsy | 32 | 42 (SD, 20) |
| Kracht, 2004 (54) | RS | 11C-MET PET | 30 | 22 primary; 8 suspected recurrence | No | Biopsy | 47 | 40 (SD, 8.9) |
| Floeth, 2005 (61) | PCS | MRS and 18F-FET PET | 91 had FET-PET (50 had MRS + FET PET) | Newly diagnosed glioma based on MRI | No | Biopsy | 42 | 44.3, (range, 2–74; SD, NR) |
FDG indicates 18F-labelled-fluorodeoxyglucose; FET, O-(218F-Fluoroethyl) –L-tyrosine; FLT, 18F-labelled-fluoro-3’-deoxyl-3’-L-fluorothymidine; MET, L-methyl-11C-methionine; MRI, magnetic resonance imaging; MRS, magnetic resonance spectroscopy; NR, not reported; PCS, prospective cohort study; PET, positron emission tomography; RS, retrospective study; SD, standard deviation.
Only the study by Pauleit et al. (52) blinded the clinicians from the patients’ clinical histories. All of the studies established tumour diagnosis with biopsy or resection. Not all of the patients in all of the studies had suspected primary tumours, because there were patients in some of the studies who had been treated previously.
In the prospective study by Wang et al., (50) patients were included if they had positive but inconclusive MRI or CT results. The majority of patients in their study had brain metastases (n = 78) compared with primary brain tumours (n = 39); however, since they stratified the results for primary diagnoses and metastases, this study was eligible for inclusion.
The results of the studies investigating functional brain imaging for diagnosing malignant versus benign brain tumours are listed in Table 11. The thresholds defined by the studies are variable. The thresholds in the PET studies are ratios between normal tissue uptake of a radiotracer versus abnormal uptake. The thresholds in MRS studies are ratios between the metabolites.
Table 11: Results of Studies Investigating Functional Brain Imaging for Diagnosing Malignant Versus Benign Lesions*.
| Study | Imaging Type |
Type of Tumour |
Malignant/ Benign Diagnoses Confirmed by Biopsy |
Threshold | Sensitivity, % |
Specificity, % |
|---|---|---|---|---|---|---|
| Wang et al., 2006 (50)† | 18F-FDG PET | Primary | Of 17 patients with biopsy results: 10/7 | Visual inspection | 76 | 96 |
| Choi et al., 2005 (51) | 18F-FLT PET | Primary and recurrent | 18/8 | Visual inspection | 79 | 63 |
| Jacobs et al., 2005 (53) | 11C-MET PET | Primary | 23/0 | 1.3 | 91 | All patients had tumour |
| 18F-FLT PET | 2.0 | 78 | ||||
| Pauleit et al., 2005 (52)‡ | 18F-FET PET | Primary | 20/8 | 1.6 | 93 | 94 |
| MRI (Gd enhanced, T1) | 0.9 | 96 | 53 | |||
| Kracht et al., 2004 (54) | 11C-MET PET | Primary and recurrent | 24/6 | 1.3 | 87 | 89 |
| Floeth et al., 2005 (61) | MRS | Primary | 34/16 | NAA/Cho 0.7 Low or absence of NAA or high Cho indicative of tumour | 100 | 81 |
| 18F-FET PET | tumour/brain tissue ratio 1.6 | 88 | 88 | |||
| MRI (Gd-enhanced, T1) | NR | 44 | 69 |
Cho indicates choline; FDG, 18F-labelled-fluorodeoxyglucose; FET, O-(218F-Fluoroethyl)-L-tyrosine; FLT, 18F-labelled-fluoro-3’-deoxyl-3’-L-fluorothymidine; Gd, gadolinium; MET, L-methyl-11C-methionine; MRI, magnetic resonance imaging; MRS, magnetic resonance spectroscopy; NAA, N-acetyaspartate; NR, not reported; PET, positron emission tomography.
Wang et al. (50) also reported that there were 13 cases which were indeterminate on PET scans, thus did not make a diagnosis and were not included in the accuracy calculations.
In the study by Pauleit, the 3 readers used a 6-point scale to establish presence or absence of a brain tumour. The scale was as follows: 6, definitely positive; 5, probably positive; 4, possible positive; 3, possibly negative; 2, probably negative; 1, definitely negative for tumour tissue. For the determination of sensitivity and specificity, a score greater than or equal to 4 was considered positive for tumour tissue.
Two of the studies relied on visual inspection to determine if a tumour was present, while all of the other studies defined quantitative thresholds. The threshold in the study by Wang et al. (50) was by visual inspection; however, they stated that if the FDG uptake in or near the lesion was lower than the surrounding tissue, the PET scan was considered to be negative. Alternatively, if the FDG uptake was higher in or near the lesion, the PET scan was considered positive. The study by Choi et al. (51) also made similar specifications for their visual inspection of images with FDG and FLT.
In all studies, most patients underwent MRI in addition to the MRS or PET scan. Only 2 of the studies compared the accuracy of MRS or PET and MRI, with MRI alone. (52;61) Gadolinium-enhanced MRI is the gold standard for the diagnosis of primary tumours (personal communication, clinical expert, November 15, 2006), thus a comparison to Gd-enhanced MRI is very worthwhile to establish if the results of the MRS or PET scans improve the accuracy of tumour diagnosis.
In the prospective study by Floeth et al., (61) patients with suspected primary tumours underwent MRI (Gd-enhanced), MRS, and FET-PET. Ninety-one patients received FET-PET; 50 of these also received a MRS analysis. Of the 50 patients undergoing PET, MRS, and MRI, 34 (68%) had malignant tumours confirmed after biopsies. Compared with MRS and FET-PET, Gd-enhanced MRI alone had lower sensitivity and specificity. Floeth et al. did not report if this difference in sensitivity and specificity was significant; however, they did report that by adding MRS and FET-PET to MRI the accuracy increased from 68% for MRI alone to 97% for MRS, FET-PET, and MRI. They did not report the accuracy of MRS and MRI without FET-PET, nor did they report the accuracy of FET-PET and MRI without MRS. There are some limitations of this study, including that the 2 neurosurgeons who reviewed the test results were not blinded, and that not all patients received the same intervention. It was unclear why some patients had MRS analyses and others did not.
The prospective study by Pauleit et al. (52) studied the use of FET-PET in 31 newly diagnosed patients with primary gliomas. They reported that compared with MRI (Gd-enhanced) alone, combining FET-PET with MRI (Gd-enhanced) resulted in a similar sensitivity (96% for MRI alone, 93% for FET-PET + MRI) and higher specificity (53% for MRI alone, 94% for FET-PET + MRI) for tumour diagnosis. The 3 observers who reviewed the results were blinded to the clinical information of the patients included in the study. Twenty (71%) of 28 patients analyzed (3 patients were excluded from the analysis) had malignant tumours confirmed by biopsies.
Table 12 groups the results for sensitivity and specificity by imaging modality and radiotracer and threshold. In both 11C-MET PET and 18F-FET PET, sensitivities and specificities are consistently high.
Table 12: Sensitivity and Specificity for Functional Brain Imaging for the Diagnosis of Brain Tumours*.
| Accuracy | 18F-FDG PET |
18F-FLT PET | 18F-FLT PET | 11C-MET PET |
18F-FET PET | MRS |
|---|---|---|---|---|---|---|
| Threshold | Visual inspection | Visual inspection | 2.0 | 1.3 | 1.6 | NAA/Cho 0.7 Low or absence of NAA or high Cho indicative of tumour |
| Sensitivity | 76% | 79% | 78% | 91% 87% |
93% 92% 88% |
100% |
| — | 94% 81% |
81% | ||||
| Specificity | 96% | 63% | — | 89% | 88% |
Cho indicates choline; FDG, 18F-labelled-fluorodeoxyglucose; FET, O-(218F-Fluoroethyl)-L -tyrosine; FLT, 18F-labelled-fluoro-3’-deoxyl-3’-L-fluorothymidine; MET, L-methyl-11C-methionine; MRS, magnetic resonance spectroscopy; NAA, N-acetylaspartate; PET, positron emission tomography.
Unfortunately, none of these authors commented on whether the accurate diagnosis of brain tumours had an impact on treatment or clinical outcomes in the patients in these studies. Patients with primary tumours are likely to have biopsies despite imaging results (personal communication, clinical expert, December 5, 2006).
What is the Role of Functional Brain Imaging in the Differentiation of Recurrence From Radiation Necrosis?
There were 6 studies identified since the most recent health technology assessments were published that examined the use of functional brain imaging in the differentiation of recurrence and radiation necrosis (3 RS’ and 3 prospective studies). Four used MRS and the other 2 used PET (18F-FDG, 18F-FDOPA and 18F-FET). Table 13 describes the characteristics of the studies.
Table 13: Characteristics of Studies Investigating the Differentiation of Recurrence From Radiation Ncrosis Using Functional Brain Imaging*.
| Study | Type of Study | Imaging Type | N | Type of Tumour | Duration Since Treatment for Primary Diagnosis, Months | Blinded | Ref. Standard | Male, % | Mean Age, Years |
|---|---|---|---|---|---|---|---|---|---|
| Chen et al., 2006 (55) | PCS | 18F-FDOPA PET 18F-FDG PET | 30 | 11 primary 70 previously treated Only 30 patients underwent PET scans | NR | No | 15 patients biopsy within 3 wks 15 patients clinical follow-up, mean 20 mths | 60 | 45.2 (SD, 14; range, 23–68) |
| Sundgren et al., 2006 (58) | RS | MRS | 28 | Previously treated brain tumours (various) | Mean, 23(range, 6–56) | Yes | Biopsy, surgery, clinical follow-up | 54 | 35 (range, 5–56) |
| Rachinger et al., 2005 (56) | RS | 18F-FET PET | 45 | Previously treated brain tumours (various) | NR | No | 27 biopsy 5 resection 13 clinical follow-up | 51 | 45 (SD, 12;range, 26–75) |
| Palumbo et al., 2006 (60) | RS | MRS | 30 glioma patients-operated on and treated with RT | Previously treated brain tumours (various) | 6-12 | No | Biopsy/resection | 73 | 53.5 (SD, 14; range, 25–76) |
| Lichy et al., 2005 (57) | RS | MRS | 34 (23 included in analysis) | Previously treated brain tumours (various) | 37 (SD, 12 months) | Yes | Biopsy/resection | 65 | Median, 45(range, 18–70) |
| Weybright et al., 2005 (59) | PCS(cones-cutive) | MRS | 29 (28 in analysis) | Previously treated brain tumours (various) | 2–108 months | No | Biopsy/resection | 55 | 34 (range, 4–54) |
FDG indicates 18F-labelled-fluorodeoxyglucose; FDOPA, fluorodopa ; FET, O-(218F-Fluoroethyl)-L -tyrosine; MRS, magnetic resonance spectroscopy; NR, not reported; PCS, prospective cohort study; PET, positron emission tomography; RS, retrospective study; RT, radiation therapy; SD, standard deviation.
Table 14 outlines the results reported by each of the 6 studies identified that used MRS or PET to differentiate recurrence from radiation necrosis. Similar to the studies identifying primary brain tumours, various thresholds were used to determine presence of recurrence.
Table 14: Results of Studies Investigating Functional Brain Imaging for Brain Tumours*.
| Study | Imaging Type | Type of Tumour | Recurrence/ Benign Diagnosis Based on Biopsy |
Threshold | Sensitivity, % | Specificity, % |
|---|---|---|---|---|---|---|
| Chen, 2006 (55) | 18F-FDOPA PET | Primary and recurrent | 23/7 | Visual inspection | 96 | 43 |
| 18F-FDG PET | 61 | 43 | ||||
| Rachinger, 2005 (56) | 18F-FET PET | Various | 31/14 | 2.2 | 100 | 93 |
| MRI (Gd enhanced) | > 25% increase in tumour | 94 | 50 | |||
| Palumbo, 2006 (60) | MRS | Various | 20/10 | Cho/Cr 2.0 | 90 | 100 |
| SPECT | NR | 90 | 83 | |||
| Sundgren et al., 2006 (58)† | MRS | Various | 18/10 | Cho/Cr 1.8 Cho/NAA 1.8 (same results for both ratios) | ‡88 | ‡70 |
| Lichy et al., 2005 (57) | MRS | Various | 16/7 | Cho/Cr 2.0 | 81 | 71 |
| MRI T1-Gd-enhanced | > 25% increase in tumour | 81 | 57 | |||
| MRI T1 -Gd-enhanced + T2 | 94 | 86 | ||||
| MRS + MRI T1GD-enhanced+T2 | 100 | 86 | ||||
| Weybright et al., 2005 (59) † | MRS | Various | 16/12 | Cho/Cr 1.8 Cho/NAA 1.8 (same results for both ratios) | 94 | 100 |
Cho indicates choline; Cr, creatine; 18F-FDG, 18F-labelled-fluorodeoxyglucose; FDOPA, fluorodopa ;18F-FET, O-(2-18F-Fluoroethyl)-L-tyrosine; Gd, gadolinium; MRI, magnetic resonance imaging; MRS, magnetic resonance spectroscopy; NAA, N-acetyl aspartate; NR, not reported; PET, positron emission tomography; SPECT, single photon emission computed tomography; gadolinium enhanced .
Medical Advisory Secretariat calculation.
The study by Rachinger et al. (56) compared FET-PET with MRI (with and without Gd enhancement) to MRI alone in 45 patients with suspected tumour recurrence. They found that MRI with FET-PET had higher specificity than MRI alone (93% versus 50%, respectively). Sensitivity was also higher for PET with MRI versus MRI alone (100% versus 94%). Rachinger et al. reported that the difference in accuracy between PET and MRI versus MRI alone was significant (P ≤.05). It is unclear whether the reviewers of the PET and MRI results were blinded to the patients’ clinical information.
The study by Lichy et al. (57) was the only study identified that compared MRS with Gd-enhanced MRI to Gd-enhanced MRI alone. They reported the highest sensitivity and specificity when MRS was combined with T1 (Gd-enhanced) and T2 MRI (100% and 86%, respectively); however, T1 and T2 MRI also had high sensitivity and specificity without MRS (94% and 86%, respectively). It is unclear if the added benefit of MRS in terms of sensitivity is significant.
The sensitivity and specificity in the study by Sundgren et al. (58) were calculated by the Medical Advisory Secretariat using the following assumptions:
True positive: Patients with recurrence on MRS confirmed through clinical, neuroradiologic or neuropathologic follow-up.
True negative: Patients with radiation injury on MRS confirmed through clinical, neuroradiologic or neuropathologic follow-up.
False positive: Patients with recurrence or inconclusive results on MRS but radiation injury confirmed through clinical, neuroradiologic or neuropathologic follow-up.
False negative: Patients with radiation injury on MRS but recurrence confirmed through clinical, neuroradiologic or neuropathologic follow-up.
Based on these assumptions, the sensitivity and specificity for MRS in this study were 88% and 70%, respectively.
Table 15 groups the results for sensitivity and specificity by imaging modality and radiotracer and threshold. Both of the studies by Palumbo et al. (60) and Lichy et al. (57) reported accuracy for MRS using the Cho/Cr ratio threshold of 2.0. The study by Palumbo et al. reported a higher specificity than sensitivity (90% sensitivity, 100% specificity) while the study by Lichy et al. reported a higher sensitivity than specificity (81% sensitivity, 71% specificity). The study by Weybright et al. (59) also reported accuracy of MRS using Cho/Cr ratio; however, they used a different threshold (1.8), but they reported similar results to Palumbo et al. (94% sensitivity and 100% specificity).
Table 15: Sensitivity and Specificity for Functional Brain Imaging for the Diagnosis of Brain Tumours*.
| Accuracy | 18F-FDG PET |
18F-FET PET | 18F- FDOPA |
MRI T1 + T2 |
MRS | MRS | SPECT |
|---|---|---|---|---|---|---|---|
| Threshold | Visual inspection | 2.2 | Visual inspection | ≥25% increase in tumour | Cho/Cr 1.8 or Cho/NAA | Cho/Cr2.0 | NR |
| Sensitivity % | 61 | 100 | 96 | 94 94 |
94 †88 |
90 81 |
90 |
| Specificity % | 43 | 93 | 43 | 50 86 |
100 †70 |
100 71 |
83 |
Cho indicates choline; Cr, creatine; 18F-FDG, 18F-labelled-fluorodeoxyglucose; FDOPA, fluorodopa;18F-FET, O-(2-18F-Fluoroethyl)-L-tyrosine; MRI, magnetic resonance imaging; MRS, magnetic resonance spectroscopy; NAA, N-acetyl aspartate; NR, not reported; PET, positron emission tomography; SPECT, single photon emission computed tomography; T1, gadolinium enhanced.
Medical Advisory Secretariat Calculation
Rachinger et al. reported the highest sensitivity (100%) using 18F-FET-PET. The highest specificity (100%) was reported by Palumbo et al. and by Weybright et al. for MRS using the Cho/Cr ratio.
As in those studies that investigated the use of PET and MRS in patients with primary tumours, none of these studies reported how the accuracy of diagnosis had an impact on treatment or clinical outcomes.
What is the Role of Functional Brain Imaging in the Selection of Surgical Candidates for Tumour Resection?
There is considerable evidence indicating that fMRI and MEG can accurately identify the sensorimotor complex; (88-97) however, the impact of this on surgical outcomes is not reported in the studies identified. The role of fMRI is to identify the language, sensory, and motor areas of the brain, with the aim of establishing whether tumour resection will affect language, sensory, or motor function. The primary purpose of fMRI is not to identify tumours, as it is with PET and MRS.
One study, by Ganslandt et al., (98) reported on surgical outcome after fMRI or MEG, but did not provide a comparison of what the surgical outcome would have been without fMRI or MEG.
Two studies (85;86) were identified that described the role of functional brain imaging in the selection of surgical candidates for tumour resection. Both investigated the role of fMRI in the selection of patients for surgery.
The case-control study by Winkler et al. (86) compared surgical outcomes in patients with brain tumours who had preoperative imaging with fMRI (n = 49) with those who underwent surgery without preoperative fMRI (historical controls, n = 55). In both groups there were patients with meningiomas (18 in experimental group, 19 in control group), metastases (9 in experimental group, 19 in control group), and stage II to IV gliomas (22 in experimental group, 17 in control group). The mean age of the patients was 53.9 years (range, 14–78 years) in the experimental group, and 52.3 years (range 21–76 years) in the control group.
At 6 months postoperatively, patients were categorized as “improved,” “unchanged,” or “deteriorated” in terms of neurological function; tumour outcome results were not reported. Table 16 outlines the results. Winkler et al. reported the results separately for the various tumour types.
Table 16: Outcomes of Patients With Preoperative Functional Magnetic Resonance Imaging Versus Without Preoperative Functional Magnetic Resonance Imaging 6 Months Postoperatively*.
| Unchanged | Improved | Deteriorated | ||||
|---|---|---|---|---|---|---|
| Tumour Type | Preop fMRI (%) |
Control (%) | Preop fMRI (%) |
Control (%) | Preop fMRI (%) |
Control (%) |
| Meningiomas (n = 37) | 14 (78) | 13 (68) | 2 (11) | 4 (21) | 2 (11) | 2 (11) |
| Metastases (n = 28) | 6 (67) | 12 (63) | 2 (22) | 3 (16) | 1 (11) | 4 (21) |
| Gliomas (n = 39) | 15 (68) | 5 (29) | 2 (9) | 5 (29) | 5 (23) | 7 (40) |
| Total (N = 104) | 35 (71) | 30 (55) | 6 (12) | 12 (22) | 8 (16) | 13 (24) |
fMRI indicates functional magnetic resonance imaging.
Source: Winkler D, Strauss G, Lindner D, Richter A, Georgiadis MH, Von Cramon Y et al. The importance of functional magnetic resonance imaging in neurosurgical treatment of tumors in the central region. Klinische Neuroradiologie 2005; 15:182–189
There appears to be more inconsistency across outcomes in the patients with gliomas compared with the patients with metastases or meningiomas. However, Winkler et al. reported that there were no statistically significant differences in neurological function outcomes between patients who had undergone preoperative fMRI and those who had not. However, due to small sample subsets the study may not have been powered to detect a significant difference in outcomes (Type II error).
This study suffered from several limitations. There was no blinding, nor was there a sample size calculation reported explaining how the authors chose their sample size. There was also limited information regarding eligibility criteria and whether the patients were enrolled consecutively. Nonetheless, this was the only study identified that compared outcomes after surgery based on fMRI.
In the prospective cohort study by Petrella et al., (85) 39 patients with potentially resectable tumours were imaged preoperatively with fMRI. Three neurosurgeons completed a questionnaire regarding the treatment plan for the patients before and after seeing the fMRI results. Petrella et al. did not report what clinical information was provided to the neurosurgeons before the fMRI to develop treatment plans. It is important to note that the role of fMRI is to identify the sensorimotor cortex, not to identify tumours. Table 17 describes the neurosurgeons’ responses before and after fMRI.
Table 17: Responses of Neurosurgeons Before and After Functional Magnetic Resonance Imaging Results Were Analyzed*.
| Surgical Options | Treatment Plan After fMRI | |||
|---|---|---|---|---|
| Treatment Plan BEFORE fMRI |
No Surgery | Biopsy | Craniotomy With Intraoperative Mapping |
Craniotomy With General Anesthesia |
| No surgery | 2 | 2 | 5 | 0 |
| Biopsy | 0 | 0 | 7 | 1 |
| Craniotomy without general anesthesia | 0 | 1 | 13 | 3 |
| Craniotomy with general anesthesia | 0 | 0 | 0 | 5 |
fMRI indicates functional magnetic resonance imaging
Reprinted with permission from the Radiological Society of North America and the author; Petrella JR, Shah LM, Harris KM, Friedman AH, George TM, Sampson JH et al. Preoperative functional MR imaging localization of language and motor areas: Effect on therapeutic decision making in patients with potentially resectable brain tumors. Radiology 2006; 240:793–80.2
Before fMRI the neurosurgeons thought that 9 patients were not suitable for any surgical intervention. After fMRI, the treatment plan for 7 of the 9 patients changed (2 biopsy, 5 craniotomy with mapping). All of the 8 patients who had a biopsy as their treatment plan before fMRI had their treatment plan changed after fMRI. All 8 patients were changed to craniotomy (7 with intraoperative mapping, 1 under general anesthesia). Overall, the treatment plan was altered in 19 of 39 patients (49%; 95% CI, 33%–64%), with 18 of the 19 treatment plans being more aggressive after fMRI.
In addition to the treatment plan, 4 patients also had Wada tests recommended prior to fMRI. After fMRI none of the patients required this invasive test.
It was the clinical impression of the neurosurgeons in the study by Petrella et al. that fMRI shortened surgical time by an estimated 15 to 60 minutes in 60% of patients. However, they did not report how this was calculated.
There is no long-term follow-up reported for the patients in the study by Petrella et al. (85) The authors reported that the “[a]ctual intervention agreed with the treatment plan after functional MR imaging in all 39 patients.”
In summary, fMRI and MEG can accurately identify the sensorimotor cortex, as has been demonstrated in several studies. According to the study by Winkler et al., (86) there is no difference in surgical outcome in patients who have had preoperative fMRI compared with those who have not. However, this was a low-quality study that may not have been powered to detect a significant difference between groups. The study from Petrella et al. (85) demonstrated that the treatment plan for patients changed with the information provided with preoperative fMRI results and that preoperative fMRI may also decrease surgery time.
Results: Epilepsy
What is the Role of Functional Brain Imaging in the Localization of Seizure Foci?
As described earlier in this review, the current gold standard for localizing seizure foci includes video scalp EEG (which is noninvasive, but time consuming, usually involving taking patients off their medications and several days in hospital), MRI, and neuropsychological evaluation. If the results are inconclusive, then invasive ICEEG is considered. The literature has identified 2 possible roles for functional brain imaging in localizing seizure foci:
an imaging test to be used instead of or in addition to noninvasive EEG, and
an imaging test to replace ICEEG.
Functional Brain Imaging Versus Intracranial Electroencephalogram
Intracranial electroencephalogram is the gold standard for localizing seizure foci in patients with inconclusive noninvasive results. Based on 3 studies (described in the Alternative Technologies section of this review), (26;27;99) the range of surgical success (seizure-free or significant improvement in seizures) based on ICEEG is from 57% to 89%.
There were 3 studies identified that investigated the localization of seizure foci with MEG compared with ICEEG. An additional 3 studies from the Blue Cross Blue Shield health technology assessment (43) are also described below to enhance the results of the newly identified studies. In addition, since the Blue Cross and Blue Shield health technology assessment reported that due to insufficient evidence they could not recommend using MEG, the Medical Advisory Secretariat wanted to further investigate previous MEG studies in order to draw some conclusions from the results of the studies on MEG. The Medical Advisory Secretariat extracted the 3 studies from the Blue Cross Blue Shield health technology assessment that included 20 or more patients and compared MEG to ICEEG relative to surgical outcomes. There were no studies identified comparing other functional brain imaging modalities besides MEG to ICEEG. Table 18 describes the characteristics of these studies.
Table 18: Characteristics of Studies Investigating the Localization of Seizure Foci With Functional Brain Imaging Instead of Intracranial Electroencephalogram*.
| Study | Type of Study | N | Description of Patients |
Seizure Origin |
Blind | Reference Standard |
% Male | Mean Age (Range), Years |
|---|---|---|---|---|---|---|---|---|
| Knowlton et al., 2006 (71) | Prospective | 49 | Patients with intractable partial epilepsy | ETLE—21 MTLE—18 LTLE—6 Nonlocalized—4 |
No | ICEEG and/or early surgical outcome | 55 | 27(1-61) |
| Oishi et al., 2006 (78) | Retrospective | 20 | Medically refractory Neocortical epilepsy | Various | No | Seizure outcome postoperatively (1 year follow-up) | 65 | 26.5 (7-52) |
| Papanicolaou et al., 2005 (75) | Retrospective | 41 | Patients with epilepsy who had undergone surgery | TLE—29 ETLE—12 |
Yes | Seizure outcome postoperatively (1 year follow-up) | 54 | 27.4 (7-54) |
| Mamelak et al., 2002 (100) | Prospective | 40 (23 under went ICEEG) | Patients with suspected focal epilepsy, | Yes | Seizure outcome postoperatively (mean 21 months follow- | |||
| refractory | up (range 13– 32)) | |||||||
| Wheless et al., 1999 (101) | Prospective | 58 | Patients with refractory partial epilepsy | TLE—35 ETLE—17 Mixed—6 |
Yes | Seizure outcome (range 6–46 months, 85% of patients had > 12 months follow-up) | 48 | 26.7 (7-55) |
| Gallen et al., 1997 (102) | Prospective | 33 | Patients with intractable epilepsy being considered for surgery | TLE—27 ETLE—6 |
Yes | Seizure outcome postoperatively (> 2 years follow-up) | 61 | 34 (14-58) |
ETLE refers to extratemporal lobe epilepsy; ICEEG, intracranial electroencephalogram; LTLE, lateral temporal lobe epilepsy; MTLE, mesial temporal lobe epilepsy; TLE, temporal lobe epilepsy.
The PCS by Knowlton et al. (71) was designed to address whether MEG can replace ICEEG in the presurgical evaluation of patients with refractory epilepsy. This study has clinical relevance because it compared MEG to ICEEG, the current gold standard. When MEG was compared with ICEEG and surgical outcome, the values for sensitivity and specificity were 75% and 70%, respectively. They also reported subgroup analyses, the results of which suggested that MEG may be less beneficial compared with ICEEG in patients with extratemporal lobe epilepsy (ETLE) compared with those with temporal lobe epilepsy (TLE). This result was based on a subset analysis, and the study was not designed to compare differences between ETLE and TLE.
Knowlton et al. (71) concluded that MEG could potentially replace the invasive ICEEG. However, there were 2 letters to editor (103; 104) regarding this study which stated that the results by Knowlton et al. are promising, but must be considered with caution for the following reasons:
Knowlton et al. (71) did not clearly differentiate neocortical from temporolimbic epilepsy (although the inclusion criteria would have limited the number of patients with bilateral temporolimbic epilepsy).
For patients with temporolimbic epilepsy, the need to identify the intracranial epileptic (ictal) onsets is more important than the identification of interictal spikes captured by MEG, thus MEG does not aid in the surgical planning of patients with temporolimbic epilepsy.
Potential for bias in favour of MEG, in cases where resection success was primarily due to ICEEG but included MEG dipoles in the planned resection area.
In 7 of 49 (14%), cases were localized by ICEEG, but not MEG. Three (6%) cases were localized by MEG, but not by ICEEG.
The small retrospective study by Oishi et al. (78) compared MEG to ICEEG in 20 patients with medically refractory neocortical epilepsy. Based on postoperative outcomes using Engel’s classification, (105) they reported that MEG results were significantly correlated with surgical outcomes in patients in which MEG detected single clusters compared with patients in which MEG detected multiple clusters (P =.049). Patients with single clusters were more likely to be seizure-free after surgery than patients with multiple clusters detected on MEG. There was also a significant correlation between the results for MEG and ICEEG (P =.014). However, it is important to note that patients with multiple foci are less likely to benefit from surgical resection compared with patients with localized foci.
In the prospective study by Gallen et al., (102) 33 patients underwent presurgical evaluation for the resection of seizure foci. After the presurgical evaluation, 4 patients were considered inappropriate surgical candidates. Of the remaining 29, 21 (72%) were seizure-free at a mean follow-up of 42.4 months (standard deviation [SD], 8.9 months; range 25–57 months). Twenty-one patients required ICEEG monitoring prior to surgery. They reported on sensitivity and specificity for MEG, ICEEG, noninvasive EEG (video monitoring), neuropsychological testing, and MRI. They reported higher sensitivity and specificity for ICEEG compared with all the other modalities, including MEG.
The retrospective study by Papanicolaou et al. (75) compared ICEEG to MEG in 41 patients with refractory epilepsy. Surgical focal resection was based on the results of the ICEEG, MRI, neuropsychological evaluation, SPECT, PET, and Wada testing. Magnetoencephalography and ICEEG results were compared with postoperative outcomes (using the Wieser classification (106)). Compared with postoperative outcomes, MEG was correct in 23 (56%) of 41 patients, and ICEEG was correct in 22 (54%) of 41 patients. Predictions were incorrect for 15 patients with MEG and 16 patients with ICEEG, and there were 3 indeterminate cases for each MEG and EEG.
All 5 of the studies reported concordance or agreement with the resected area for both MEG and ICEEG. In all of the studies, the decision as to where to resect was based on a multitude of tests, including MRI, noninvasive EEG, neuropsychological testing, and ICEEG. Some patients also underwent PET, SPECT, and/or Wada testing. Only in the study by Knowlton et al. could the MEG results impact the decision as to where to resect; however, MEG could only add to increase the selected area, it could not change the area to resect. Table 19 summarizes the agreement of MEG and ICEEG to the actual resected area.
Table 19: Agreement Between Resected Area and Magnetoencephalography and Intracranial Electroencephalogram*.
| Study | Agreement With Resected Area, % | Partial Agreement With Resected Area, % | No Agreement With Resected Area, % | |||
|---|---|---|---|---|---|---|
| MEG | Invasive EEG |
MEG | Invasive EEG |
MEG | Invasive EEG |
|
| Knowlton et al., 2006 (71) | 65 | 69 | 14 | 20 | 21 | 11 |
| Papanicolaou et al., 2005 (75) | 71 | 68 | 19 | 24 | 10 | 8 |
| Mamelak et al., 2002 (100) | 57 | 74 | 43 | 26 | — | — |
| Wheless et al., 1999 (101) | 52 | 44 | 23 | 23 | 25 | 32 |
| Gallen et al., 1997 (102) | 49 | 71 | 15 | 24 | 36 | 5 |
| Range | 49-71 | 44-74 | 14-43 | 20-26 | 10-36 | 5-32 |
EEG indicates electroencephalogram; MEG, magnetoencephalography.
Based on the results of these studies, the agreement between MEG and the resected area ranged from 49% to 71%, and the agreement between ICEEG and the actual resected area ranged from 44% to 74%. It is important to note that 4 of the 5 studies reported that the rate of agreement between ICEEG and the resected area was between 68% and 74%. The study by Wheless et al. (101) reported an agreement of only 44% for ICEEG. It is unclear why agreement was lower in this study compared with the others. If this study were removed, the range for MEG would remain the same (49%–71%) and the range for ICEEG would be improved (68%–74%).
In addition to the studies identified that described the accuracy of MEG in identifying the epileptic foci compared with ICEEG or noninvasive EEG, the retrospective study by Stefan et al. (83) investigated the clinical use of MEG results. They reported on 455 patients who underwent MEG for refractory epilepsy. As part of this review, 2 expert clinicians reviewed the 104 patients’ charts and rated the contribution of the MEG results compared with other modalities used to localize the epileptic foci (video EEG, MRI, SPECT, MRI, etc.). The results were as follows:
Disagreement between MEG and other modalities: 2 (2%) patients
MEG results made no contribution: 10(10%) patients
MEG results in agreement with other modalities: 56 (54%) patients
MEG provided additional information: 25 (24%) patients
MEG had influence on surgical procedures: 11(11%) patients
Based on the results of MEG compared with ICEEG and noninvasive EEG, it is difficult to draw conclusions regarding the effectiveness of MEG due to limitations in the evidence. The studies identified are mostly small case-series with heterogeneous samples. The patients in the studies have variable types of epilepsy, ages, duration of seizures, location of seizures, and variable presurgical evaluations. Moreover, the study designs and outcomes reported vary across studies.
Functional Brain Imaging Versus Noninvasive Electroencephalogram
There were 8 studies identified that investigated the localization of seizure foci with MEG or PET instead of or in addition to noninvasive (scalp) EEG. The characteristics of the studies are described in Table 20. Four of the studies compared MEG to EEG, and 4 compared PET to EEG. The 4 studies investigating the role of PET in the localization of seizure foci were conducted by the same core group of authors; thus, there may be overlap in the patients included in these studies. Patients were heterogeneous across the studies on several variables including age and seizure origin.
Table 20: Characteristics of Studies Investigating the Localization of Seizure Foci With Functional Brain Imaging Instead of Noninvasive (Scalp) Electroencephalogram*.
| Study | Imaging Type |
N | Description of Patients |
Blind | Male, % | Mean Age, Years |
|---|---|---|---|---|---|---|
| Yunet al., 2006 (62)† Retrospective | PET | 193 | Neocortical, intractable epilepsy (61 FLE, 80 nTLE, 21 PLE, 22 OLE, 9 multifocal) |
Yes | 66 seizure-free 65 persistent seizure |
Seizure-free: 26.4 (SD, 7.5) Persistent seizure 27.0 (SD, 8.4) |
| Iwasaki et al., 2005 (73) Retrospective | MEG | 43 | Intractable focal epilepsy (36 TLE, 3 FLE, 2 FTLE, 2 PLE) |
Yes | 58 | 26.0 (range, 5–47) |
| Lee et al., 2005 (63)† Retrospective | PET | 89 | Neocortical, intractable epilepsy with normal MRI results (35 FLE, 31 nTLE, 11 PLE, 11 OLE, 1 multifocal) |
Yes | 62 | 25.6 (SD, 7.9; range, 8–56 |
| Lee et al., 2005 (64)† Retrospective | PET | 26 | Neocortical, intractable epilepsy with normal MRI results (26 OLE) |
Yes | 62 | 25.9 (SD, 7.6; range, 14–44) |
| Ochi et al., 2005 (72) Retrospective | MEG | 41 | Intractable localization-related epilepsy | No | 37 | 8.9 (range, 5 months –16 years) |
| Assaf et al., 2004 (74) Prospective | MEG | 26 | Intractable TLE | Yes | NR | NR |
| Kim et al., 2004 (65)† Retrospective | PET | 40 | Neocortical, intractable epilepsy(40 PLE) | Yes | 53 | 27.0 (SD, 6.9 ; range, 12–40) |
| Pataraia et al., 2004 (77) Prospective | MEG | 113 (results for 82 patients) | Drug-resistant epilepsy (54 TLE, 28 ETLE) | No | 50 | 25.3 (range, 1.2–54) |
ETLE refers to extratemporal lobe epilepsy; FLE, frontal lobe epilepsy; FTLE, frontotemporal lobe epilepsy; MEG, magnetoencephalography; MRI, magnetic resonance imaging; MTLE, mesial temporal lobe epilepsy; NR, not reported; nTLE, neocortical temporal lobe epilepsy; OLE, occipital lobe epilepsy; PET, positron emission tomography; PLE, parietal lobe epilepsy; SD, standard deviation; TLE, temporal lobe epilepsy.
Due to the heterogeneity of the studies in the sample population, study design, and methods for reporting outcomes, the results of the studies could not be pooled. The results of the studies are described below.
The retrospective study by Iwasaki et al. (73) compared the results of simultaneous noninvasive EEG and MEG recordings in 43 patients with intractable focal epilepsy. Patients underwent focal resection based on an independent diagnosis not related to the study. Three expert reviewers were blinded to the clinical information of patients.
In 31 patients, spikes were detected in both MEG and EEG; in 8 patients, spikes were only detected with MEG, and in 1 patient spikes were detected by EEG alone. There were 3 patients who did not have any spikes detected with either modality. The authors did not report if one modality was better at identifying spikes in certain locations. Iwasaki et al. reported that there was not a significant difference in the total number of spikes detected by MEG compared with EEG (P= .81). Thirty-five of 43 patients were reported to be seizure-free postoperatively. Of these patients, MEG detected interictal spikes in 32 (91%) compared with 27 (77%) patients with EEG alone. In the 32 patients with MEG spikes detected, 25 (78.1%) were localized to the resection site. In the 27 patients with EEG spikes detected, 23 (85.2%) were localized to the resection site.
The retrospective study by Ochi et al. (72) compared the concordance between lateralization of MEG and noninvasive EEG with video monitoring in 41 children. They found there was concordance between MEG and EEG in 34 patients (83%). None of the patients with nonconcordant results underwent surgery.
In the prospective study by Assaf et al., (74) video scalp EEG recordings were compared with MEG results in 26 patients with intractable TLE. Twenty-two patients underwent surgery. The surgeons were blinded to the MEG results. Surgical decisions were based on scalp EEG recordings, in addition to other presurgical analyses (MRI, neuropsychological testing), in 15 patients. The other 7 patients who had surgery also had ICEEG in addition to the video scalp EEG and other presurgical tests. The authors reported statistically significant correlation between MEG and surgical resections (P< .001). Twenty-one of the 22 patients who underwent surgery were seizure-free postoperatively (duration of follow-up was not reported).
The prospective study by Pataraia et al. (77) compared MEG to noninvasive video EEG. They included 113 patients with refractory epilepsy in their study, but they only reported results for 82 patients. Sixteen patients were excluded due to large magnetic artifacts in their MEG results, and another 15 patients were excluded because their results were damaged in a flood. The decision to undergo surgery was based on video EEG, MRI, neuropsychological evaluation, SPECT, PET and Wada testing. The MEG results were not considered in the surgical decision. Both the MEG and the video EEG results were compared with the actual resected region. There was agreement between MEG and EEG in 32.3% of cases. Seventeen patients (20.7%) had no spikes on MEG, and were excluded from the analysis. There was perfect overlap for MEG in 47 of 65 patients compared to the actual resected area and 26 of 65 patients with EEG. There were 5 patients where they had partial overlap or no overlap in MEG, but perfect overlap in EEG. Alternatively, there were 26 patients with partial overlap or were nonlocalizable in EEG, but had perfect overlap in MEG.
Pataraia et al. reported 1-year postoperative outcomes for the patients in their study based on the Wieser classification. (106) A Wieser classification of 1 or 2 (no seizures or only aura) was considered to be success. A Wieser classification between 3 and 4 indicates that the patient has had a worthwhile improvement from seizures, and a classification of 5 indicates that there has been no or minimal improvement in the frequency of seizures. Based on data provided in the Pataraia et al. study, the Medical Advisory Secretariat created Figures 1 and 2 to illustrate the postsurgical outcome based on MEG and video EEG results. Of the 43 patients that were seizure-free 1 year after surgery, MEG localized the resected area in 25 patients (58%), compared with 42% for EEG. However, for the 19 patients who experienced no or minimal improvement in seizures after 1 year, MEG agreed with the resected area in 63% of cases, compared with 32% for EEG. Based on these results, it would appear that MEG has a higher sensitivity than video EEG, but a lower specificity. Pataraia et al. concluded that MEG may have a role in cases where video EEG is partially or nonlocalizing.
Figure 1: Magnetoencephalography Results Compared With 1-Year Postoperative Outcome (Based on Wieser Classification).
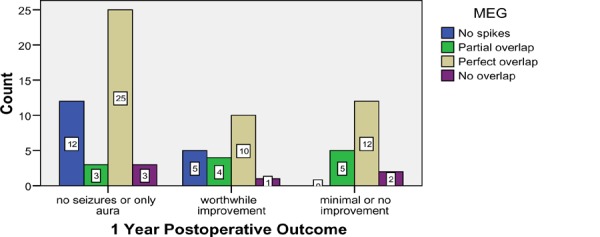
Figure 2: Noninvasive Video-Electroencephalogram Results Compared With 1-Year Postoperative Outcome (Based on Wieser Classification).
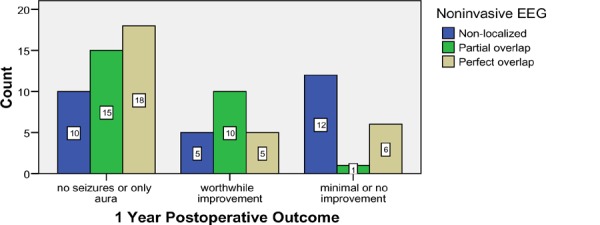
Since the publication of the NHS health technology assessment on PET in patients with epilepsy, 4 studies were identified that investigated the accuracy of PET in patients with epilepsy. (62-65) These 4 studies were conducted by the same core group of authors, thus there is likely overlap in the patients in the studies.
Table 21 outlines the percentage of accurate localizations of seizure foci by imaging modality. Accuracy was based the imaging modality localizing the resected area and on patients being seizure-free 1 year postoperatively. Across the 4 studies, there was variability in the sample size and type of epilepsy that was included. Single photon emission computed tomography appeared to be the least accurate, however, when observing the ranges covered by each of the modalities in the 4 studies, there was overlap across all modalities in terms of accuracy rates. Thus, it is not possible to conclude that 1 modality is better than another at localizing seizure foci based on these 4 studies.
Table 21: Percentage of Accurate Localizations by Modality (Based on 1-year Postoperative Outcomes)*.
| Studies | % Localized by Imaging Modality & Seizure-Free ≥ 1 yr Postoperatively | |||
|---|---|---|---|---|
| PET | Noninvasive EEG | Noninvasive EEG During Seizure |
SPECT | |
| Yun et al., 2006 (62)† |
37 (n = 179) |
24 (n = 179) |
44 (n = 179) |
24 (n = 136) |
| Lee et al., 2005 (63)† |
29 (n = 79) |
22 (n = 89) |
37 (n = 89) |
18 (n = 56) |
| Lee et al., 2005 (64)† |
32 (n = 25) |
38 (n = 26) |
50 (n = 26) |
16 (n = 19) |
| Kim et al., 2004 (65)† |
27 (n = 26) |
NR | 19 (n = 26) |
24 (n=21) |
| Range | 27-37 | 22-38 | 19-50 | 16-24 |
The study by Ollenberger et al. (82) assessed the role of FDG-PET in the diagnosis and management of children with refractory epilepsy through surveying epileptologists about the management of their patients’ epilepsy. The purpose of the survey was to assess if the FDG-PET results changed patient management. Three epileptologists responded to the survey in reference to 108 patients. The mean age of patients was 7.3 years (SD, 3.4 years; range, 0.5–12.5 years). For surgical candidates, PET resulted in surgery being excluded (major change) in 39% of patients, and resulted in a modification of surgery (minor change) in 19% of patients. Positron emission tomography did not influence surgery in 39% of patients. Most patients had undergone both MRI and EEG (97% and 92%, respectively) prior to the PET scan, which was initially used to determine surgical management of the patients. About 39% of patients had undergone ictal SPECT, and 19% underwent interictal SPECT prior to the PET scan.
What is the Role of Functional Brain Imaging in Presurgical Functional Mapping?
As described in the alternative technologies section of this report, the current gold standard for presurgical functional mapping is the Wada test. Briefly, the Wada test is a procedure that involves inserting a catheter through the femoral artery to the carotid artery to numb each side of the brain individually to assess function. A potential role of functional brain imaging is to replace the somewhat invasive Wada test with a noninvasive test.
There were 6 studies identified that investigated functional brain imaging in presurgical functional mapping: 5 studies using fMRI and 1 using MEG. (66-70;76) The characteristics of these studies are described in Table 22.
Table 22: Characteristics of Studies Investigating the Localization of Seizure Foci With Functional Brain Imaging*.
| Study | Type of Study | N | Description of Patients | Seizure Origin | Blind | Reference Standard | Male, % | Mean Age, Years |
|---|---|---|---|---|---|---|---|---|
| Functional Magnetic Resonance Imaging | ||||||||
| Benke et al., 2006 (66) | PCS(consecutive enrollment) | 68 | Patients with intractable partial epilepsy being considered for surgery | Right TLE—28 Left TLE—40 |
Yes | Wada test | NR | 36.4 right TLE; 38.9 left TLE |
| Medina et al., 2005 (67) | PCS(consecutive enrollment) | 60 | Patients with seizure disorder being considered for surgery | Mixed | Yes | Clinical information, MRI | 55 | 15.8 (SD, 8.7; range 7–44) |
| Sabsevitz et al., 2003 (68) | PCS(consecutive enrollment) | 24 | Patients with left anterior temporal lobectomy | TLE | No | Wada test | 33 | 38.6 (SD, 8.1) |
| Woermann et al., 2003 (69) | PCS | 100 | Localization-related epilepsy | Mixed | Yes | Wada test | 47 | 32.5 typical lateralization; 29.9 atypical lateralization |
| Binder et al., 1996 (70) | PCS(consecutive enrollment) | 22 | Patients with seizure disorder being considered for surgery | Mixed | No | Wada test | 36 | (range, 17– 64) |
| Magnetoencephalography | ||||||||
| Papanicolaou et al., 2004 (76) | PCS | 100 | Surgical candidates with epilepsy | MTLE—80 FLE—15 Other—5 |
Yes | Wada test | 47 | 27.3 (SD, 12.1 ; range 8–56) |
FLE refers to frontal lobe epilepsy; MRI, magnetic resonance imaging; MTLE, mesial temporal lobe epilepsy; NR, not reported; PCS, prospective cohort study; SD, standard deviation; TLE, temporal lobe epilepsy.
The prospective study by Medina et al. (67) evaluated the effect of fMRI on the diagnosis and treatment planning of 60 patients with seizure disorders who were candidates for surgery. A combination of language, motor, and visual mapping were performed in each of the patients: 53 patients had language mapping, 33 had motor mapping, and 7 had visual mapping.
Four clinical experts reviewed the patients’ charts without the fMRI results and completed a questionnaire regarding the diagnosis and treatment plan for the patients; then, the 4 experts completed a similar questionnaire for each of the patients with their fMRI results included with the patient charts. The fMRI results altered the counseling for the patients and their families in 35 (58%) patients, helped to avoid Wada procedure (invasive procedure) in 38 (68%) patients, altered intraoperative mapping in 31 (52%) patients, and altered surgical planning in 25 (42%) patients, including altering the extent of resection in 4 (7%) patients.
The prospective study by Benke et al. (66) compared fMRI to the Wada test in 68 patients with epilepsy who were candidates for surgery. Using the Wada test as the reference standard, they reported the following sensitivity and specificity:
89% sensitivity and 50% specificity for frontal fMRI; and
78% sensitivity and 71 % specificity for temporoparietal fMRI.
The study by Sabsevitz et al. (68) compared preoperative fMRI to the Wada test results in 24 patients with left anterior temporal lobectomy. The sensitivity and specificity reported for fMRI were 100% and 73%, respectively.
The health technology assessment by Blue Cross Blue Shield from 2003 (43) investigated the role of MEG in presurgical functional mapping. Since then, 1 additional study was identified that met the inclusion criteria for this review that compared MEG to the invasive Wada procedure.
The study by Papanicolaou et al. (76) used MEG to identify the sensorimotor cortex in 100 patients with epilepsy being considered for surgery. The Wada procedure provides information on which hemisphere has primary control of language, but it does not identify the specific location within a hemisphere. When Papnaicolaou et al. compared MEG to the Wada procedure, they found that there was agreement between them in 79 (93%) of 85 cases. They did not explain why they did not have results for the remaining 15 patients in the study. Using the Wada procedure as the gold standard, the sensitivity and specificity of MEG was 98% and 83%, respectively.
The results for presurgical functional mapping were weak in the Blue Cross Blue Shield health technology assessment. (43) There were 11 studies identified investigating MEG in presurgical functional mapping. Nine of these compared MEG to invasive functional mapping. Of these, 2 included more than 20 patients. Magnetoencephalography was compared with other invasive functional mapping measures (various technologies and tasks), making a comparison among the studies impossible. However, in 7 of the 9 studies, there was 100% agreement between MEG and invasive functional mapping. There was more agreement between MEG and invasive functional mapping than there was between MEG and ICEEG.
The results of the studies identified were added to the results of the Blue Cross Blue Shield health technology assessment in Table 23. These results are consistent with the results of the previous studies comparing MEG with invasive functional mapping.
Table 23: Studies of Presurgical Functional Mapping*.
| Study | Type of Study |
Imaging Modality |
N | Blinded | Outcome: Agreement Between MEG or fMRI and Invasive Functional Mapping Results, % |
|---|---|---|---|---|---|
| Benke et al., 2006 (66)† | Prospective | fMRI | 68 | Yes | 75 right temporal lobe epilepsy 63 left temporal lobe epilepsy |
| Papanicolaou et al., 2004 (76)† | Prospective | MEG | 100 | Yes | 93 (79/85) – no results reported for 15 patients |
| Sabsevitz et al., 2003 (68)† | Prospective | fMRI | 24 | No | 81 (19/24) |
| Woermann et al., | Prospective | fMRI | 100 | Yes | Discordant: 9 |
| Breier et al., 2001 (107) | Prospective | MEG | 19 | Yes | 89(17/19) |
| Makela et al., 2001 (108) | Prospective | MEG | 12 | No | 100(12/12) |
| Roberts et al., 2000 (109) | Retrospective | MEG | 17 | No | 76 (13/17) good agreement 12 (2/17) moderate agreement |
| Breier et al., 1999 (110) | Prospective | MEG | 26 | Yes | 100% (26/26) |
| Ganslandt et al., 1999 (111) | Prospective | MEG | 50 | No | 100(50/50) |
| Minassian et al., 1999 (112) | Prospective | MEG | 11 | No | 100(11/11) |
| Simos et al., 1999 | Prospective | MEG | 13 | No | 100(13/13) |
| Binder et al., 1996 (70)† | Prospective | fMRI | 22 | No | Highly correlated (r=0.96, P< .0001) |
| Ganslandt et al., 1996 (114) | Prospective | MEG | 12 | No | 100(10/10) |
| Roberts et al., 1995 (115) | Prospective | MEG | 10 | Yes | 100(10/10) |
fMRI indicates functional magnetic resonance imaging; MEG, magnetoencephalography.
Studies published since the Blue Cross Blue Shield health technology assessment.
Thus, presurgical functional mapping with MEG seems to agree consistently with invasive functional mapping measurements. Functional MRI appears to have high agreement with invasive functional mapping as well. There were no studies identified that compared fMRI to MEG for presurgical functional mapping.
Results: Multiple Sclerosis
What is the Role of Functional Brain Imaging in the Diagnosis of Multiple Sclerosis?
There has been a tremendous quantity of literature published on imaging of MS in order to further understand the pathogenesis of the disease; however, there were no studies identified that were eligible for inclusion on the clinical utility of functional brain imaging in the diagnosis of MS.
Results: Parkinson’s Disease
This review addressed 2 questions regarding the role of functional brain imaging for patients with PD. The first involves using functional brain imaging in the initial diagnosis of PD; the second question investigates the role of functional brain imaging in the diagnosis of parkinsonian syndromes.
What is the Role of Functional Brain Imaging in the Diagnosis of Parkinson’s Disease?
The study by Eckert et al. (79) investigated the role of FDG-PET in the diagnosis of PD and in the diagnosis of parkinsonian syndromes. They included 43 patients with early PD and compared them using FDG-PET with 22 normal controls. Compared with clinical diagnosis, the sensitivity and specificity to diagnose PD was 100% and 91%, respectively (Table 24). This study did not report how the use of PET in the diagnosis of PD changes patient treatment or clinical outcomes.
Table 24: Characteristics of Functional Brain Imaging Studies for the Diagnosis of Parkinson’s Disease*.
| Study | Type of Study | Imaging Modality | N | Readers/ Blinding | Reference Standard | Male, % | Mean (SD) Age, Years | Follow-Up, Years | Sensitivity, % | Specificity, % |
|---|---|---|---|---|---|---|---|---|---|---|
| Eckert et al., 2005 (79) | Cohort-control | FDG-PET | 43 early PD 22 control | 1 reader blinded to clinical diagnosis | Clinical diagnosis | 51 | 60.6 (10.4) | Mean, 2.1 | 100 | 91 |
FDG indicates 18F-labelled-fluorodeoxyglucose; PD, Parkinson’s disease; PET, positron emission tomography; SD, standard deviation.
What is the Role of Functional Brain Imaging in the Diagnosis of Parkinsonian Syndromes?
Studies investigating the diagnosis of parkinsonism used PET imaging with glucose metabolism or receptor binding. (116) For glucose metabolism FDG PET is used. Patients with PD show increased metabolism in the lentiform nucleus, thalamus, pons, and cerebellum, and there is decreased metabolism in the lateral frontal, paracentral and parietal areas. (116) Patients with MSA show decreased metabolism in the lentiform nucleus and cerebellum. (116) In patients with progressive supranuclear palsy, glucose metabolism is decreased in the frontal cortex. (116)
FDOPA PET allows for assessment of the functionality of the presynaptic nigrostriatal dopaminergic projections. FDOPA is a surrogate measure of endogenous dopamine synthesis. FDOPA uptake is reduced in parkinsonian patients and can differentiate PD from healthy subjects (even in early disease states). (116)
There were 3 studies identified that used PET in the assessment of parkinsonian syndromes that met the inclusion criteria for this review. (79-81) Table 25 describes the characteristics of these 3 studies.
Table 25: Characteristics of Functional Brain Imaging Studies in the Diagnosis of Parkinsonian Syndromes*.
| Study | Type of Study | Imaging Modality | N | Blind | Reference Standard | Male, % | Mean (SD) Age, Years | Drop-Outs/ Losses | Follow -Up, Years |
|---|---|---|---|---|---|---|---|---|---|
| Eshuis et al., 2006 (80) | Prospective cohort | F-DOPA-PET FP-CIT SPECT | 13 de novo PD 17 advanced PD |
No | H&Y stage, UPDRS-III | 83 | De novo: 54 (11) Advanced: 64 (6) | None reported | NR |
| Eckert et al., 2005 (79) | Prospective cohort | FDG-PET | 135 with parkinsonism | Yes | Clinical diagnosis | 51 | 60.6(10.4) | 53: lack of follow-up data; 17 structural abnormalities on MRI | Mean, 2.1 |
| Schreckenber ger et al.., 2004 (81) | Cohort-control | 18F-DMFP PET (patients off dopamine 48 hrs prior to PET) | 35 with parkinsonism 16 male healthy volunteers |
Yes | Clinical diagnosis | 49 | 64.9 (9.1; (range, 43–77; median, 65) | None reported | NR |
DMFP indicates, dorsal medial prefrontal cortex; FDG, 18F-laabelled-fluorodeoxyglucose; FDOPA, fluorodopa ; FP CIT, fluoropropyl ß-carbomethoxy-3 ß-4-iodophenyltropane; H&Y refers to Hoehn & Yahr stage; MRI, magnetic resonance imaging; NR, not reported; PD, Parkinson’s disease; PET, positron emission tomography, SD, standard deviation; SPECT, single photon emission computed tomography; UPDRS-III, Unified Parkinson’s Disease Rating Scale, motor function.
Values referring to the accuracy of PET in the 3 studies are listed in Table 26. The sensitivity and specificity for PET is quite high for all 3 studies, even though all 3 studies used different radiotracers. The study by Eckert et al. (79) reported the use of FDG-PET in the diagnosis of patients with PD and in the diagnosis of parkinsonian syndromes. It is not clear if the addition of PET in the clinical diagnosis of PD or parkinsonian syndromes changed the treatment outcomes in patients with these conditions.
Table 26: Accuracy of Functional Brain Imaging in the Evaluation and Diagnosis of Parkinsonian Syndromes*.
| Study | Imaging Modality |
N | Reference Standard |
Sensitivity, % | Specificity, % |
|---|---|---|---|---|---|
| Eshuis et al., 2006 (80) | F-DOPA PET | 30 | H&Y stage, UPDRS-III | 88 | 77 |
| FP-CIT SPECT | 88 | 70 | |||
| Eckert et al., 2005 (79) | FDG-PET | 135 | Clinical diagnosis | 92 | 95 |
| Schreckenberger et al.., 2004 (81) | 18F-DMFP PET | 35 | Clinical diagnosis | 74 | 100 |
FDG indicates 18F-laabelled-fluorodeoxyglucose; FDOPA, fluorodopa; FP CIT, Fluoropropyl ß-carbomethoxy-3 ß-4-iodophenyltropane H&Y refers to Hoehn & Yahr stage; PET, positron emission tomography, SPECT, single photon emission computed tomography; UPDRS-III, Unified Parkinson’s Disease Rating Scale, motor function.
There were no studies investigating the role of MRS that met the inclusion criteria because they did not compare MRS to a reference standard nor did they compare clinical outcomes in patients diagnosed with different modalities. For instance, in the prospective study by Watanabe et al., (117) they measured NAA/Cr) ratios with MRS to diagnose MSA. They found that patients with MSA had significantly lower NAA/Cr ratios than the normal controls or patients with PD (P ≤ .001). They reported that using MRS they were able to differentiate MSA from PD sooner than with MRI, however, they did not report treatment outcomes in patients who have MSA distinguished from PD sooner compared with those with a delayed diagnosis.
Summary of Findings of Literature Review
Alzheimer’s Disease
There is evidence to indicate that PET can accurately diagnose AD. However, at this time there is no evidence to suggest that a diagnosis of AD with PET alters the clinical outcomes of patients.
Brain Tumour
The addition of MRS or FET PET to the current standard of Gd-enhanced MRI for distinguishing malignant from benign tumours in the primary diagnosis of brain tumours provides a higher specificity than Gd-enhanced MRI alone. The clinical utility of more imaging in patients with primary tumours to distinguish malignant from benign tumours is unclear, because patients with a suspected brain tumour will likely undergo a biopsy despite additional imaging results.
The addition of MRS, FET-PET, or MRI T2 to the current standard of Gd-enhanced MRI for the differentiation of recurrence from radiation necrosis provides a higher specificity than Gd-enhanced MRI alone. The clinical utility of more imaging in patients with a suspected recurrence may have clinical utility in the monitoring of patients. Based on the evidence available, it is unclear if 1 of the imaging modalities (MRS, FET-PET, or MRI T2) offers significantly improved specificity over another.
There may be a role for fMRI in the identification of surgical candidates for tumour resection; however, this requires further research.
Epilepsy
Based on the studies available, it is unclear whether MEG has similar accuracy to ICEEG in localizing seizure foci. In the 3 studies reporting sensitivity and specificity for MEG, the range was 75% to 80% for sensitivity and 44% to 70% for specificity. In the 2 studies that compared ICEEG and MEG, the sensitivity and specificity for ICEEG ranged from 72% to 86%, and 38% to 71%, respectively. More high-quality research is needed to establish if there is a difference in accuracy between MEG and ICEEG.
The results of the studies comparing PET to noninvasive EEG did not demonstrate that PET was more accurate than noninvasive EEG at localizing seizure foci.
In the study comparing MEG to invasive functional mapping, the agreement was 93%, compared with the study comparing fMRI and invasive functional mapping, in which agreement was 63% to 75%. There may be some utility of fMRI in functional mapping; however, this needs further investigation involving comparisons to other modalities. The clinical utility of MRS has yet to be established for patients with epilepsy.
Parkinson’s Disease
Positron emission tomography has high sensitivity and specificity in the diagnosis of PD and the diagnosis of other parkinsonian syndromes; however, it is unclear at this time if the addition of PET in the diagnosis of these conditions contributes to the treatment and clinical outcomes of patients.
Multiple Sclerosis
There is limited clinical utility of functional brain imaging in the management of patients with MS at this time. Diagnosis of MS is established through clinical history, evoked potentials, and MRI. Magnetic resonance imaging can identify the multifocal white lesions and other structural characteristics of MS (personal communication, clinical expert, November 6, 2006).
There is too little evidence available at this time to draw conclusions about the role of functional brain imaging in the diagnosis or differential diagnosis of MS.
Table 27 summarizes the results of the Medical Advisory Secretariat review across all diseases.
Table 27: Summary of Clinical Utility of Functional Brain Imaging Modalities for the Conditions Reviewed*.
| Modality | Alzheimer’s Disease | Brain Tumour | Epilepsy | Multiple Sclerosis | Parkinson’s Disease |
|---|---|---|---|---|---|
| fMRI | No clinical utility at this time | Unclear—more research may define a role in the identification of candidates for tumour resection. | Unclear—needs to be compared with MEG for ability to identify sensorimotor cortex. | No clinical utility at this time. | No clinical utility at this time. |
| HTAs | — | — | * NHS, 2006 | — | — |
| MEG | No clinical utility at this time | No clinical utility at this time—but more research could define a role in the identification of candidates for tumour resection. | Maybe—potential use as a noninvasive pre-surgical evaluation in some patients with refractory epilepsy for functional mapping and localization of seizure foci. | No clinical utility at this time. | No clinical utility at this time. |
| HTAs | — | — | × Blue Cross, 2003 | — | — |
| MRS | No clinical utility at this time. | Maybe—if the increase in sensitivity and specificity with MRS can demonstrate an improvement in clinical outcomes | No clinical utility at this time. | No clinical utility at this time. | No clinical utility at this time. |
| HTAs | × Hollingworth, 2006 × AHRQ, 2003 × Blue Cross, 2003 |
× NHS, 2006 | × Clarke, 2001 | ||
| PET | No clinical utility at this time—but potential for future use as treatments improve. | Maybe—if the increase in sensitivity and specificity with PET can demonstrate an improvement in clinical outcomes. | Maybe—for patients with refractory epilepsy and inconsistent MRI and EEG results. Future research needs to address the impact of PET on patient outcomes. | No clinical utility at this time. | No clinical utility at this time—but potential for future use new radiotracers are identified. |
| HTAs | × AHRQ, 2004 × Patwardhan, × 2004 × Gill, 2003 × ECRI, 2002 × AETMIS, 2001 VATAP, 1998 |
× AHRQ, 2004 ✓ AETMIS, 2001, (residual tumour) × ECRI, 2002 × MSAC, 2000 |
× NHS, 2006 ✓ MSAC, 2004 ✓ AETMIS, 2001 ? MSAC, 2000 |
× Tolosa, 2006 × AHRQ, 2003 |
AETMIS indicates Agence d’Évaluation des Technologies et des Modes d’Intervention en Santé; AHRQ, Agency for Health Research and Quality; ECRI, ECRI Institute; fMRI, functional magnetic resonance imaging; HTA, health technology assessment; MEG, magnetoencephalography; MRS, magnetic resonance spectroscopy; MSAC, Medical Services Advisory Committee; NHS, National Health Service ;PET, positron emission tomography; VATAP, Veteran Affairs Technology Assessment Program.
Grading of Recommendations Assessment, Development, and Evaluation Evidence Profile
Table 28 lists the Grading of Recommendations Assessment, Development and Evaluation (GRADE) evidence profile by condition and question. (118) All of the studies identified for this review were observational, which reduced all studies to a “moderate” GRADE level at the start. The studies were generally of poor quality with a variety of limitations, including small sample sizes, heterogeneous study populations, and low quality of reporting of outcomes. Several of the studies were measuring the accuracy of the functional brain imaging technologies rather than measuring the clinical utility of the technology. Overall, the quality of the evidence of most of the studies was graded as very low or low. Exceptions were the studies comparing PET to noninvasive EEG, which consistently demonstrated that PET was not superior to noninvasive EEG in terms of 1-year postoperative outcomes.
Table 28: Grading of Recommendations Assessment, Development and Evaluation Evidence Profile*.
| Condition | What is the Role of Functional Brain Imaging in: |
No. Observational Studies |
Consistency | Directness | GRADE |
|---|---|---|---|---|---|
| Alzheimer’s disease | The diagnosis of Alzheimer’s disease? | 4 | Consistency across studies | Measured accuracy, not clinical utility | Low |
| Brain tumour | The detection and grading of primary tumours? | 6 | Used various technologies, various radiotracers with PET | Measured accuracy, not clinical utility | Very low |
| The differentiation of recurrence from radiation necrosis? | 6 | Used various technologies, various radiotracers with PET | Measured accuracy, not clinical utility | Very low | |
| The selection of surgical candidates for tumour resection? | 2 | Inconsistent results on clinical utility of fMRI | Okay | Low | |
| Epilepsy | The localization of seizure foci in people with refractory epilepsy being considered for surgery--MEG vs. ICEEG | 5 | Inconsistent | Measured area resected, risk of confounders | Very low |
| The localization of seizure foci in people with refractory epilepsy being considered for surgery--MEG vs. noninvasive EEG | 4 | Consistent | Reported various outcomes | Low | |
| The localization of seizure foci in people with refractory epilepsy being considered for surgery--PET vs. noninvasive EEG | 4 | Consistent | Measured localization and seizure outcome | Moderate | |
| The presurgical functional mapping of people with refractory epilepsy being considered for surgery? | 5 | Consistent | Measured accuracy, not clinical utility | Low | |
| Multiple sclerosis | The diagnosis of multiple sclerosis? | 0 | N/A | N/A | N/A |
| Parkinson’s disease | The diagnosis of Parkinson’s disease? | 1 | Only 1 study | Measured accuracy, not clinical utility | Very low |
| The differential diagnosis of parkinsonian syndromes? | 3 | Studied various radiotracers | Measured accuracy, not clinical utility | Very low |
EEG indicates electroencephalogram; fMRI, functional magnetic resonance imaging; ICEEG, intracranial electroencephalogram; MEG, magnetoencephalography, N/A, not applicable; PET, positron emission tomography.
Economic Analysis
The Medical Advisory Secretariat did not do a cost-effectiveness analysis, because the effectiveness of functional brain imaging has not been established for the conditions investigated in this review.
Existing Guidelines for Use of Technology
Aetna, 2006: Magnetic Source Imaging/Magnetoencephalography
Aetna (119) reviewed MEG in 2006 and concluded that the technology was “experimental and investigational” because there is inadequate evidence in the medical literature indicating that it is effective in influencing the management and improving outcomes of patients.
Centers for Medicare and Medicaid Services, 2005
The Centers for Medicare and Medicaid Services (120) published a list of all conditions under which FDG-PET scans are covered. In this list are several indications for cancer staging and diagnosis; however, tumours of the CNS are not on the list. Positron emission tomography scans for brain tumours may be covered if the PET scan is performed as part of a clinical trial that meets the requirements of the Food and Drug Administration’s (FDA) category B investigational device exemption, or is a clinical trial designed to assist in patient management.
The Centers for Medicare and Medicaid Services provides coverage for FDG-PET in patients with refractory epilepsy undergoing presurgical evaluation. This publication from 2005 does not comment on the use of PET scanning in patients with AD, PD, or MS.
Policy Development
Because the clinical utility of functional brain imaging in patients with AD, PD, or MS has not been established at this time, most of the policy development section will focus on functional brain imaging for brain tumours and epilepsy, where there is potential clinical utility for functional brain imaging.
Diffusion
The rate of diffusion of fMRI and MRS is unclear because both these technologies are performed using the MRI platform and there are no specific diagnostic or Ontario Health Insurance Plan billing codes for fMRI or MRS. Most, if not all, MRI systems have fMRI and MRS capability with the appropriate software.
Magnetoencephalography
There are likely fewer than 75 MEG systems worldwide. In Ontario, there are 2 MEG systems: 1 for clinical and research use at the Hospital for Sick Children and another for research use only at Baycrest’s Rotman Research Institute. Toronto Western Hospital anticipates that it will acquire a MEG within the next year. Elsewhere in Canada, there is a MEG system in Vancouver and another in Montreal, with the latter to get another in 2007. In 2005, the Hospital for Sick Children performed 94 MEG tests in patients with epilepsy (personal communication, clinical expert, December 1, 2006).
Positron Emission Tomography
In 2006, Hastings and Adams (121) reported results of a joint project of INAHTA on the diffusion of PET. They surveyed members of INAHTA on the diffusion, assessment, and clinical use of PET. There was a 69% response rate among the health technology assessment agencies surveyed (27 INAHTA agencies from 19 countries responded). Two from Canada completed the survey: the Alberta Heritage Foundation for Medical Research and Canadian Agency for Drugs and Technologies in Health.
The results of the survey indicated that there are a mean of 16.4 PET scanners per country (median, 9.5 scanners; range, 2–80 scanners). Belgium has the most per million population (1.26), followed by Denmark (1.2), and Austria (1.1). Spain (0.33 per million population), the United Kingdom (0.28), and the Netherlands (0.25) had the fewest number of PET scanners per million population. According to the results of the survey, Canada has 0.39 PET scanners per million population. The study also reported that Ontario planned to install 3 additional PET or PET/CT hybrid scanners in the near future.
In a review of PET scanning by AETMIS (29) in 2001, the number of PET scanners internationally was identified. The review authors reported the number of dedicated PET scanners (other PET scanners have CT functionality—hybrid scanners) by country between 1999 and 2001.
Table 29 lists the findings of these 2 reports and compares, where possible, the change in the number of PET scanners per country.
Table 29: International Diffusion of Positron Emission Tomography Scanners Between 1999 and 2004*.
| Country | 1999-2001 (29) | 2003-2004 (121) | Change in Dedicated Scanners | Change in Scanners per Million Population | ||
|---|---|---|---|---|---|---|
| Number of Dedicated PET Scanners (Total No.) | Scanners per 1 Million Population | Number of Dedicated PET Scanners (Total No.) | Scanners per Million Population | |||
| Canada | 8 (8) | 0.20 | 10 (10) | 0.39 | +2 | +0.1 |
| United States | 75 (120) | 0.40 | NR | N/A | ||
| Japan | 37 (37) | 0.30 | NR | N/A | ||
| China | 12 (12) | 0.01 | NR | N/A | ||
| Germany | 35 (73) | 0.90 | 80 (80) | 1.00 | +45 | +0.1 |
| United Kingdom | 7 (11) | 0.20 | 16 (16) | 0.28 | +9 | +0.08 |
| Belgium | 5 (9) | 0.90 | 9 (13) | 1.26 | +4 | +0.36 |
| Russia | 2 (9) | 0.10 | NR | N/A | ||
| Italy | 8 (9) | 0.20 | NR | N/A | ||
| France | 4 (7) | 0.10 | 50 (50) | 0.83 | +46 | +0.73 |
| Austria Czech | 2 (2) | NR | 9 (9) | 1.13 | +7 | N/A |
| Republic | 1 (1) | NR | NR | N/A | ||
| Denmark | 2 (2) | NR | 3 (6) | 1.20 | +1 | N/A |
| Finland | 2 (2) | NR | 2 (2) | 0.38 | –– | N/A |
| Hungary | 1 (1) | NR | NR | N/A | ||
| Netherlands | 3 (3) | NR | 4 (4) | 0.25 | +1 | N/A |
| Spain | 3 (3) | NR | 13 (13) | 0.33 | +10 | N/A |
| Sweden | 2 (2) | NR | 5 (5) | 0.57 | +3 | N/A |
| Switzerland | 3 (3) | NR | NR | N/A | ||
| Australia | NR | 9 (13) | 0.65 | N/A | ||
| Israel | NR | 1 (3) | 0.46 | N/A | ||
| Total | 212 (314) | N/A | 211 (224) | N/A | N/A | |
N/A refers to not applicable; NR, not reported; PET, positron emission tomography..
There were no decreases in the number of PET scanners per country over the period investigated; the only country where there was no increase in the number of PET scanners was Finland. France and Germany had the most notable increase in the number of PET scanners (up by 46 in France and 45 in Germany).
Target Population
Based on the literature and administrative data from the Provincial Health Planning Database (PHPDB), the potential number prevalent epilepsy cases eligible for surgery is estimated to be 9,375 (Figure 3). However, the rate of patients choosing to undergo surgery worldwide is much lower than the number of patients who are eligible for surgery. For instance, it is estimated that 100,000 patients would be eligible for epilepsy surgery in the United States, but there are only about 2,000 epilepsy surgeries performed annually in the U.S. (2% of eligible patients). (122) Based on survey results, Engel & Shewmon (105) reported results that 1,500 surgeries for epilepsy were performed in the U.S. in 1990.
Figure 3. Prevalent Epilepsy Population in Ontario.
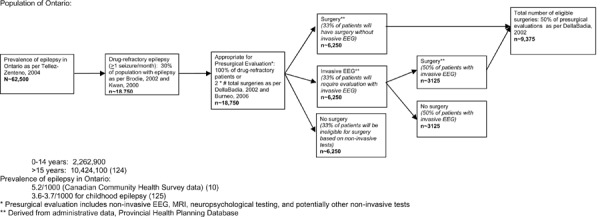
Rationale for difference between need and utilization of epilepsy surgery suggested in a review of epilepsy surgery by Siegel (122):
Lack of awareness by primary care physicians
Patient preference to tolerate seizures rather than undergo surgery
Lack of third-party funding for procedure (in U.S.)
If we assume that in Ontario there is the same proportion of actual surgeries/eligible patients as the U.S. (i.e. 2%), then we would expect there to be about 188 epilepsy surgeries in Ontario per year. This is consistent with administrative data from the PHPDB which identified ~150 epilepsy surgeries per year.
Patients in Ontario are waiting 6 months-2 years for a presurgical evaluation depending on the centre.
The mean hospital stay for the presurgical evaluation (including MRI, neuropsychological testing, non-invasive EEG, and potentially invasive EEG) is 16.5 days. The mean stay for the actual surgery is 7.2 days. The total mean stay is 23.7 days.
In 2005 the Institute for Clinical Evaluative Sciences published a report on Health Human Resources for Neurosurgical Services in Ontario. (123) In the report they outlined the demand for neurosurgical services, and offered recommendations on how to manage the demand. Among their recommendations, they recommended increasing the number of neurosurgeons in Ontario by 10 (from 65 to 75) and to offer alternative funding plans to neurosurgeons.
Based on administrative data, it appears that there are approximately 150 surgical resections performed in patients with epilepsy in Ontario per year. In Ontario there is up to a 2-year waiting list for adults with epilepsy to have the preliminary video EEG test to see if they are potential candidates for surgery. (Personal communication, clinical expert, December 8, 2006) It is unclear if the waiting list is as long for children. However, after preliminary testing with video EEG, children will wait an additional 6 to 8 months for ICEEG. Children who do not require ICEEG, have their surgeries performed sooner (usually within 2-3 months of video EEG monitoring). The reason for the long delay for ICEEG testing is due to the financial and human resources costs of the test. Patients are monitored in hospital for a week after the invasive procedure to place the electrodes, and then the electrodes need to be removed again.
Patient Outcomes
Patient outcomes varied slightly according to the imaging modality and the condition that they were being investigated for. For patients with suspected AD, patient outcomes included accurate diagnosis of AD with PET.
For patients with suspected brain tumour, the patient outcome for fMRI was disability after surgery (motor, language, sensory). The patient outcomes for MEG were extent of resection, survival, tumour recurrence, and disability after surgery (motor, language, sensory). For MRS and PET, the patient outcomes were extent of resection, survival, and tumour recurrence.
The patient outcomes for patients with epilepsy undergoing MEG were freedom from seizures and disability after surgery (motor, language, sensory). For fMRI the outcome was disability after surgery, and for PET the outcome was freedom from seizures.
The patient outcomes for PD were accurate diagnosis of PD or parkinsonian syndromes with PET or MRS.
Ethical and/or Legal Considerations
It is unknown whether MEG can replace ICEEG in some patients with refractory epilepsy undergoing presurgical evaluation. However, to conduct an RCT comparing MEG with ICEEG in patients with epilepsy may be viewed as unethical because ICEEG could be considered medically necessary. A possible solution to this would be to randomized patients to MEG with ICEEG, and ICEEG alone. However, this design is subject to bias because it would be difficult to be sure that the MEG results alone influenced surgery, rather than the combination of the 2 technologies.
Financial Impact
If MEG can replace ICEEG in some patients, then there would be an expected cost savings because patients will not require the 2 surgeries involved with ICEEG (1 to insert electrodes, another to remove the electrodes—often done at time of surgery for resection if indicated), nor will the patients require the additional hospital time to monitor the ICEEG.
Human Resources Impact
For MEG, a specially-trained MEG technician performs the studies and collects the data. In addition, an EEG technician performs the EEG studies in conjunction with the MEG. A specialized MEG physician (neuroradiologist, neurophysiologist) interprets the results of the MEG, which is very time-consuming. Patients will also undergo a MRI, requiring MRI human resources as well.
The following is a list of human resource requirements for producing radioisotopes used in PET scanning: (29)
cyclotron laboratory personnel, including a cyclotron operator, radiochemist, and radiopharmacist;
a nuclear medicine specialist who determines the amount of radioisotope to be shipped;
a radiation protection supervisor who oversees production and shipment of radiotracer;
a carrier licensed by Health Canada to transport radioisotopes; and
a nuclear medicine specialist to receive shipments of radioisotopes.
System Pressures
The MEG procedure lasts 3 to 5 hours, depending on the patient and the number of tests required. Currently, the Hospital for Sick Children uses the MEG system 3 days a week for clinical cases. It performs the MEG procedure on an estimated 3 patients per week (about 150 patients per year). Most of the patients are children; however, the system is used occasionally for adults who have been referred from other institutions. The Toronto Western Hospital refers an estimated 3 patients per month to the Hospital for Sick Children for MEG evaluation (personal communication, clinical expert, November 23, 2006).
Because the MEG procedure can last for several hours (patients take breaks throughout the procedure), and given that most of the patients studied at the Hospital for Sick Children are children, patients are usually sleep-deprived upon arrival, so that they can sleep through the MEG procedure without having to undergo sedation (which may interfere with the results of the MEG). Electroencephalogram is performed at the same time at the MEG. One technologist is required for the MEG system and another for the EEG.
Patients undergo MEG and MRI in the same day (usually after the MEG procedure). It takes several hours and substantial expertise to analyze and integrate the data captured with the MEG, MRI, and EEG. If the results of the tests indicate that the patient is eligible for surgery, then the images and data collected are used to guide the neurosurgery.
It takes 1 to 2 years from the initiation of the presurgical evaluation to surgery. Patients typically wait 6 to 8 months for the initial presurgical evaluation with noninvasive EEG with video monitoring. If necessary, the ICEEG is scheduled on average 6 months later, and then surgery is performed 6 to 8 months after ICEEG. If the patient does not require ICEEG, then the surgery may be completed sooner. Because the ICEEG can take 5 to 10 days, hospitals have dedicated beds for EEG; thus, they can only perform a specified number of tests per month.
Stakeholder Analysis
If MEG could replace ICEEG in some cases, then there would be an increased demand for MEG, requiring more technicians and MEG systems. The MEG results are very time-consuming to analyze, and analysis of the data requires training and practice.
Glossary
- Alzheimer’s Disease
A progressive, neurodegenerative disease characterized by loss of function and death of nerve cells in several areas of the brain leading to loss of cognitive function such as attention, memory, and language
- Brain tumour
Any intracranial tumor created by abnormal and uncontrolled cell division, normally either in the brain itself (neurons, glial cells, astrocytes, oligodendrocytes, ependymal cells), lymphatic tissue, (blood vessels), in the cranial nerves (myelin-producing Schwann cells), in the brain envelopes (meninges), skull, pituitary and pineal gland, or spread from cancers primarily located in other organs (metastatic tumors)
- Computed tomography
Radiography in which a three-dimensional image of a body structure is constructed by computer from a series of plane cross-sectional images made along an axis
- Electroencephalography
A diagnostic test of electrical activity in the brain
- Elequent cortex
The regions of the brain responsible for motor, sensory, and language function
- fMRI
An type of MRI that detects the changes in red blood cells and capillaries as they deliver oxygen to “functioning” parts of the brain
- Frontal lobe epilepsy
A type of epilepsy that originates in the frontal lobe of the brain, usually involving a cluster of short seizures with a sudden onset and termination
- Focus
The location in the brain from which epileptic charges originate
- Ictal
Events during a seizure
- Interictal
Period between seizures (typically > 24 hours)
- Lateral temporal lobe epilepsy
Arises in the neocortex on the outer surface of the temporal lobe of the brain
- Magnetic resonance spectroscopy
Used to measure the levels of different metabolites in body tissues. The MR signal produces spectrum of difference resonances that correspond to different molecular arrangements of the isotope being “excited”. This signature is used to diagnose certain metabolic disorders, especially those affecting the brain, as well as to provide information on tumor metabolism
- Magnetoencephalography
An imaging technique used to measure the magnetic fields produced by electrical activity in the brain via extremely sensitive devices such as superconducting quantum interference devices, for locating pathology and determining function
- Mesial temporal lobe epilepsy
Arises in the hippocampus, parahippocampal_gyrus and amygdala which are located in the inner aspect of the temporal lobe
- Multiple sclerosis
A progressive, inflammatory, demyelinating disease of the central nervous system
- Occipital lobe epilepsy
Seizures that originate in the occipital lobe of the brain, usually beginning with visual hallucinations, rapid eye blinking or other eye-related symptoms
- Parkinson’s Disease
A progressive nervous disease occurring most often after the age of 50, associated with the destruction of brain cells that produce dopamine and characterized by muscular tremor, slowing of movement, partial facial paralysis, peculiarity of gait and posture, and weakness
- PET
A computerized imaging technique that allows imaging of cerebral metabolic rates, receptor densities, and blood flow. Most commonly, radioactive labeled F-fluoro-2-deoxyglucose assesses cerebral glucose metabolism
- Postictal
Time immediately following a seizure
- SPECT
A scanner that measures a low-dose radioactive material as it circulates through the brain. SPECT can track cerebral blood flow and detect alternations in brain metabolism between and during seizures
- Temporal lobe epilepsy
Rrecurrent epileptic seizures arising from one or both temporal lobes of the brain. Two main types are mesial temporal lobe epilepsy (MTLE) and lateral temporal lobe epilepsy (LTLE)
Appendices
Appendix 1: Literature Search Strategies
Alzheimer’s Disease
Search date: September 2, 2006
Databases searched: OVID MEDLINE, MEDLINE In-Process & Other Non-Indexed Citations,
EMBASE, INAHTA, Cochrane Library
Database: Ovid MEDLINE(R) <1996 to August Week 4 2006>
Search Strategy:
----------------------------------------------------------
exp Magnetic Resonance Spectroscopy/ (58093)
(spectroscop$ adj2 (magnetic resonance or mr)).mp. [mp=title, original title, abstract, name of substance word, subject heading word] (41955)
positron emission tomography.mp. or exp Positron-Emission Tomography/ (12914)
exp Magnetoencephalography/ or magnetoencephalography.mp. [mp=title, original title, abstract, name of substance word, subject heading word] (2576)
*tomography, emission-computed/ (6646)
fmri.mp. (6022)
(functional and (MRI or MR or magnetic resonance imaging)).mp. [mp=title, original title, abstract, name of substance word, subject heading word] (13937)
(functional imaging or neuroimaging).mp. [mp=title, original title, abstract, name of substance word, subject heading word] (9686)
or/1-8 (97099)
exp Alzheimer Disease/ (24647)
9 and 10 (1056)
limit 11 to (humans and english language and yr=“2000 - 2006”) (667)
(systematic$ review$ or random$ or meta-analysis or metaanalysis).mp. [mp=title, original title, abstract, name of substance word, subject heading word] (296345)
12 and 13 (30)
12 (667)
limit 15 to (case reports or comment or editorial or letter or “review”) (202)
15 not 16 (465)
limit 17 to “diagnosis (sensitivity)” (236)
14 or 18 (256)
Database: EMBASE <1980 to 2006 Week 35>
Search Strategy:
-----------------------------------------------------
exp Nuclear Magnetic Resonance Spectroscopy/ (23673)
(spectroscop$ adj2 (magnetic resonance or mr)).mp. [mp=title, abstract, subject headings, heading word, drug trade name, original title, device manufacturer, drug manufacturer name] (32710)
positron emission tomography.mp. or exp Positron Emission Tomography/ (30339)
fmri.mp. or exp Functional Magnetic Resonance Imaging/ (7689)
magnetoencephalography.mp. or exp MAGNETOENCEPHALOGRAPHY/ (2876)
functional imaging.mp. (2695)
exp neuroimaging/ (8192)
or/1-7 (79002)
exp ALZHEIMER DISEASE/ (49328)
8 and 9 (1961)
limit 10 to (human and english language and yr=”2000 - 2006”) (1033)
(systematic$ review$ or random$ or meta-analysis or metaanalysis).mp. [mp=title, abstract, subject headings, heading word, drug trade name, original title, device manufacturer, drug manufacturer name] (373557)
11 and 12 (58)
11 (1033)
limit 14 to (editorial or letter or note or “review”) (392)
Case Report/ (901734)
14 not (15 or 16) (605)
limit 17 to “diagnosis (sensitivity)” (347)
13 or 18 (393)
Brain Tumours
Search date: September 1, 2006
Databases searched: OVID MEDLINE, MEDLINE In-Process & Other Non-Indexed Citations,
EMBASE, INAHTA, Cochrane Library
Database: Ovid MEDLINE(R) <1996 to August Week 4 2006>
Search Strategy:
------------------------------------------------------------
exp Magnetic Resonance Spectroscopy/ (58093)
(spectroscop$ adj2 (magnetic resonance or mr)).mp. [mp=title, original title, abstract, name of substance word, subject heading word] (41955)
positron emission tomography.mp. or exp Positron-Emission Tomography/ (12914)
exp Magnetoencephalography/ or magnetoencephalography.mp. [mp=title, original title, abstract, name of substance word, subject heading word] (2576)
*tomography, emission-computed/ (6646)
fmri.mp. (6022)
(functional and (MRI or MR or magnetic resonance imaging)).mp. [mp=title, original title, abstract, name of substance word, subject heading word] (13937)
(functional imaging or neuroimaging).mp. [mp=title, original title, abstract, name of substance word, subject heading word] (9686)
or/1-8 (97099)
exp Brain Neoplasms/ (29296)
9 and 10 (2067)
limit 11 to (humans and english language and yr=”2000 - 2006”) (1215)
(systematic$ review$ or random$ or meta-analysis or metaanalysis).mp. [mp=title, original title, abstract, name of substance word, subject heading word] (296345)
12 and 13 (16)
12 (1215)
limit 15 to (case reports or comment or editorial or letter or “review”) (535)
15 not 16 (680)
limit 17 to “diagnosis (sensitivity)” (442) 19 14 or 18 (451)
Database: EMBASE <1980 to 2006 Week 35>
Search Strategy:
---------------------------------------------------------
exp Brain Tumor/ (46628)
exp Brain Cancer/ (2494)
exp Nuclear Magnetic Resonance Spectroscopy/ (23673)
(spectroscop$ adj2 (magnetic resonance or mr)).mp. [mp=title, abstract, subject headings, heading word, drug trade name, original title, device manufacturer, drug manufacturer name] (32710)
positron emission tomography.mp. or exp Positron Emission Tomography/ (30339)
fmri.mp. or exp Functional Magnetic Resonance Imaging/ (7689)
magnetoencephalography.mp. or exp MAGNETOENCEPHALOGRAPHY/ (2876)
functional imaging.mp. (2695)
exp neuroimaging/ (8192)
or/3-9 (79002)
exp Brain Tumor/ or exp Brain Cancer/ (46628)
10 and 11 (2032)
limit 12 to (human and english language and yr=”2000 - 2006”) (1132)
(systematic$ review$ or random$ or meta-analysis or metaanalysis).mp. [mp=title, abstract, subject headings, heading word, drug trade name, original title, device manufacturer, drug manufacturer name] (373557)
13 and 14 (27)
13 (1132)
limit 16 to (editorial or letter or note or “review”) (379)
Case Report/ (901734)
16 not (17 or 18) (531)
limit 19 to “diagnosis (sensitivity)” (371)
15 or 20 (390)
Epilepsy
Search date: September 1, 2006
Databases searched: OVID MEDLINE, MEDLINE In-Process & Other Non-Indexed Citations,
EMBASE, INAHTA, Cochrane Library
Database: Ovid MEDLINE(R) <1996 to August Week 4 2006>
Search Strategy:
---------------------------------------------------------
exp Magnetic Resonance Spectroscopy/ (58093)
(spectroscop$ adj2 (magnetic resonance or mr)).mp. [mp=title, original title, abstract, name of substance word, subject heading word] (41955)
positron emission tomography.mp. or exp Positron-Emission Tomography/ (12914)
exp Magnetoencephalography/ or magnetoencephalography.mp. [mp=title, original title, abstract, name of substance word, subject heading word] (2576)
*tomography, emission-computed/ (6646)
fmri.mp. (6022)
(functional and (MRI or MR or magnetic resonance imaging)).mp. [mp=title, original title, abstract, name of substance word, subject heading word] (13937)
(functional imaging or neuroimaging).mp. [mp=title, original title, abstract, name of substance word, subject heading word] (9686)
or/1-8 (97099)
exp Epilepsy/ (33384)
9 and 10 (2384)
limit 11 to (humans and english language and yr=”2000 - 2006”) (1418)
(systematic$ review$ or random$ or meta-analysis or metaanalysis).mp. [mp=title, original title, abstract, name of substance word, subject heading word] (296345)
12 and 13 (18)
12 (1418)
limit 15 to (case reports or comment or editorial or letter or “review”) (634)
15 not 16 (784)
limit 17 to “diagnosis (sensitivity)” (445)
14 or 18 (460)
Database: EMBASE <1980 to 2006 Week 35>
Search Strategy:
------------------------------------------------------
exp Nuclear Magnetic Resonance Spectroscopy/ (23673)
(spectroscop$ adj2 (magnetic resonance or mr)).mp. [mp=title, abstract, subject headings, heading word, drug trade name, original title, device manufacturer, drug manufacturer name] (32710)
positron emission tomography.mp. or exp Positron Emission Tomography/ (30339)
fmri.mp. or exp Functional Magnetic Resonance Imaging/ (7689)
magnetoencephalography.mp. or exp MAGNETOENCEPHALOGRAPHY/ (2876)
functional imaging.mp. (2695)
exp neuroimaging/ (8192)
or/1-7 (79002)
exp Epilepsy/ (64653)
8 and 9 (3003)
limit 10 to (human and english language and yr=”2000 - 2006”) (1535)
(systematic$ review$ or random$ or meta-analysis or metaanalysis).mp. [mp=title, abstract, subject headings, heading word, drug trade name, original title, device manufacturer, drug manufacturer name] (373557)
11 and 12 (18)
11 (1535)
limit 14 to (editorial or letter or note or “review”) (426)
Case Report/ (901734)
14 not (15 or 16) (766)
limit 17 to “diagnosis (sensitivity)” (478)
13 or 18 (493)
Multiple Sclerosis
Search date: August 15, 2006
Databases searched: OVID MEDLINE, MEDLINE In-Process & Other Non-Indexed Citations,
EMBASE, INAHTA, Cochrane Library
Database: Ovid MEDLINE(R) <1996 to August Week 1 2006>
Search Strategy:
---------------------------------------------------------
exp Magnetic Resonance Spectroscopy/ (57712)
(spectroscop$ adj2 (magnetic resonance or mr)).mp. [mp=title, original title, abstract, name of substance word, subject heading word] (41674)
positron emission tomography.mp. or exp Positron-Emission Tomography/ (12759)
exp Magnetoencephalography/ or magnetoencephalography.mp. [mp=title, original title, abstract, name of substance word, subject heading word] (2564)
*tomography, emission-computed/ (6644)
fmri.mp. (5943)
(functional and (MRI or MR or magnetic resonance imaging)).mp. [mp=title, original title, abstract, name of substance word, subject heading word] (13807)
(functional imaging or neuroimaging).mp. [mp=title, original title, abstract, name of substance word, subject heading word] (9602)
or/1-8 (96341)
exp Multiple Sclerosis/ (12061)
9 and 10 (533)
limit 11 to (humans and english language and yr=”2000 - 2006”) (348)
(systematic$ review$ or random$ or meta-analysis or metaanalysis).mp. [mp=title, original title, abstract, name of substance word, subject heading word] (293907)
12 and 13 (22)
12 (348)
limit 15 to (case reports or comment or editorial or letter or “review”) (125)
15 not 16 (223)
limit 17 to “diagnosis (sensitivity)” (107)
14 or 18 (125)
Database: EMBASE <1980 to 2006 Week 32>
Search Strategy:
---------------------------------------------------------------
exp Nuclear Magnetic Resonance Spectroscopy/ (23468)
(spectroscop$ adj2 (magnetic resonance or mr)).mp. [mp=title, abstract, subject headings, heading word, drug trade name, original title, device manufacturer, drug manufacturer name] (32745)
positron emission tomography.mp. or exp Positron Emission Tomography/ (30049)
fmri.mp. or exp Functional Magnetic Resonance Imaging/ (7535)
magnetoencephalography.mp. or exp MAGNETOENCEPHALOGRAPHY/ (2838)
functional imaging.mp. (2693)
exp neuroimaging/ (7926)
or/1-7 (78408)
exp Multiple Sclerosis/ (25637)
8 and 9 (662)
limit 10 to (human and english language and yr=”2000 - 2006”) (447)
(systematic$ review$ or random$ or meta-analysis or metaanalysis).mp. [mp=title, abstract, subject headings, heading word, drug trade name, original title, device manufacturer, drug manufacturer name] (370586)
11 and 12 (22)
11 (447)
limit 14 to (editorial or letter or note or “review”) (156)
Case Report/ (898210)
14 not (15 or 16) (263)
limit 17 to “diagnosis (sensitivity)” (137)
13 or 18 (151)
Parkinson’s Disease
Search date: August 15, 2006
Databases searched: OVID MEDLINE, MEDLINE In-Process & Other Non-Indexed Citations,
EMBASE, INAHTA, Cochrane Library
Database: Ovid MEDLINE(R) <1996 to August Week 1 2006>
Search Strategy:
-------------------------------------------------------
exp Magnetic Resonance Spectroscopy/ (57712)
(spectroscop$ adj2 (magnetic resonance or mr)).mp. [mp=title, original title, abstract, name of substance word, subject heading word] (41674)
positron emission tomography.mp. or exp Positron-Emission Tomography/ (12759)
exp Magnetoencephalography/ or magnetoencephalography.mp. [mp=title, original title, abstract, name of substance word, subject heading word] (2564)
*tomography, emission-computed/ (6644)
fmri.mp. (5943)
(functional and (MRI or MR or magnetic resonance imaging)).mp. [mp=title, original title, abstract, name of substance word, subject heading word] (13807)
(functional imaging or neuroimaging).mp. [mp=title, original title, abstract, name of substance word, subject heading word] (9602)
or/1-8 (96341)
exp Parkinsonian Disorders/ (17308)
9 and 10 (877)
limit 11 to (humans and english language and yr=”2000 - 2006”) (535)
(systematic$ review$ or random$ or meta-analysis or metaanalysis).mp. [mp=title, original title, abstract, name of substance word, subject heading word] (293907)
12 and 13 (26)
12 (535)
limit 15 to (case reports or comment or editorial or letter or “review”) (204)
15 not 16 (331)
limit 17 to “diagnosis (sensitivity)” (103)
14 or 18 (128)
Database: EMBASE <1980 to 2006 Week 32>
Search Strategy:
exp Nuclear Magnetic Resonance Spectroscopy/ (23468)
(spectroscop$ adj2 (magnetic resonance or mr)).mp. [mp=title, abstract, subject headings, heading word, drug trade name, original title, device manufacturer, drug manufacturer name] (32745)
positron emission tomography.mp. or exp Positron Emission Tomography/ (30049)
fmri.mp. or exp Functional Magnetic Resonance Imaging/ (7535)
magnetoencephalography.mp. or exp MAGNETOENCEPHALOGRAPHY/ (2838)
functional imaging.mp. (2693)
exp neuroimaging/ (7926)
or/1-7 (78408)
exp parkinson disease/ or exp parkinsonism/ (36760)
8 and 9 (1768)
limit 10 to (human and english language and yr=”2000 - 2006”) (908)
(systematic$ review$ or random$ or meta-analysis or metaanalysis).mp. [mp=title, abstract, subject headings, heading word, drug trade name, original title, device manufacturer, drug manufacturer name] (370586)
11 and 12 (50)
11 (908)
limit 14 to (editorial or letter or note or “review”) (373)
Case Report/ (898210)
14 not (15 or 16) (470)
limit 17 to “diagnosis (sensitivity)” (195)
13 or 18 (236)
Suggested Citation
This report should be cited as follows:
Medical Advisory Secretariat. Functional brain imaging: an evidence-based analysis. Ontario Health Technology Assessment Series 2006; 6 (22)
Permission Requests
All inquiries regarding permission to reproduce any content in the Ontario Health Technology Assessment Series should be directed to MASinfo@moh.gov.on.ca.
How to Obtain Issues in the Ontario Health Technology Assessment Series
All reports in the Ontario Health Technology Assessment Series are freely available in PDF format at the following URL: www.health.gov.on.ca/ohtas.
Print copies can be obtained by contacting MASinfo@moh.gov.on.ca.
Conflict of Interest Statement
All analyses in the Ontario Health Technology Assessment Series are impartial and subject to a systematic evidence-based assessment process. There are no competing interests or conflicts of interest to declare.
Peer Review
All Medical Advisory Secretariat analyses are subject to external expert peer review. Additionally, the public consultation process is also available to individuals wishing to comment on an analysis prior to finalization. For more information, please visit http://www.health.gov.on.ca/english/providers/program/ohtac/public_engage_overview.html.
Contact Information
The Medical Advisory Secretariat
Ministry of Health and Long-Term Care
20 Dundas Street West, 10th floor
Toronto, Ontario
CANADA
M5G 2N6
Email: MASinfo@moh.gov.on.ca
Telephone: 416-314-1092
ISSN 1915-7398 (Online)
ISBN 978-1-4249-7095-7 (PDF)
About the Medical Advisory Secretariat
The Medical Advisory Secretariat is part of the Ontario Ministry of Health and Long-Term Care. The mandate of the Medical Advisory Secretariat is to provide evidence-based policy advice on the coordinated uptake of health services and new health technologies in Ontario to the Ministry of Health and Long-Term Care and to the healthcare system. The aim is to ensure that residents of Ontario have access to the best available new health technologies that will improve patient outcomes.
The Medical Advisory Secretariat also provides a secretariat function and evidence-based health technology policy analysis for review by the Ontario Health Technology Advisory Committee (OHTAC).
The Medical Advisory Secretariat conducts systematic reviews of scientific evidence and consultations with experts in the health care services community to produce the Ontario Health Technology Assessment Series.
About the Ontario Health Technology Assessment Series
To conduct its comprehensive analyses, the Medical Advisory Secretariat systematically reviews available scientific literature, collaborates with partners across relevant government branches, and consults with clinical and other external experts and manufacturers, and solicits any necessary advice to gather information. The Medical Advisory Secretariat makes every effort to ensure that all relevant research, nationally and internationally, is included in the systematic literature reviews conducted.
The information gathered is the foundation of the evidence to determine if a technology is effective and safe for use in a particular clinical population or setting. Information is collected to understand how a new technology fits within current practice and treatment alternatives. Details of the technology’s diffusion into current practice and information from practicing medical experts and industry, adds important information to the review of the provision and delivery of the health technology in Ontario. Information concerning the health benefits; economic and human resources; and ethical, regulatory, social and legal issues relating to the technology assist policy makers to make timely and relevant decisions to maximize patient outcomes.
If you are aware of any current additional evidence to inform an existing Evidence-Based Analysis, please contact the Medical Advisory Secretariat: MASInfo@moh.gov.on.ca. The public consultation process is also available to individuals wishing to comment on an analysis prior to publication. For more information, please visit http://www.health.gov.on.ca/english/providers/program/ohtac/public_engage_overview.html.
Disclaimer
This evidence-based analysis was prepared by the Medical Advisory Secretariat, Ontario Ministry of Health and Long-Term Care, for the Ontario Health Technology Advisory Committee and developed from analysis, interpretation and comparison of scientific research and/or technology assessments conducted by other organizations. It also incorporates, when available, Ontario data, and information provided by experts and applicants to the Medical Advisory Secretariat to inform the analysis. While every effort has been made to do so, this document may not fully reflect all scientific research available. Additionally, other relevant scientific findings may have been reported since completion of the review. This evidence-based analysis is current to the date of publication. This analysis may be superceded by an updated publication on the same topic. Please check the Medical Advisory Secretariat Website foralist of all evidence-based analyses: http://www.health.gov.on.ca/ohtas
Abbreviations
- AAN
American Academy of Neurology
- ACR
American College of Radiology
- AD
Alzheimer’s disease
- ADRDA
Alzheimer’s Disease and Related Disorders Association
- AETMIS
Agence d’Évaluation des Technologies et des Modes d’Intervention en Santé
- AHRQ
Agency for Health Research and Quality
- ASNR
American Society of Neuroradiology
- CCHS
Canadian Community Health Survey
- CCTR
Cochrane Controlled Trials Register
- Cho
Choline
- CI
Confidence interval
- CINAHL
Cumulative Index to Nursing & Allied Health Literature
- CMS
Centers for Medicare and Medicaid Services
- CNS
Central nervous system
- Cr
Creatine
- CT
Computed tomography
- DARE
Database of Abstracts of Reviews of Effectiveness
- DAT
Dopamine transporter
- DMFP
Dorsal medial prefrontal cortex
- ECoG
Electrocortocography
- ECRI
ECRI Institute
- EEG
Electroencephalogram
- ETLE
Extratemporal lobe epilepsy
- FDA
Food and Drug Administration
- FDG
18F-labelled-fluorodeoxyglucose
- FDOPA
fluorodopa
- FET
O-(2-18F-Fluoroethyl)-L-Tyrosine
- FLE
Frontal lobe epilepsy
- FLT
18F-labelled-fluoro-3'-deoxyl-3'-L-fluorothymidine
- fMRI
Functional magnetic resonance imaging
- FP CIT
Fluoropropyl ß-carbomethoxy-3 ß-4-iodophenyltropane
- FTLE
Frontotemporal lobe epilepsy
- Gd
Gadolinium
- GIN
Guidelines International Network
- H&Y
Hoehn & Yahr stage
- HTA
Health technology assessment
- IBZM
123-iodobenzamide
- ICEEG
Intracranial electroencephalogram
- INAHTA
International Network of Agencies for Health Technology Assessment
- IPD
Idiopathic Parkinson’s disease
- ISMRM
International Society for Magnetic Resonance in Medicine
- LILACS
Latin American and Caribbean Health Sciences Literature
- LTLE
Lateral temporal lobe epilepsy
- MCI
Mild cognitive impairment
- MEG
Magnetoencephalography
- MET
L-methyl-11C-methionine
- MRI
Magnetic resonance imaging
- MRS
Magnetic resonance spectroscopy
- MS
Multiple sclerosis
- MSA
Multiple system atrophy
- MSAC
Medical Services Advisory Committee
- MSI
Magnetic source images
- MTLE
Mesial temporal lobe epilepsy
- N/A
Not applicable
- NAA
N-acetylaspartate
- NGC
National Guideline Clearinghouse
- NHS
National Health Service
- NICE
National Institute of Clinical Evidence
- NINCDS
National Institute of Neurological and Communicative Disorders and Stroke
- NPHS
National Population Health Survey
- NPV
Negative predictive value
- NR
Not reported
- NTLE
Neocortical temporal lobe epilepsy
- OHS
Ontario Health Survey
- OLE
Occipital lobe epilepsy
- PCS
Prospective cohort study
- PD
Parkinson’s disease
- PET
Positron emission tomography
- PLE
Parietal lobe epilepsy
- PPV
Positive predictive value
- RACLO
11-C-Raclopride
- RCT
Randomized controlled trial
- RS
Retrospective study
- RSNA
Radiological Society of North America
- RT
Radiation therapy
- SD
Standard deviation
- SPECT
Single photon emission computed tomography
- TLE
Temporal lobe epilepsy
- VATAP
Veterans Affairs Technology Assessment Program
- VBM
Voxel-based morphology
- UPDRS III
Unified Parkinson’s Disease Rating Scale, Motor Function
References
- 1.Seltzer B. Cholinesterase inhibitors in the clinical management of Alzheimer's disease: importance of early and persistent treatment. J Int Med Res. 2006;34(4):339–47. doi: 10.1177/147323000603400401. [DOI] [PubMed] [Google Scholar]
- 2.Canadian Study of Health and Aging Working Group. Canadian Study of Health and Aging: study methods and prevalence of dementia. Can Med Assoc J. 1994;150(6):899–913. [PMC free article] [PubMed] [Google Scholar]
- 3.Canadian Study of Health and Aging Working Group. The incidence of dementia in Canada. Neurology. 2000;55(1):66–73. [PubMed] [Google Scholar]
- 4.Alzheimer's Society of Canada. Statistics in Alzheimer's disease [Internet] Toronto: The Society. [[updated 2006; cited 2006 Oct 23]]. Available from: http://www.alzheimer.ca/english/disease/stats-people.htm .
- 5.Alzheimer's Society of Canada. Alzheimer's Society of Canada: making the diagnosis [Internet] Toronto: The Society. [[updated 2006; cited 2006 Dec 4]]. Available from: http://www.alzheimer.ca/english/disease/diagnosis.htm .
- 6.Canadian Cancer Society/National Cancer Institute of Canada. Canadian cancer statistics 2006 [Internet] Toronto, Canada: Canadian Cancer Society; 2006. [[cited 2006 Dec 23]]. Available from: http://www.cancer.ca/vgn/images/portal/cit_86751114/31/21/935505792cw_2006stats_en.pdf.pdf .
- 7.ECRI. Positron imaging for differentiation of recurrent brain tumor from radionecrosis: update. 2002. Issue #79. Plymouth Meeting, PA: ECRI; Windows on Medical Technologies.
- 8.Cha S. Update on brain tumor imaging: from anatomy to physiology. AJNR Am J Neuroradiol. 2006;27(3):475–87. [PMC free article] [PubMed] [Google Scholar]
- 9.Whiting P, Gupta R, Burch J, Mota RE, Wright K, Marson A, et al. A systematic review of the effectiveness and cost-effectiveness of neuroimaging assessments used to visualise the seizure focus in people with refractory epilepsy being considered for surgery. Health Technol Assess. 2006;10(4):1–250. doi: 10.3310/hta10040. [DOI] [PubMed] [Google Scholar]
- 10.Tellez-Zenteno JF, Pondal-Sordo M, Matijevic S, Wiebe S. National and regional prevalence of self-reported epilepsy in Canada. Epilepsia. 2004;45(12):1623–9. doi: 10.1111/j.0013-9580.2004.24904.x. [DOI] [PubMed] [Google Scholar]
- 11.Tellez-Zenteno JF, Dhar R, Wiebe S. Long-term seizure outcomes following epilepsy surgery: a systematic review and meta-analysis. Brain. 2005;128(Pt 5):1188–98. doi: 10.1093/brain/awh449. [DOI] [PubMed] [Google Scholar]
- 12.Engel J Jr. Surgery for seizures. N Engl J Med. 1996;334(10):647–52. doi: 10.1056/NEJM199603073341008. [DOI] [PubMed] [Google Scholar]
- 13.Beck CA, Metz LM, Svenson LW, Patten SB. Regional variation of multiple sclerosis prevalence in Canada. Mult Scler. 2005;11(5):516–9. doi: 10.1191/1352458505ms1192oa. [DOI] [PubMed] [Google Scholar]
- 14.Whiting P, Harbord R, Main C, Deeks JJ, Filippini G, Egger M, et al. Accuracy of magnetic resonance imaging for the diagnosis of multiple sclerosis: systematic review. BMJ. 2006;332(7546):875–84. doi: 10.1136/bmj.38771.583796.7C. [DOI] [PMC free article] [PubMed] [Google Scholar]
- 15.Parkinson Society Canada. Parkinson Society Canada [Internet] [[updated 2006; cited 2006 May 30]]. Toronto: The Society. Available from: http://www.parkinson.ca/research/research.html .
- 16.Piccini P, Whone A. Functional brain imaging in the differential diagnosis of Parkinson's disease. Lancet Neurol. 2004;3(5):284–90. doi: 10.1016/S1474-4422(04)00736-7. [DOI] [PubMed] [Google Scholar]
- 17.Hughes AJ, Daniel SE, Kilford L, Lees AJ. Accuracy of clinical diagnosis of idiopathic Parkinson's disease: a clinico-pathological study of 100 cases. J Neurol Neurosurg Psychiatry. 1992;55(3):181–4. doi: 10.1136/jnnp.55.3.181. [DOI] [PMC free article] [PubMed] [Google Scholar]
- 18.Hughes AJ, Daniel SE, Lees AJ. Improved accuracy of clinical diagnosis of Lewy body Parkinson's disease. Neurology. 2001;57(8):1497–9. doi: 10.1212/wnl.57.8.1497. [DOI] [PubMed] [Google Scholar]
- 19.Doudet DJ. Radionuclide imaging in Parkinson's disease: Diagnosis, treatment, and disease progression. J Pharm Pract. 2001;14(4):341–50. [Google Scholar]
- 20.Au WL, Adams JR, Troiano A, Stoessl AJ. Neuroimaging in Parkinson's disease. J Neural Transm Suppl. 2006. pp. 241–8. [PubMed]
- 21.Mayo Clinic. Positron emission tomography (PET) scan [Internet] [[updated 2006; cited 2006 Dec 6]]. Available from:http://www.mayoclinic.com/health/pet-scan/CA00052 .
- 22.Rock JP, Scarpace L, Hearshen D, Gutierrez J, Fisher JL, Rosenblum M, et al. Associations among magnetic resonance spectroscopy, apparent diffusion coefficients, and image-guided histopathology with special attention to radiation necrosis. Neurosurgery. 2004;54(5):1111–9. doi: 10.1227/01.neu.0000119328.56431.a7. [DOI] [PubMed] [Google Scholar]
- 23.Makela JP, Forss N, Jaaskelainen J, Kirveskari E, Korvenoja A, Paetau R. Magnetoencephalography in neurosurgery. Neurosurgery. 2006;59(3):493–511. doi: 10.1227/01.NEU.0000232762.63508.11. [DOI] [PubMed] [Google Scholar]
- 24.VSM Medtech. Overview of MEG technology [Internet] [[updated 2006; cited 6 A.D. Oct 27]]. Coquitlam, BC: VSM Medtech Ltd. Available from: http://www.vsmmedtech.com/products/meg/overview/technology.htm .
- 25.Hospital for Sick Children. Sick Kids. Annual report 2001-2002 [Internet] [[cited 2006 Oct 20]]. Toronto: Hospital for Sick Children; 2001. Available from: http://www.sickkids.ca/AnnualReport2001_2002/default.asp .
- 26.Cascino GD, Trenerry MR, Sharbrough FW, So EL, Marsh WR, Strelow DC. Depth electrode studies in temporal lobe epilepsy: relation to quantitative magnetic resonance imaging and operative outcome. Epilepsia. 1995;36(3):230–5. doi: 10.1111/j.1528-1157.1995.tb00989.x. [DOI] [PubMed] [Google Scholar]
- 27.Weinand ME, El-Saadany WF, Labiner DM, Talwar D, Ahern G. Subdural strip electrode monitoring and surgical decision making in refractory epilepsy: validity and prognostic value of noninvasive localizing data. J Epilepsy. 1995;8(2):131–8. [Google Scholar]
- 28.Fryback DG, Thornbury JR. The efficacy of diagnostic imaging. Med Decis Making. 1991;11(2):88–94. doi: 10.1177/0272989X9101100203. [DOI] [PubMed] [Google Scholar]
- 29.Dussault F-P, Nguyen VH, Rachet F. Positron emission tomography in Quebec [Internet] [[cited 2006 Oct 10]]. pp. xviii–270. AETMIS 01-3 RE. Montreal, Quebec: AETMIS; 2001. Available from: www.aetmis.gouv.qc.ca/site/download.php?65e3c486983f01767e90e114f7ff1e23 .
- 30.Medical Services Advisory Committee (MSAC) Positron emission tomography (PET) for epilepsy [Internet] [[cited 2006 Oct 15]]. MSAC reference 26. Canberra, Australia: Commonwealth of Australia; 2004. Available from: http://www.msac.gov.au/internet/msac/publishing.nsf/Content/ref26-1/$FILE/msacref26.pdf .
- 31.Medical Services Advisory Committee (MSAC) Positron emission tomography Report No. 2822. [[cited 2006 Oct 15]]. Canberra, Australia: Commonwealth of Australia; 2000. Available from: http://www.msac.gov.au/internet/msac/publishing.nsf/Content/ref02-1/$FILE/msacref02.pdf .
- 32.Adams E, Asua J, Olasagasti JC, Erlichman M, Flynn K, Hurtado-Saracho I. Positron emission tomography: experience with PET and synthesis of the evidence [Internet] [[cited 2006 Oct 3]]. Boston, MA: U.S. Department of Veterans; 1999. Available from: http://www.inahta.org/Reports.asp?name=Content11%2Fpublikationer%2F9%2Fpet%2Epdf .
- 33.Matchar DB, Kulasingam SL, Huntington A, Patwardhan M, Mann LO. Positron emission tomography, single photon emission computed tomography, computed tomography, functional magnetic resonance imaging, and magnetic resonance spectroscopy and for the diagnosis and management of Alzheimer's dementia [Internet] [[cited 2006 Oct 15]]. Available from: http://www.cms.hhs.gov/coverage/download/id104b.pdf . [PubMed]
- 34.Matchar DB, Kulasingam SL, McCrory DC, Patwardhan MB, Rutschmann O, Samsa GP, et al. Use of positron emission tomography and other neuroimaging techniques in the diagnosis and management of Alzheimer's disease and dementia [Internet] [[cited 2006 Oct 31]]. Available from: http://www.cms.hhs.gov/coverage/8b3-ww.asp . [PubMed]
- 35.Patwardhan MB, McCrory DC, Matchar DB, Samsa GP, Rutschmann OT. Alzheimer disease: operating characteristics of PET--a meta-analysis. Radiology. 2004;231(1):73–80. doi: 10.1148/radiol.2311021620. [DOI] [PubMed] [Google Scholar]
- 36.Gill SS, Rochon PA, Guttman M, Laupacis A. The value of positron emission tomography in the clinical evaluation of dementia. J Am Geriatr Soc. 2003;51(2):258–64. doi: 10.1046/j.1532-5415.2003.51067.x. [DOI] [PubMed] [Google Scholar]
- 37.ECRI. PET for diagnosis of Alzheimer's disease. Plymouth: Meeting, PA: ECRI; 2002. [Google Scholar]
- 38.Veterans Health Administration Management Decision and Research Center. Positron emission tomography: Descriptive analysis of experience with PET in VA. A systematic review update of FDG-PET as a diagnostic test in cancer and Alzheimer's disease [Internet] [[cited 2006 Oct 23]]. Boston, MA: U. S. Department of Veterans Affairs; 1998. Available from: http://www.va.gov/VATAP/index.htm .
- 39.Hollingworth W, Medina LS, Lenkinski RE, Shibata DK, Bernal B, Zurakowski D, et al. A systematic literature review of magnetic resonance spectroscopy for the characterization of brain tumors. AJNR Am J Neuroradiol. 2006;27(7):1404–11. [PMC free article] [PubMed] [Google Scholar]
- 40.Matchar DB, Kulasingam SL, Havrilesky L, Mann LO, Myers ER, McCrory DC, et al. Positron emission testing for six cancers (brain, cervical, small cell lung, ovarian, pancreatic and testicular) [Internet] [[cited 2006 Oct 12]]. Rockville, Maryland: Agency for Healthcare Research and Quality (AHRQ); 2004. Available from: http://www.cms.hhs.gov/mcd/viewtechassess.asp?id=92 . [PubMed]
- 41.Jordan HS, Bert R, Chew P, Kupelnick B, Lau J. Magnetic resonance spectroscopy for brain tumors [Internet] [[cited 2006 Oct 15]]. Rockville, Maryland: Agency for Healthcare Research and Quality (AHRQ); 2003. Available from: http://www.cms.hhs.gov/ncdr/tadetails.aspid=52 . [PubMed]
- 42.Blue Cross Blue Shield Association. Magnetic resonance spectroscopy for evaluation of suspected brain tumor [Internet] [[cited 2006 Dec 10]]. Chicago IL: Blue Cross Blue Shield Association (BCBS); 2003. Available from: http://www.bcbs.com/tec/vol18/18_01.html .
- 43.Blue Cross Blue Shield Association. Magnetoencephalography and magnetic source imaging: presurgical localization of epileptic lesions and presurgical functional mapping [Internet] [[cited 2006 Dec 10]]. Chicago IL: Blue Cross Blue Shield Association (BCBS); 2003. Available from: http://www.bcbs.com/tec/vol18/18_06.html . [PubMed]
- 44.Tolosa E, Wenning G, Poewe W. The diagnosis of Parkinson's disease. Lancet Neurol. 2006;5(1):75–86. doi: 10.1016/S1474-4422(05)70285-4. [DOI] [PubMed] [Google Scholar]
- 45.Levine CB, Fahrbach KR, Siderowf AD, Estok RP, Ludensky VM, Ross SD. Diagnosis and treatment of Parkinson's disease: a systematic review of the literature [Internet] [[cited 2006 Dec 12]]. Available from: http://www.ahrq.gov/downloads/pub/evidence/pdf/parkinsons/parkinsons.pdf . [PMC free article] [PubMed]
- 46.Clarke CE, Lowry M. Systematic review of proton magnetic resonance spectroscopy of the striatum in parkinsonian syndromes. Eur J Neurol. 2001;8(6):573–7. doi: 10.1046/j.1468-1331.2001.00308.x. [DOI] [PubMed] [Google Scholar]
- 47.Kawachi T, Ishii K, Sakamoto S, Sasaki M, Mori T, Yamashita F, et al. Comparison of the diagnostic performance of FDG-PET and VBM-MRI in very mild Alzheimer's disease. Eur J Nucl Med Mol Imaging. 2006;33(7):801–9. doi: 10.1007/s00259-005-0050-x. [DOI] [PubMed] [Google Scholar]
- 48.Dobert N, Pantel J, Frolich L, Hamscho N, Menzel C, Grunwald F. Diagnostic value of FDG-PET and HMPAO-SPET in patients with mild dementia and mild cognitive impairment: Metabolic index and perfusion index. 2005;20(2-3):63–70. doi: 10.1159/000085857. Dement Geriatr Cogn Disord. [DOI] [PubMed] [Google Scholar]
- 49.Drzezga A, Grimmer T, Riemenschneider M, Lautenschlager N, Siebner H, Alexopoulus P, et al. Prediction of individual clinical outcome in MCI by means of genetic assessment and (18)F-FDG PET. J Nucl Med. 2005;46(10):1625–32. [PubMed] [Google Scholar]
- 50.Wang SX, Boethius J, Ericson K. FDG-PET on irradiated brain tumor: ten years’ summary. Acta Radiol. 2006;47(1):85–90. doi: 10.1080/02841850500335101. [DOI] [PubMed] [Google Scholar]
- 51.Choi SJ, Kim JS, Kim JH, Oh SJ, Lee JG, Kim CJ, et al. [18F]3'-deoxy-3'-fluorothymidine PET for the diagnosis and grading of brain tumors. European journal of nuclear medicine and molecular imaging. 2005;32(6):653–9. doi: 10.1007/s00259-004-1742-3. [DOI] [PubMed] [Google Scholar]
- 52.Pauleit D, Floeth F, Hamacher K, Riemenschneider MJ, Reifenberger G, Muller HW, et al. O-(2-[18F]fluoroethyl)-L-tyrosine PET combined with MRI improves the diagnostic assessment of cerebral gliomas. 2005;128(Pt:3):678–87. doi: 10.1093/brain/awh399. Brain. [DOI] [PubMed] [Google Scholar]
- 53.Jacobs AH, Thomas A, Kracht LW, Li H, Dittmar C, Garlip G, et al. 18F-fluoro-L-thymidine and 11C-methylmethionine as markers of increased transport and proliferation in brain tumors. J Nucl Med. 2005;46(12):1948–58. [PubMed] [Google Scholar]
- 54.Kracht LW, Miletic H, Busch S, Jacobs A, Voges J, Hoevels M, et al. Delineation of brain tumor extent with 11C-L-methionine positron emission tomography: local comparison with stereotactic histopathology. Clin Cancer Res. 2004;10(21):7163–70. doi: 10.1158/1078-0432.CCR-04-0262. [DOI] [PubMed] [Google Scholar]
- 55.Chen W, Silverman DH, Delaloye S, Czernin J, Kamdar N, Pope W, et al. 18F-FDOPA PET imaging of brain tumors: comparison study with 18F-FDG PET and evaluation of diagnostic accuracy. J Nucl Med. 2006;47(6):904–11. [PubMed] [Google Scholar]
- 56.Rachinger W, Goetz C, Popperl G, Gildehaus FJ, Kreth FW, Holtmannspotter M, et al. Positron emission tomography with O-(2-[18F]fluoroethyl)-l-tyrosine versus magnetic resonance imaging in the diagnosis of recurrent gliomas. 2005;57(3):505–11. doi: 10.1227/01.neu.0000171642.49553.b0. Neurosurgery. [DOI] [PubMed] [Google Scholar]
- 57.Lichy MP, Plathow C, Schulz-Ertner D, Kauczor HU, Schlemmer HP. Follow-up gliomas after radiotherapy: 1H MR spectroscopic imaging for increasing diagnostic accuracy. Neuroradiology. 2005;47(11):826–34. doi: 10.1007/s00234-005-1434-0. [DOI] [PubMed] [Google Scholar]
- 58.Sundgren PC, Fan X, Weybright P, Welsh RC, Carlos RC, Petrou M, et al. Differentiation of recurrent brain tumor versus radiation injury using diffusion tensor imaging in patients with new contrast-enhancing lesions. Magn Reson Imaging. 2006;24(9):1131–42. doi: 10.1016/j.mri.2006.07.008. [DOI] [PubMed] [Google Scholar]
- 59.Weybright P, Sundgren PC, Maly P, Hassan DG, Nan B, Rohrer S, et al. Differentiation between brain tumor recurrence and radiation injury using MR spectroscopy. AJR Am J Roentgenol. 2005;185(6):1471–6. doi: 10.2214/AJR.04.0933. [DOI] [PubMed] [Google Scholar]
- 60.Palumbo B, Lupattelli M, Pelliccioli GP, Chiarini P, Moschini TO, Palumbo I, et al. Association of 99mTc-MIBI brain SPECT and proton magnetic resonance spectroscopy (1H-MRS) to assess glioma recurrence after radiotherapy. Q J Nucl Med Mol Imaging. 2006;50(1):88–93. [PubMed] [Google Scholar]
- 61.Floeth FW, Pauleit D, Wittsack HJ, Langen KJ, Reifenberger G, Hamacher K, et al. Multimodal metabolic imaging of cerebral gliomas: positron emission tomography with [18F]fluoroethyl-L-tyrosine and magnetic resonance spectroscopy. J Neurosurg. 2005;102(2):318–27. doi: 10.3171/jns.2005.102.2.0318. [DOI] [PubMed] [Google Scholar]
- 62.Yun CH, Lee SK, Lee SY, Kim KK, Jeong SW, Chung CK. Prognostic factors in neocortical epilepsy surgery: multivariate analysis. Epilepsia. 2006;47(3):574–9. doi: 10.1111/j.1528-1167.2006.00470.x. [DOI] [PubMed] [Google Scholar]
- 63.Lee SK, Lee SY, Kim KK, Hong KS, Lee DS, Chung CK. Surgical outcome and prognostic factors of cryptogenic neocortical epilepsy. Ann Neurol. 2005;58(4):525–32. doi: 10.1002/ana.20569. [DOI] [PubMed] [Google Scholar]
- 64.Lee SK, Lee SY, Kim DW, Lee DS, Chung CK. Occipital lobe epilepsy: clinical characteristics, surgical outcome, and role of diagnostic modalities. Epilepsia. 2005;46(5):688–95. doi: 10.1111/j.1528-1167.2005.56604.x. [DOI] [PubMed] [Google Scholar]
- 65.Kim DW, Lee SK, Yun CH, Kim KK, Lee DS, Chung CK, et al. Parietal lobe epilepsy: the semiology, yield of diagnostic workup, and surgical outcome. Epilepsia. 2004;45(6):641–9. doi: 10.1111/j.0013-9580.2004.33703.x. [DOI] [PubMed] [Google Scholar]
- 66.Benke T, Koylu B, Visani P, Karner E, Brenneis C, Bartha L, et al. Language lateralization in temporal lobe epilepsy: a comparison between fMRI and the Wada Test. Epilepsia. 2006;47(8):1308–19. doi: 10.1111/j.1528-1167.2006.00549.x. [DOI] [PubMed] [Google Scholar]
- 67.Medina LS, Bernal B, Dunoyer C, Cervantes L, Rodriguez M, Pacheco E, et al. Seizure disorders: functional MR imaging for diagnostic evaluation and surgical treatment--prospective study. Radiology. 2005;236(1):247–53. doi: 10.1148/radiol.2361040690. [DOI] [PubMed] [Google Scholar]
- 68.Sabsevitz DS, Swanson SJ, Hammeke TA, Spanaki MV, Possing ET, Morris GL, III, et al. Use of preoperative functional neuroimaging to predict language deficits from epilepsy surgery. Neurology. 2003;60(11):1788–92. doi: 10.1212/01.wnl.0000068022.05644.01. [DOI] [PubMed] [Google Scholar]
- 69.Woermann FG, Jokeit H, Luerding R, Freitag H, Schulz R, Guertler S, et al. Language lateralization by Wada test and fMRI in 100 patients with epilepsy. Neurology. 2003;61(5):699–701. doi: 10.1212/01.wnl.0000078815.03224.57. [DOI] [PubMed] [Google Scholar]
- 70.Binder JR, Swanson SJ, Hammeke TA, Morris GL, Mueller WM, Fischer M, et al. Determination of language dominance using functional MRI: a comparison with the Wada test. Neurology. 1996;46(4):978–84. doi: 10.1212/wnl.46.4.978. [DOI] [PubMed] [Google Scholar]
- 71.Knowlton RC, Elgavish R, Howell J, Blount J, Burneo JG, Faught E, et al. Magnetic source imaging versus intracranial electroencephalogram in epilepsy surgery: a prospective study. Ann Neurol. 2006;59(5):835–42. doi: 10.1002/ana.20857. [DOI] [PubMed] [Google Scholar]
- 72.Ochi A, Otsubo H, Iida K, Oishi M, Elliott I, Weiss SK, et al. Identifying the primary epileptogenic hemisphere from electroencephalographic (EEG) and magnetoencephalographic dipole lateralizations in children with intractable epilepsy. J Child Neurol. 2005;20(11):885–92. doi: 10.1177/08830738050200110501. [DOI] [PubMed] [Google Scholar]
- 73.Iwasaki M, Pestana E, Burgess RC, Luders HO, Shamoto H, Nakasato N. Detection of epileptiform activity by human interpreters: blinded comparison between electroencephalography and magnetoencephalography. Epilepsia. 2005;46(1):59–68. doi: 10.1111/j.0013-9580.2005.21104.x. [DOI] [PubMed] [Google Scholar]
- 74.Assaf BA, Karkar KM, Laxer KD, Garcia PA, Austin EJ, Barbaro NM, et al. Magnetoencephalography source localization and surgical outcome in temporal lobe epilepsy. Clin Neurophysiol. 2004;115(9):2066–76. doi: 10.1016/j.clinph.2004.04.020. [DOI] [PubMed] [Google Scholar]
- 75.Papanicolaou AC, Pataraia E, Billingsley-Marshall R, Castillo EM, Wheless J, Swank P, et al. Toward the substitution of invasive electroencephalography in epilepsy surgery. J Clin Neurophysiol. 2005;22(4):231–7. doi: 10.1097/01.wnp.0000172255.62072.e8. [DOI] [PubMed] [Google Scholar]
- 76.Papanicolaou AC, Simos PG, Castillo EM, Breier JI, Sarkari S, Pataraia E, et al. Magnetoencephalography: a noninvasive alternative to the Wada procedure. J Neurosurg. 2004;100(5):867–76. doi: 10.3171/jns.2004.100.5.0867. [DOI] [PubMed] [Google Scholar]
- 77.Pataraia E, Simos PG, Castillo EM, Billingsley RL, Sarkari S, Wheless JW, et al. Does magnetoencephalography add to scalp video-EEG as a diagnostic tool in epilepsy surgery? Neurology. 2004;62(6):943–8. doi: 10.1212/01.wnl.0000115122.81621.fe. [DOI] [PubMed] [Google Scholar]
- 78.Oishi M, Kameyama S, Masuda H, Tohyama J, Kanazawa O, Sasagawa M, et al. Single and multiple clusters of magnetoencephalographic dipoles in neocortical epilepsy: significance in characterizing the epileptogenic zone. Epilepsia. 2006;47(2):355–64. doi: 10.1111/j.1528-1167.2006.00428.x. [DOI] [PubMed] [Google Scholar]
- 79.Eckert T, Barnes A, Dhawan V, Frucht S, Gordon MF, Feigin AS, et al. FDG PET in the differential diagnosis of parkinsonian disorders. Neuroimage. 2005;26(3):912–21. doi: 10.1016/j.neuroimage.2005.03.012. [DOI] [PubMed] [Google Scholar]
- 80.Eshuis SA, Maguire RP, Leenders KL, Jonkman S, Jager PL. Comparison of FP-CIT SPECT with F-DOPA PET in patients with de novo and advanced Parkinson's disease. Eur J Nucl Med Mol Imaging. 2006;33(2):200–9. doi: 10.1007/s00259-005-1904-y. [DOI] [PubMed] [Google Scholar]
- 81.Schreckenberger M, Hagele S, Siessmeier T, Buchholz HG, Armbrust-Henrich H, Rosch F, et al. The dopamine D2 receptor ligand 18F-desmethoxyfallypride: an appropriate fluorinated PET tracer for the differential diagnosis of parkinsonism. Eur J Nucl Med Mol Imaging. 2004;31(8):1128–35. doi: 10.1007/s00259-004-1465-5. [DOI] [PubMed] [Google Scholar]
- 82.Ollenberger GP, Byrne AJ, Berlangieri SU, Rowe CC, Pathmaraj K, Reutens DC, et al. Assessment of the role of FDG PET in the diagnosis and management of children with refractory epilepsy. Eur J Nucl Med Mol Imaging. 2005;32(11):1311–6. doi: 10.1007/s00259-005-1844-6. [DOI] [PubMed] [Google Scholar]
- 83.Stefan H, Hummel C, Scheler G, Genow A, Druschky K, Tilz C, et al. Magnetic brain source imaging of focal epileptic activity: A synopsis of 455 cases. Brain. 2003;126(11):2396–405. doi: 10.1093/brain/awg239. [DOI] [PubMed] [Google Scholar]
- 84.Kulasingam SL, Samsa GP, Zarin DA, Rutschmann OT, Patwardhan MB, McCrory DC, et al. When should functional neuroimaging techniques be used in the diagnosis and management of Alzheimer's dementia? A decision analysis. Value Health. 2003;6(5):542–50. doi: 10.1046/j.1524-4733.2003.65248.x. [DOI] [PubMed] [Google Scholar]
- 85.Petrella JR, Shah LM, Harris KM, Friedman AH, George TM, Sampson JH, et al. Preoperative functional MR imaging localization of language and motor areas: Effect on therapeutic decision making in patients with potentially resectable brain tumors. Radiology. 2006;240(3):793–802. doi: 10.1148/radiol.2403051153. [DOI] [PubMed] [Google Scholar]
- 86.Winkler D, Strauss G, Lindner D, Richter A, Georgiadis MH, Von Cramon Y, et al. The importance of functional magnetic resonance imaging in neurosurgical treatment of tumors in the central region. Klin Neuroradiol. 2005;15(3):182–9. [Google Scholar]
- 87.Kulasingam SL, Samsa GP, Matchar DB. Linking dementia research to policy: an example using fluorodeoxyglucose positron emission tomography for the diagnosis of Alzheimer's dementia and mild cognitive impairment. Am J Alzheimers Dis Other Demen. 2006;21(2):73–8. doi: 10.1177/153331750602100203. [DOI] [PMC free article] [PubMed] [Google Scholar]
- 88.Krainik A, Lehericy S, Duffau H, Vlaicu M, Poupon F, Capelle L, et al. Role of the supplementary motor area in motor deficit following medial frontal lobe surgery. Neurology. 2001;57(5):871–8. doi: 10.1212/wnl.57.5.871. [DOI] [PubMed] [Google Scholar]
- 89.Van Westen D, Skagerberg G, Olsrud J, Fransson P, Larsson EM. Functional magnetic resonance imaging at 3T as a clinical tool in patients with intracranial tumors. Acta Radiol. 2005;46(6):599–609. doi: 10.1080/02841850510021652. [DOI] [PubMed] [Google Scholar]
- 90.Roessler K, Donat M, Lanzenberger R, Novak K, Geissler A, Gartus A, et al. Evaluation of preoperative high magnetic field motor functional MRI (3 Tesla) in glioma patients by navigated electrocortical stimulation and postoperative outcome. J Neurol Neurosurg Psychiatry. 2005;76(8):1152–7. doi: 10.1136/jnnp.2004.050286. [DOI] [PMC free article] [PubMed] [Google Scholar]
- 91.Tomczak RJ, Wunderlich AP, Wang Y, Braun V, Antoniadis G, Gorich J, et al. fMRI for preoperative neurosurgical mapping of motor cortex and language in a clinical setting. J Comput Assist Tomogr. 2000;24(6):927–34. doi: 10.1097/00004728-200011000-00020. [DOI] [PubMed] [Google Scholar]
- 92.Inoue T, Shimizu H, Nakasato N, Kumabe T, Yoshimoto T. Accuracy and limitation of functional magnetic resonance imaging for identification of the central sulcus: comparison with magnetoencephalography in patients with brain tumors. Neuroimage. 1999;10(6):738–48. doi: 10.1006/nimg.1999.0501. [DOI] [PubMed] [Google Scholar]
- 93.Lee CC, Ward HA, Sharbrough FW, Meye FB, Marsh WR, Raffel C, et al. Assessment of functional MR imaging in neurosurgical planning. AJNR Am J Neuroradiol. 1999;20(8):1511–9. [PMC free article] [PubMed] [Google Scholar]
- 94.Korvenoja A, Kirveskari E, Aronen HJ, Avikainen S, Brander A, Huttunen J, et al. Sensorimotor cortex localization: Comparison of magnetoencephalography, functional MR imaging, and intraoperative cortical mapping. Radiology. 2006;241(1):213–22. doi: 10.1148/radiol.2411050796. [DOI] [PubMed] [Google Scholar]
- 95.Schiffbauer H, Berger MS, Ferrari P, Freudenstein D, Rowley HA, Roberts TPL. Preoperative magnetic source imaging for brain tumor surgery: a quantitative comparison with intraoperative sensory and motor mapping. Neurosurg Focus. 2003;15(1):E7. doi: 10.3171/foc.2003.15.1.7. [DOI] [PubMed] [Google Scholar]
- 96.Krishnan R, Raabe A, Hattingen E, Szelenyi A, Yahya H, Hermann E, et al. Functional magnetic resonance imaging-integrated neuronavigation: correlation between lesion-to-motor cortex distance and outcome. Neurosurgery. 2004;55(4):904–15. doi: 10.1227/01.neu.0000137331.35014.5c. [DOI] [PubMed] [Google Scholar]
- 97.Grummich P, Nimsky C, Pauli E, Buchfelder M, Ganslandt O. Combining fMRI and MEG increases the reliability of presurgical language localization: a clinical study on the difference between and congruence of both modalities. Neuroimage. 2006;32(4):1793–803. doi: 10.1016/j.neuroimage.2006.05.034. [DOI] [PubMed] [Google Scholar]
- 98.Ganslandt O, Buchfelder M, Hastreiter P, Grummich P, Fahlbusch R, Nimsky C. Magnetic source imaging supports clinical decision making in glioma patients. Clin Neurol Neurosurg. 2004;107(1):20–6. doi: 10.1016/j.clineuro.2004.02.027. [DOI] [PubMed] [Google Scholar]
- 99.Schiller Y, Cascino GD, Sharbrough FW. Chronic intracranial EEG monitoring for localizing the epileptogenic zone: an electroclinical correlation. Epilepsia. 1998;39(12):1302–8. doi: 10.1111/j.1528-1157.1998.tb01328.x. [DOI] [PubMed] [Google Scholar]
- 100.Mamelak AN, Lopez N, Akhtari M, Sutherling WW. Magnetoencephalography-directed surgery in patients with neocortical epilepsy. J Neurosurg. 2002;97(4):865–73. doi: 10.3171/jns.2002.97.4.0865. [DOI] [PubMed] [Google Scholar]
- 101.Wheless JW, Willmore LJ, Breier JI, Kataki M, Smith JR, King DW, et al. A comparison of magnetoencephalography, MRI, and V-EEG in patients evaluated for epilepsy surgery. Epilepsia. 1999;40(7):931–41. doi: 10.1111/j.1528-1157.1999.tb00800.x. [DOI] [PubMed] [Google Scholar]
- 102.Gallen CC, Tecoma E, Iragui V, Sobel DF, Schwartz BJ, Bloom FE. Magnetic source imaging of abnormal low-frequency magnetic activity in presurgical evaluations of epilepsy. Epilepsia. 1997;38(4):452–60. doi: 10.1111/j.1528-1157.1997.tb01735.x. [DOI] [PubMed] [Google Scholar]
- 103.Wennberg R. Magnetic source imaging versus intracranial electroencephalogram: neocortical versus temporolimbic epilepsy surgery. Ann Neurol. 2006;60(2):271. doi: 10.1002/ana.20924. [DOI] [PubMed] [Google Scholar]
- 104.Schevon C, Cappell J, Emerson RG. Magnetoencephalography is not a substitute for intracranial electroencephalography. Ann Neurol. 2006;60(2):270. doi: 10.1002/ana.20925. [DOI] [PubMed] [Google Scholar]
- 105.Engel J Jr, Van Ness P, Rasmussen TB, Ojemann LM. Engel J Jr., editor. Outcome with respect to epileptic seizures. New York: Raven Press. 1993. pp. 609–621.
- 106.Wieser HG, Blume WT, Fish D, Goldensohn E, Hufnagal A, King D, et al. ILAE Commission Report. Epilepsia. 2001;42(2):282–6. Proposal for a new classification of outcome with respect to epileptic seizures following epilepsy surgery. [PubMed] [Google Scholar]
- 107.Breier JI, Simos PG, Wheless JW, Constantinou JE, Baumgartner JE, Venkataraman V, et al. Language dominance in children as determined by magnetic source imaging and the intracarotid amobarbital procedure: a comparison. J Child Neurol. 2001;16(2):124–30. doi: 10.1177/088307380101600211. [DOI] [PubMed] [Google Scholar]
- 108.Makela JP, Kirveskari E, Seppa M, Hamalainen M, Forss N, Avikainen S, et al. Three-dimensional integration of brain anatomy and function to facilitate intraoperative navigation around the sensorimotor strip. Hum Brain Mapp. 2001;12(3):180–92. doi: 10.1002/1097-0193(200103)12:3<180::AID-HBM1014>3.0.CO;2-N. [DOI] [PMC free article] [PubMed] [Google Scholar]
- 109.Roberts TP, Ferrari P, Perry D, Rowley HA, Berger MS. Presurgical mapping with magnetic source imaging: comparisons with intraoperative findings. Brain Tumor Pathol. 2000;17(2):57–64. doi: 10.1007/BF02482736. [DOI] [PubMed] [Google Scholar]
- 110.Breier JI, Simos PG, Zouridakis G, Wheless JW, Willmore LJ, Constantinou JE, et al. Language dominance determined by magnetic source imaging: a comparison with the Wada procedure. Neurology. 1999;53(5):938–45. doi: 10.1212/wnl.53.5.938. [DOI] [PubMed] [Google Scholar]
- 111.Ganslandt O, Fahlbusch R, Nimsky C, Kober H, Moller M, Steinmeier R, et al. Functional neuronavigation with magnetoencephalography: outcome in 50 patients with lesions around the motor cortex. J Neurosurg. 1999;91(1):73–9. doi: 10.3171/jns.1999.91.1.0073. [DOI] [PubMed] [Google Scholar]
- 112.Minassian BA, Otsubo H, Weiss S, Elliott I, Rutka JT, Snead OC, III. Magnetoencephalographic localization in pediatric epilepsy surgery: comparison with invasive intracranial electroencephalography. Ann Neurol. 1999;46(4):627–33. doi: 10.1002/1531-8249(199910)46:4<627::aid-ana11>3.0.co;2-c. [DOI] [PubMed] [Google Scholar]
- 113.Simos PG, Papanicolaou AC, Breier JI, Wheless JW, Constantinou JE, Gormley WB, et al. Localization of language-specific cortex by using magnetic source imaging and electrical stimulation mapping. J Neurosurg. 1999;91(5):787–96. doi: 10.3171/jns.1999.91.5.0787. [DOI] [PubMed] [Google Scholar]
- 114.Ganslandt O, Ulbricht D, Kober H, Vieth J, Strauss C, Fahlbusch R. SEF-MEG localization of somatosensory cortex as a method for presurgical assessment of functional brain area. Electroencephalogr Clin Neurophysiol Suppl. 1996;46:209–13. [PubMed] [Google Scholar]
- 115.Roberts TP, Zusman E, McDermott M, Barbaro N, Rowley HA. Correlation of functional magnetic source imaging with intraoperative cortical stimulation in neurosurgical patients. J Image Guid Surg. 1995;1(6):339–47. doi: 10.1002/(SICI)1522-712X(1995)1:6<339::AID-IGS5>3.0.CO;2-B. [DOI] [PubMed] [Google Scholar]
- 116.Eckert T, Eidelberg D. The role of functional neuroimaging in the differential diagnosis of idiopathic Parkinson's disease and multiple system atrophy. Clin Auton Res. 2004;14(2):84–91. doi: 10.1007/s10286-004-0167-1. [DOI] [PubMed] [Google Scholar]
- 117.Watanabe H, Fukatsu H, Katsuno M, Sugiura M, Hamada K, Okada Y, et al. Multiple regional 1H-MR spectroscopy in multiple system atrophy: NAA/Cr reduction in pontine base as a valuable diagnostic marker. J Neurol Neurosurg Psychiatry. 2004;75(1):103–9. [PMC free article] [PubMed] [Google Scholar]
- 118.Atkins D, Best D, Briss PA, Eccles M, Falck-Ytter Y, Flottorp S, et al. Grading quality of evidence and strength of recommendations. BMJ. 2004;328(7454):1490. doi: 10.1136/bmj.328.7454.1490. [DOI] [PMC free article] [PubMed] [Google Scholar]
- 119.AETNA. Clinical policy bulletin: magnetic source imaging/magnetoencephalography [Internet]. 0279. [[cited 2006 Oct 27]]. Hartford, CT: Aetna Inc.; 2006. Available from: www.aetna.com/cpb/data/CPBA0279.html .
- 120.Centers for Medicare and Medicaid Services. NCD for PET scans (220.6). Publication no. 100-3 [Internet] [[updated 2005; cited 2006 Nov 3]]. Baltimore, MD: Centers for Medicare & Medicaid Services. Available from: http://www.cms.hhs.gov/mcd/viewncd.asp?ncd_id=220.6&ncd_version=3&basket=ncd%3 .
- 121.Hastings J, Adams EJ. Joint project of the International Network of Agencies for Health Technology Assessment--part 1: survey results on diffusion, assessment, and clinical use of positron emission tomography. Int J Technol Assess Health Care. 2006;22(2):143–8. doi: 10.1017/S026646230605094X. [DOI] [PubMed] [Google Scholar]
- 122.Siegel AM. Presurgical evaluation and surgical treatment of medically refractory epilepsy. Neurosurg Rev. 2004;27(1):1–18. doi: 10.1007/s10143-003-0305-6. [DOI] [PubMed] [Google Scholar]
- 123.Tepper J, Jaigobin C, Wang C. Health human resources for neurosurgical services in Ontario. ICES investigative report [Internet] [[cited 2006 Sep 15]]. Toronto: Institute for Clinical Evaluative Sciences (ICES); 2005. Available from: http://www.ices.on.ca/file/HHR_Neurosurgical_Services_Final2.pdf .
- 124.Statistics Canada. Population by sex and age group, by province and territory [Internet] [[updated 2006; cited 2007 Jan 15]]. Ottawa, ON: Statistics Canada. Available from: http://www40.statcan.ca/l01/cst01/demo31a.htm .
- 125.Burneo JG, Prasad AN, Corbett B, Sang X. Prevalence of childhood epilepsy in Canada. Epilepsia Forthcoming. 2006. [DOI] [PubMed]