

Abstract
OBJECTIVE
To evaluate the effects of qualitative dietary changes and the interaction with aerobic exercise training on liver fat content independent of weight loss in patients with type 2 diabetes.
RESEARCH DESIGN AND METHODS
With use of a factorial 2 × 2 randomized parallel-group design, 37 men and 8 women, aged 35–70 years, with type 2 diabetes in satisfactory blood glucose control on diet or diet plus metformin treatment were assigned to one of the following groups for an 8-week period: 1) high-carbohydrate/high-fiber/low–glycemic index diet (CHO/fiber group), 2) high-MUFA diet (MUFA group), 3) high-carbohydrate/high-fiber/low–glycemic index diet plus physical activity program (CHO/fiber+Ex group), and 4) high-MUFA diet plus physical activity program (MUFA+Ex group). Before and after intervention, hepatic fat content was measured by 1H NMR.
RESULTS
Dietary compliance was optimal and body weight remained stable in all groups. Liver fat content decreased more in MUFA (−29%) and MUFA+Ex (−25%) groups than in CHO/fiber (−4%) and CHO/fiber+Ex groups (−6%). Two-way repeated-measures ANOVA, including baseline values as covariate, showed a significant effect on liver fat content for diet (P = 0.006), with no effects for exercise training (P = 0.789) or diet-exercise interaction (P = 0.712).
CONCLUSIONS
An isocaloric diet enriched in MUFA compared with a diet higher in carbohydrate and fiber was associated with a clinically relevant reduction of hepatic fat content in type 2 diabetic patients independent of an aerobic training program and should be considered for the nutritional management of hepatic steatosis in people with type 2 diabetes.
Type 2 diabetes is independently associated with nonalcoholic fatty liver disease (NAFLD) (1,2), a clinical condition potentially evolving into end-stage liver disease (3) and now recognized as an independent cardiovascular risk factor (4). Although the causal relationship between type 2 diabetes and NAFLD is not clear, fatty liver and type 2 diabetes likely share pathophysiological mechanisms (5–7). Therefore, nonpharmacological interventions—diet and physical activity—that improve blood glucose control and other metabolic abnormalities associated with type 2 diabetes (8,9) also might be effective in reducing liver fat.
Low-calorie weight-loss diets reduce liver fat content (10,11). In the absence of weight loss, the only published study exploring the effects on fatty liver of macronutrient composition demonstrated that a high-fat diet promoted liver fat deposition in obese individuals compared with a high-carbohydrate diet (12).
Concerning the role of different types of fat, observational data indicate that people with NAFLD have a higher intake of saturated fatty acids and a lower consumption of n-3 fatty acids (13). Although high monounsaturated fatty acid (MUFA) diets are a current option for diabetic patients because of their positive effects on glycemic control and LDL cholesterol levels (14), no studies have evaluated their effects on hepatic fat content.
A cross-sectional analysis in a population of healthy people from northern Italy evaluated the impact of carbohydrate quality on liver fat content, showing a direct relationship between glycemic index of foods and degree of hepatic steatosis (15). Since carbohydrates with low glycemic index ameliorate plasma lipid profile, blood glucose control, and insulin sensitivity, it might be hypothesized that, beyond the quantity, the quality of carbohydrates may play a role in liver fat accumulation (16).
Physical activity alone or in association with caloric restriction in the presence of weight loss is effective in reducing hepatic lipid content in diabetic subjects (17). Beneficial effects of physical activity on fat liver content have also been shown independently of changes in body weight by two recent interventional studies evaluating the effects of aerobic training in obese individuals (18) and resistance training in a heterogeneous group of people with clinical evidence of NAFLD (19). No data are available in individuals with type 2 diabetes. Moreover, no study has investigated the effects of the interaction of physical activity with qualitative dietary changes independent of weight loss.
Therefore, the aims of this controlled randomized trial were to compare in patients with type 2 diabetes the effects on liver fat content of two dietary approaches generally recommended in patients with type 2 diabetes; these were 8-week isoenergetic diets relatively rich in carbohydrates and fiber and with a low glycemic index versus rich in monounsaturated fat. This study also evaluated the effects on liver fat content of the addition to these diets of a structured supervised light program of aerobic physical exercise.
RESEARCH DESIGN AND METHODS
A total of 45 participants (37 men and 8 postmenopausal women) with type 2 diabetes were recruited at the diabetes outpatient clinic at the Department of Internal Medicine of the University Medical School Hospital and were enrolled in the study after giving their written informed consent. Patients were overweight or obese, without body weight changes over the previous 6 months, and in satisfactory blood glucose control with diet or metformin plus diet treatment, had normal fasting plasma triglyceride and cholesterol levels, and were not taking any lipid-lowering drugs. Subjects had no evidence of A, B, or C virus or autoimmune hepatitis; clinical signs or symptoms of inborn errors of metabolism; history of toxins or drugs known to induce hepatitis; or history or symptoms of any known disease, apart from diabetes. Their alcohol consumption was <20 g/day. They were not vegetarians or engaged in intensive physical activity. Of the 45 participants enrolled, 4 (1 in each group) dropped out before the final examination as they moved to other cities or could no longer accomplish their working routine. Moreover, in spite of their initial consent, five subjects refused proton nuclear magnetic resonance (1H NMR) spectroscopy examination because of claustrophobia. Data in this article are from the 36 participants who underwent hepatic fat measurement. The study protocol was approved by the Federico II University Ethics Committee.
Sample size
In order to detect a 30% difference in liver fat content between treatments with a 80% power at 5% significance level, 40 patients had to be studied. The expected changes in liver fat content after treatment correspond to the differences observed between obese patients with or without type 2 diabetes in a previous study (1).
Study design
The intervention was preceded by a run-in period of 3 weeks during which participants were stabilized on a diet with a composition similar to the one usually followed, only providing that saturated fatty acids were at least 13% (carbohydrate 48%, total fat 33%, saturated fat 13%, and protein 18% of total energy intake). With use of a factorial 2 × 2 randomized parallel-group design, the participants were randomly assigned to one of the following intervention groups for an 8-week period: 1) high-carbohydrate/high-fiber/low–glycemic index diet (CHO/fiber group), 2) high-MUFA diet (MUFA group), 3) high-carbohydrate/high-fiber/low–glycemic index diet plus physical activity program (CHO/fiber+Ex group), and 4) high-MUFA diet plus physical activity program (MUFA+Ex group). The allocation to the intervention, stratified for BMI, age, sex, and diabetes therapy (only diet or metformin), was randomly performed by a minimization method using MINIM software (www.users.york.ac.uk). The experimental diets were isoenergetic in order to keep body weight constant and differed in macronutrient composition: carbohydrate 52 vs. 40%, fiber 28 vs. 10 g/1,000 kcal, glycemic index (bread reference) 60 vs. 95%, fat 30 vs. 42%, and MUFA 16 vs. 28% for CHO/fiber diet and MUFA diet, respectively. The other components including the saturated fat (7%), protein (18%) and polyunsaturated fatty acid (PUFA) (4%) were similar in the two diets. The dietary macronutrient composition was drawn by the tables of food composition from the Italian National Research Institute for Food and Nutrition (20). For improvement of dietary compliance, patients were seen weekly by an experienced dietitian, who made telephone calls every 2–3 days to ensure that they followed the assigned diet. Moreover, some foods—olive oil for MUFA diet and stick bran for CHO/fiber diet—were provided to the participants. Adherence to the dietary treatments was evaluated by a 4-day food record (two weekend and two working days) completed by the participants every second week.
The structured supervised exercise program was performed at the Cardiac Rehabilitation Centre of the Department of Clinical Medicine, Cardiovascular and Immunological Sciences. Participants exercised on treadmill or cycle ergometer two times per week for 45 min at an intensity corresponding to 70% of their baseline peak Vo2; the session also included warm-up and cool-down periods. Only the participants assigned to the exercise program received information about the benefits of physical activity and a motivational counseling. At baseline and at the end of the study, all patients underwent a cardiopulmonary stress test. Every second week, a validated questionnaire (7-Day Physical Activity Recall) (21) was administered to all participants to quantify their weekly moderate/vigorous physical activity apart from the structured training program.
Experimental procedures and anthropometrics
All evaluations were performed before and after the 8-week intervention periods by personnel blinded to the assignment. Body weight, height, and waist circumference were measured in the fasting state according to standardized procedures.
Liver fat
Liver fat content was measured by proton magnetic resonance spectroscopy (1H MRS) performed on a 1.5T MR scanner (Intera; Philips Medical Systems, Best, the Netherlands) equipped for proton spectroscopy acquisitions in the afternoon 8 h after a light morning breakfast. Sagittal, coronal, and axial slices covering the whole liver were preliminarily taken to position the spectroscopy acquisition voxel. A single voxel of 8 cc (2 × 2 × 2 cm) was placed within the right lobe avoiding major blood vessels, intrahepatic bile ducts, and subcutaneous fat tissue. The proton spectrum was acquired using an eight-channel phased array body coil after shimming over the volume of interest using an unsuppressed water PRESS sequence with the following parameters: repetition time 1,200 ms; echo time, 40 ms; 512 data points over 2,500 KHz spectral width, 12 acquisitions. Total spectra acquisition time was 16 s and thus acquired in breath hold to avoid movement artifacts and spectra broadening. Spectra were analyzed using LCModel software (version 6.2-1; http://s-provench-er.com) that fits in vivo metabolite spectra using model resonances acquired under comparable scanning conditions from multiple compounds in standard phantom solutions (22). Concentration values in arbitrary units of water peak (signal of water) and the sum of lipid peak at 1.3, 0.9, and 1.6 ppm (signal of fat) were considered for fat liver quantification, including both methyl and methylene groups of triglyceride molecule. Signal decay was corrected for the different T2 decay of water and fat using mean T2 relaxation times of 50 and 60 ms for water and fat, respectively. Hepatic fat percentage was calculated using the following formula: 100 · Sf ⁄ (Sf + Sw) (23), where Sf is signal of fat and Sw is signal of water. These values represent a relative quantity of water and fat in the volume of interest. To convert these values into absolute concentrations (weight per volume) expressed as percent fat, equations validated by Longo et al. (24) were applied.
Cardiopulmonary exercise test
All patients underwent cardiopulmonary exercise stress testing on a bicycle ergometer by a ramp protocol of 20 W/min in the afternoon 8 h after a light morning breakfast. The pedaling was kept constant at 55–65 revolutions per minute. Respiratory gas exchange measurements were obtained breath by breath with use of a computerized metabolic cart (Vmax 29C; Sensormedics, Yorba Linda, CA). The ventilation (VE) versus Vco2 relationship was measured by plotting VE against Vco2 obtained every 10 s of exercise (VE/Vco2 slope): both VE and Vco2 were measured in liters per minute. The VE/Vco2 slope was calculated as a linear regression function, excluding the nonlinear part of the relationship after the onset of acidotic drive to ventilation.
Fasting plasma metabolites
Total cholesterol, triglyceride, and glucose concentrations were assayed in plasma by enzymatic methods (Roche Molecular Biochemicals, Mannheim, Germany) on an autoanalyzer (Cobas Mira; ABX Diagnostics, Montpellier, France). LDLs were isolated by preparative sequential ultracentrifugation from the 1,006 density bottom for difference from precipitated HDL (25). Serum alanine aminotransferase (ALT) and aspartate aminotransferase (AST) activities were determined by colorimetric methods according to the International Federation of Clinical Chemistry recommendations. Plasma insulin concentrations were measured by Enzyme Amplified Sensitivity Immuno Assay (Dia-Source, Nivelles, Belgium). Homeostasis model assessment of insulin resistance (HOMA-IR) was calculated using the following formula: fasting glucose (mg/dL) × fasting insulin (µU/mL)/405.
Statistical analysis
Data are expressed as means ± SD unless otherwise stated. Differences between the four groups at baseline were tested by one-way ANOVA and post hoc analysis with Bonferroni correction for multiple comparisons. The effects of the four interventions were evaluated by two-way repeated-measures ANOVA. Baseline and after-treatment values were included as levels of within-subjects factor (time) and type of diet and presence/absence of physical activity program as between-subjects factors.
Changes in liver fat content were also evaluated as percent changes [(final values − baseline values)/baseline values × 100] in a general linear model taking the change in liver fat as dependent variable, type of diet and presence/absence of physical activity program as fixed factors, and baseline value of liver fat as covariate. A P value <0.05 was considered significant. The statistical analysis was performed according to standard methods using the SPSS software (SPSS/PC; SPSS, Chicago, IL).
RESULTS
As shown in Table 1, the participants allocated to the four intervention groups were comparable for age, BMI, diabetes treatment, fasting plasma glucose concentrations, and HbA1c levels.
Table 1.
Baseline characteristics of the type 2 diabetic subjects participating in the study

Compliance with dietary intervention
The two diets followed by the patients were, as expected, significantly different for total fat, MUFA, carbohydrate, fiber, glycemic index, and glycemic load (Table 2). The MUFA diet was richer in vitamin E, while the CHO/fiber diet was richer in polyphenols and had a higher oxygen radical absorbance capacity (ORAC) than the MUFA diet (Table 2). Both diets were well accepted by the patients. Participants allocated to CHO/fiber diet were considered compliant with the treatment if carbohydrate intake was at least 50% of total energy, glycemic index <64%, and daily fiber intake at least 40 g; participants allocated to MUFA diet were considered compliant if carbohydrate intake was <45% of total energy, glycemic index was >86%, and MUFA proportion was at least 25% of total energy. All subjects allocated to MUFA diet satisfied the adherence criteria. One patient allocated to CHO/fiber group was considered not compliant, since the glycemic index was higher than accepted (70%). This participant was excluded from the analysis of liver fat change. Body weight and waist circumference did not change significantly during intervention in the four groups (Table 3).
Table 2.
Dietary composition during the 8-week intervention in the four groups of subjects
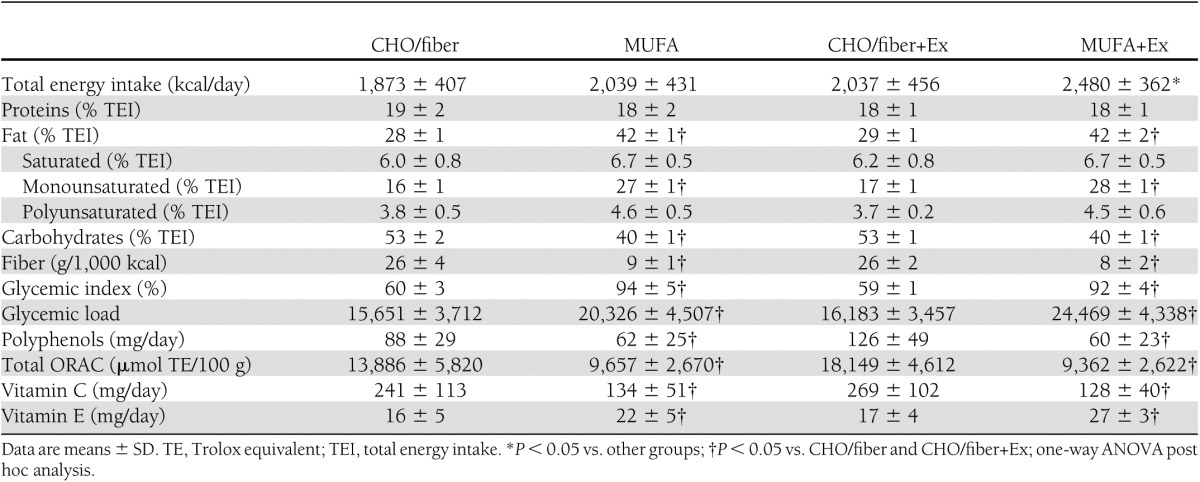
Table 3.
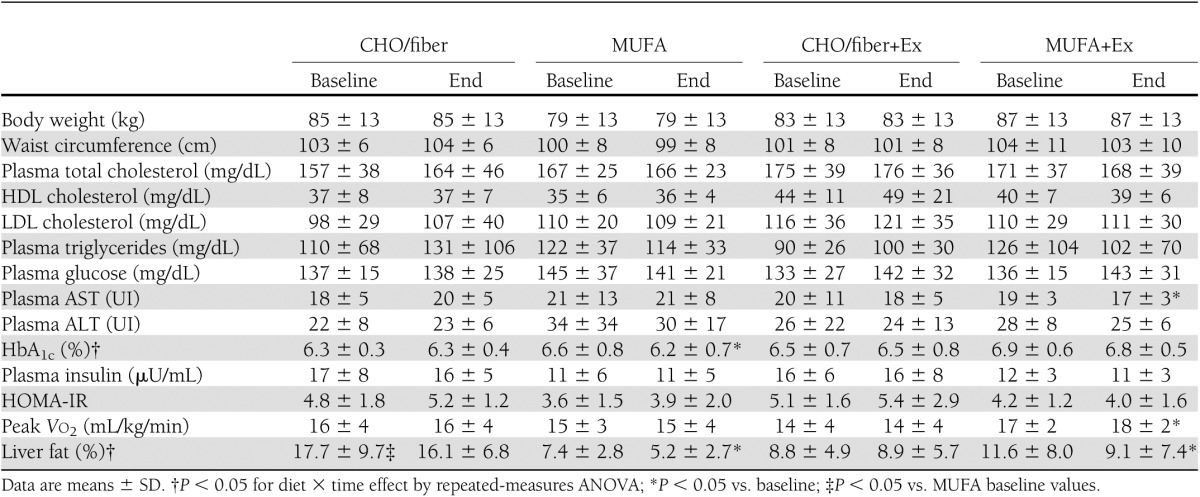
Anthropometrics, metabolic characteristics, aerobic capacity, and liver fat before and after the 8-week interventions in the four groups
Compliance with exercise training
Patients allocated to the exercise groups were considered compliant with the treatment if they attended at least 70% of prescribed training sessions. Because of employment schedule changes, two patients in the MUFA+Ex group and one in the CHO/fiber+Ex group did not satisfy compliance criteria. Results were similar by including or not including these three subjects, and therefore we report results on all participants. There were no differences between groups in moderate/vigorous weekly physical activity not including the supervised exercise program as measured by the 7-Day Physical Activity Recall questionnaire (CHO/fiber group 5.6 ± 3.8 kcal/kg/week, MUFA group 4.9 ± 3.9 kcal/kg/week, CHO/fiber+Ex group 6.5 ± 4.9 kcal/kg/week, and MUFA+Ex group 9.2 ± 10.9 kcal/kg/week; P = 0.541 by one-way ANOVA).
The training program induced a significant increase in Vo2 peak in the subjects allocated to MUFA+Ex group and not in those in the CHO/fiber+Ex group (Table 3). Results were not changed by excluding noncompliant participants (MUFA+Ex group 16.4 ± 1.8 vs.18.2 ± 2.2 mL/kg/min, P = 0.007, and CHO/fiber+Ex 13.7 ± 3.7 vs.13.9 ± 4.3 mL/kg/min, P = 0.762). So as to maintain stable weights during the intervention, the exercise groups were not required to increase their dietary caloric intake significantly more than the nonexercising groups (181 ± 287 vs. 372 ± 379 kcal/day; P = 0.080).
Fasting plasma glucose, lipids, liver enzymes, HbA1c, and insulin sensitivity
Fasting plasma glucose did not change at the end of the interventions in all groups. Fasting plasma concentrations of total, LDL, and HDL cholesterol and triglyceride did not change at the end of the interventions. At baseline, AST and ALT levels were not different among the four groups. AST levels decreased significantly after MUFA+Ex treatment, but this variation was not statistically significant from the changes in the other groups. Blood glucose control as shown by HbA1c levels significantly improved in the MUFA group while did not change in the other groups (P < 0.05 for diet effect by repeated-measures ANOVA). After intervention, HOMA-IR was not significantly different from baseline in all groups (Table 3).
Liver fat
Liver fat content measured by 1H NMR significantly decreased in the MUFA group (7.4 ± 2.8 vs. 5.2 ± 2.7%; P = 0.01) and MUFA+Ex group (11.6 ± 8.0 vs. 9.1 ± 7.4%; P = 0.02); it did not change significantly in the CHO/fiber group (17.7 ± 9.7 vs. 16 ± 6.8%; P = 0.295) or CHO/fiber+Ex group (8.8 ± 4.9 vs. 8.9 ± 5.7%; P = 0.794) (Table 3). Two-way repeated-measures ANOVA, including baseline values as covariate, showed a significant effect on liver fat content for diet (P = 0.006), with no effects for exercise training (P = 0.789) and diet-exercise interaction (P = 0.712) (Table 3). Measured as percent variations (end values − baseline values × 100/baseline values), hepatic fat was reduced by the MUFA diet with (−25%) or without (−29%) exercise significantly more than by CHO diet with (−6%) or without (−4%) exercise (P < 0.05 by ANOVA) (Fig. 1).
Figure 1.

Percent changes in liver fat content after the 8-week intervention in the four groups. Data are expressed as means ± SE; *P < 0.05 vs. CHO/fiber and CHO/fiber+Ex groups.
The effects of diet on liver fat content were still more evident combining the groups with the same diet (CHO/fiber and CHO/fiber+Ex vs. MUFA and MUFA+Ex). In the absence of baseline differences in hepatic fat content between the two groups, liver fat did not change significantly after CHO/fiber diet (13.1 ± 8.6 vs.12.3 ± 7.1%; P = 0.382), while it significantly decreased after MUFA diet (9.6 ± 6.3 vs. 7.2 ± 5.9%; P < 0.0001).
CONCLUSIONS
This is the first randomized intervention study evaluating the effects of qualitative dietary changes and their interaction with aerobic exercise on liver fat content in type 2 diabetic patients in the absence of weight loss. We evaluated the effects on liver fat of the two most recommended dietary approaches to diabetes, i.e., a relatively high-CHO/high-fiber/low–glycemic index diet and a high-MUFA diet with and without the association of a structured physical activity program. Hepatic fat content significantly decreased after the 8-week intervention with MUFA diet independently of exercise. This decrease was clinically relevant (−29%), indicating that qualitative isocaloric dietary modifications may positively influence fatty liver.
In the current study, the MUFA diet differed from the CHO/fiber diet for the high-fat content (40% of total energy) because of the high contribution of MUFA (28 vs. 16%). In the only published isocaloric dietary intervention on fatty liver in overweight nondiabetic women, a high-fat diet (56%) significantly increased the hepatic fat content compared with a low-fat/high-carbohydrate diet (12). The extreme increase in fat in that study was mainly due to saturated fatty acids. Taken together, the data suggest that both the quantity and the quality of dietary fat have a role in the treatment and possibly in the pathogenesis of fatty liver. Differential effects of the type of fatty acids on direct measures of liver fat content have been reported only in animal studies. In mice without fatty liver, an olive oil–rich diet increased hepatic triacylglycerol content compared with corn oil (26), while in a rat model of NAFLD, olive oil decreased the accumulation of triglyceride in the liver significantly more than fish oil and butter (27).
MUFAs may exert their beneficial effects on hepatic fat content through their influence on lipid metabolism in the liver or the abdominal adipose tissue. Since in the postprandial phase MUFAs are more rapidly oxidized than saturated fatty acids (28), a high-MUFA diet may avoid fat deposition in liver by the activation of catabolic pathways. In addition, MUFAs could favor fatty acid deposition in adipose tissue rather than in liver, enhancing the clearance of circulating triglyceride-rich lipoproteins by lipoprotein lipase. We demonstrated in a previous study (29) that a MUFA-rich diet stimulated the activity of lipoprotein lipase more than a saturated fat–rich diet. There is also evidence that MUFAs are preferentially taken up by adipose tissue and muscles because of their greater affinity for the fatty acid transporters (30). MUFAs may also improve hepatic steatosis by positively influencing adipose tissue cross-talk with liver metabolism through regulation of adipokines and inflammatory markers synthesis. In fact, in obese women hepatic fat content is associated with increased concentrations of ceramide and inflammatory mediators in subcutaneous adipose tissue (31). Moreover, in cultured cells, saturated fatty acids are preferentially stored as diacyglycerol and ceramides in contrast with MUFAs, which are, instead, preferentially incorporated into triacylglycerols (30). The effects of the MUFA diet did not seem to be mediated and/or lead to changes in insulin resistance, since no significant changes in homeostasis model assessment index were observed in our patients. However, this index is not a good marker of overall insulin resistance in patients with diabetes, and in addition, we had no measures of hepatic insulin sensitivity.
In this study, the MUFA diet had a higher content of vitamin E, which has been shown to induce a reduction in hepatic steatosis in obese nondiabetic patients (32), although it did not significantly modify histological features of NAFLD in obese children and adolescents (33). However, it is unlikely that in our study the antioxidant effects of vitamin E were responsible for the effects of the MUFA diet because of the much higher antioxidant capacity in the CHO/fiber diet that included higher ORAC levels and higher concentrations of polyphenols and vitamin C.
In our study, the high-fiber low–glycemic index diet did not increase liver fat content, while an increase in liver fat has been repeatedly associated with high-carbohydrate diets in previous studies using carbohydrates mainly consisting of fructose, simple sugars, or high–glycemic index foods (16). To date, only one study in mice has compared the effects of high– and low–glycemic index diets, showing that hepatic steatosis increased more with rapidly than slowly absorbed carbohydrates (34). This is in line with the fact that, although dietary carbohydrates may stimulate hepatic de novo lipogenesis leading to fasting hypertriglyceridemia and hepatic fat accumulation (35), the eucaloric substitution of dietary starch for sugar reduces hepatic lipogenesis (36). Therefore, carbohydrates with high and low glycemic index may differently influence hepatic fat deposition through a dissimilar influence on fatty acid synthetic pathways in the liver. The relationship between quality of ingested carbohydrates and fatty liver may also be mediated by changes in gut microbiota because of different modalities of intestinal absorption. Intestinal flora is related to obesity and metabolic diseases, and the microbial species hosted in our intestine may influence metabolite absorption and liver fat metabolism (37).
The effects on fatty liver observed in the current study were independent of the exercise training program. In fact, neither physical activity alone nor its interaction with diet influenced hepatic fat content. In the only intervention trial that explored the effects of aerobic physical activity, independent of weight loss, a 20% reduction in liver fat content was observed (18). Differing from our study, that trial was conducted in nondiabetic patients with a higher baseline exercise capacity (Vo2 peak ≈25 vs. 15 mL/kg/min in our study). A recent study evaluating the effects of exercise training on fructose-induced liver fat accumulation in rats showed that physical activity did not reduce hepatic fat content, although it beneficially modified the partitioning of lipids, providing more unsaturated fatty acids in liver (38). Because of these inconsistencies, more data are needed to elucidate the role of physical activity on liver fat content in type 2 diabetes. It should also be considered that, because of the cultural resistance and structural barriers to physical exercise common in this middle-age population of persons with type 2 diabetes as well as the need for supervised sessions that could be practically inserted in a clinical setting (work schedule, etc.), the physical exercise implemented in this study was of light/moderate intensity with a relatively low volume of exercise. Therefore, we cannot exclude that a more prolonged/vigorous exercise would have induced beneficial effects, also in light of the resistance to the beneficial effects of physical activity reported in type 2 diabetes (39), which could mainly concern the obese patients (40).
This study has some strengths and limitations. This was a randomized controlled trial with a rigorous follow-up of dietary adherence and direct supervision of physical exercise. Hepatic fat content was measured by the gold standard NMR spectroscopy. A limitation is that only patients in good metabolic control were studied, and therefore our results may not be extended to type 2 diabetic patients of other ethnic groups or with poorer control. Nevertheless, there are no indications that worse metabolic control could negatively influence the effects of MUFAs on hepatic fat content. In spite of randomization, one group (CHO/fiber) had a higher fat liver content at baseline, which was not associated with differences in any other variable known to influence liver fat content. Anyhow, this did not influence the results because analyses were corrected for baseline levels, and the significant decrease in liver fat was not observed in the group with higher baseline values.
In conclusion, this study demonstrates for the first time that qualitative dietary changes without weight loss can beneficially influence hepatic fat content in type 2 diabetic patients. These results are clinically relevant and have implications for the nutritional management of fatty liver in type 2 diabetes, suggesting that a MUFA-rich diet also enriched in fiber and with low–glycemic index should be preferred. Further studies are needed to elucidate the possible mechanisms of these dietary effects and to evaluate the effects of more intense and prolonged physical exercise on liver fat in type 2 diabetes.
Acknowledgments
The work presented here was supported by ETHERPATHS project (European Community contract no. FP7-KBBE-222639). L.B. received a research grant from the Italian Diabetes Society: “Borsa di studio annuale SID-AMD Pasquale Di Coste.”
No potential conflicts of interest relevant to this article were reported.
L.B. wrote the manuscript, designed the experiment, and collected and analyzed data. A.P. performed imaging studies. G.A. wrote the manuscript and designed the experiment. L.C. collected and analyzed data and provided dietary counseling. A.M. performed biochemical measurements. A.V. collected and analyzed data and supervised exercise training. R.M. collected and analyzed data. M.L. and M.M. performed imaging studies. C.V. designed the experiment and supervised exercise training. G.R. designed the experiment. A.A.R. wrote the manuscript and designed the experiment. A.A.R. is the guarantor of this work and, as such, had full access to all the data in the study and takes responsibility for the integrity of the data and the accuracy of the data analysis.
Parts of this study were presented at the 72nd Scientific Sessions of the American Diabetes Association, Philadelphia, Pennsylvania, 8–12 June 2012.
The authors are very grateful to the staff of the Department of Clinical and Experimental Medicine, Federico II University, in particular to Paola Cipriano for technical laboratory assistance; Angela Giacco, RD, Anna Rivieccio, RD, and Marisa Giorgini, RD, for dietary counseling; and Salvatore Turco, MD, and Ciro Iovine, MD, for patient recruitment.
Footnotes
Clinical trial reg. no. NCT01025856, clinicaltrials.gov.
References
- 1.Bozzetto L, Prinster A, Mancini M, et al. Liver fat in obesity: role of type 2 diabetes mellitus and adipose tissue distribution. Eur J Clin Invest 2011;41:39–44 [DOI] [PubMed] [Google Scholar]
- 2.Kotronen A, Juurinen L, Hakkarainen A, et al. Liver fat is increased in type 2 diabetic patients and underestimated by serum alanine aminotransferase compared with equally obese nondiabetic subjects. Diabetes Care 2008;31:165–169 [DOI] [PubMed] [Google Scholar]
- 3.Powell EE, Cooksley WG, Hanson R, Searle J, Halliday JW, Powell LW. The natural history of nonalcoholic steatohepatitis: a follow-up study of forty-two patients for up to 21 years. Hepatology 1990;11:74–80 [DOI] [PubMed] [Google Scholar]
- 4.Targher G, Bertolini L, Poli F, et al. Nonalcoholic fatty liver disease and risk of future cardiovascular events among type 2 diabetic patients. Diabetes 2005;54:3541–3546 [DOI] [PubMed] [Google Scholar]
- 5.Adiels M, Taskinen MR, Borén J. Fatty liver, insulin resistance, and dyslipidemia. Curr Diab Rep 2008;8:60–64 [DOI] [PubMed] [Google Scholar]
- 6.Kotronen A, Seppälä-Lindroos A, Bergholm R, Yki-Järvinen H. Tissue specificity of insulin resistance in humans: fat in the liver rather than muscle is associated with features of the metabolic syndrome. Diabetologia 2008;51:130–138 [DOI] [PubMed] [Google Scholar]
- 7.Kelley DE, Kuller LH, McKolanis TM, Harper P, Mancino J, Kalhan S. Effects of moderate weight loss and orlistat on insulin resistance, regional adiposity, and fatty acids in type 2 diabetes. Diabetes Care 2004;27:33–40 [DOI] [PubMed] [Google Scholar]
- 8.Bantle JP, Wylie-Rosett J, Albright AL, et al. American Diabetes Association Nutrition recommendations and interventions for diabetes: a position statement of the American Diabetes Association. Diabetes Care 2008;31(Suppl 1):S61–S78 [DOI] [PubMed] [Google Scholar]
- 9.Marwick TH, Hordern MD, Miller T, et al. Council on Clinical Cardiology, American Heart Association Exercise, Cardiac Rehabilitation, and Prevention Committee. Council on Cardiovascular Disease in the Young. Council on Cardiovascular Nursing. Council on Nutrition, Physical Activity, and Metabolism. Interdisciplinary Council on Quality of Care and Outcomes Research Exercise training for type 2 diabetes mellitus: impact on cardiovascular risk: a scientific statement from the American Heart Association. Circulation 2009;119:3244–3262 [DOI] [PubMed] [Google Scholar]
- 10.Vitola BE, Deivanayagam S, Stein RI, et al. Weight loss reduces liver fat and improves hepatic and skeletal muscle insulin sensitivity in obese adolescents. Obesity (Silver Spring) 2009;17:1744–1748 [DOI] [PMC free article] [PubMed] [Google Scholar]
- 11.Huang MA, Greenson JK, Chao C, et al. One-year intense nutritional counseling results in histological improvement in patients with non-alcoholic steatohepatitis: a pilot study. Am J Gastroenterol 2005;100:1072–1081 [DOI] [PubMed] [Google Scholar]
- 12.Westerbacka J, Lammi K, Häkkinen AM, et al. Dietary fat content modifies liver fat in overweight nondiabetic subjects. J Clin Endocrinol Metab 2005;90:2804–2809 [DOI] [PubMed] [Google Scholar]
- 13.Allard JP, Aghdassi E, Mohammed S, et al. Nutritional assessment and hepatic fatty acid composition in non-alcoholic fatty liver disease (NAFLD): a cross-sectional study. J Hepatol 2008;48:300–307 [DOI] [PubMed] [Google Scholar]
- 14.Gerhard GT, Ahmann A, Meeuws K, McMurry MP, Duell PB, Connor WE. Effects of a low-fat diet compared with those of a high-monounsaturated fat diet on body weight, plasma lipids and lipoproteins, and glycemic control in type 2 diabetes. Am J Clin Nutr 2004;80:668–673 [DOI] [PubMed] [Google Scholar]
- 15.Valtueña S, Pellegrini N, Ardigò D, et al. Dietary glycemic index and liver steatosis. Am J Clin Nutr 2006;84:136–142; quiz 268–269 [DOI] [PubMed] [Google Scholar]
- 16.Zelber-Sagi S, Ratziu V, Oren R. Nutrition and physical activity in NAFLD: an overview of the epidemiological evidence. World J Gastroenterol 2011;17:3377–3389 [DOI] [PMC free article] [PubMed] [Google Scholar]
- 17.Tamura Y, Tanaka Y, Sato F, et al. Effects of diet and exercise on muscle and liver intracellular lipid contents and insulin sensitivity in type 2 diabetic patients. J Clin Endocrinol Metab 2005;90:3191–3196 [DOI] [PubMed] [Google Scholar]
- 18.Johnson NA, Sachinwalla T, Walton DW, et al. Aerobic exercise training reduces hepatic and visceral lipids in obese individuals without weight loss. Hepatology 2009;50:1105–1112 [DOI] [PubMed] [Google Scholar]
- 19.Hallsworth K, Fattakhova G, Hollingsworth KG, et al. Resistance exercise reduces liver fat and its mediators in non-alcoholic fatty liver disease independent of weight loss. Gut 2011;60:1278–1283 [DOI] [PMC free article] [PubMed] [Google Scholar]
- 20.Carnovale E, Marletta L, Miuccio F. Tabelle di Composizione Degli Alimenti. Roma, Istituto Nazionale della Nutrizione, 1995 [Google Scholar]
- 21.Richardson MT, Ainsworth BE, Jacobs DR, Leon AS. Validation of the Stanford 7-day recall to assess habitual physical activity. Ann Epidemiol 2001;11:145–153 [DOI] [PubMed] [Google Scholar]
- 22.Provencher SW. Automatic quantitation of localized in vivo 1H spectra with LCModel. NMR Biomed 2001;14:260–264 [DOI] [PubMed] [Google Scholar]
- 23.Longo R, Pollesello P, Ricci C, et al. Proton MR spectroscopy in quantitative in vivo determination of fat content in human liver steatosis. J Magn Reson Imaging 1995;5:281–285 [DOI] [PubMed] [Google Scholar]
- 24.Longo R, Ricci C, Masutti F, et al. Fatty infiltration of the liver. Quantification by 1H localized magnetic resonance spectroscopy and comparison with computed tomography. Invest Radiol 1993;28:297–302 [PubMed] [Google Scholar]
- 25.Carlson K. Lipoprotein fractionation. J Clin Pathol Suppl (Assoc Clin Pathol) 1973;5:32–37 [DOI] [PMC free article] [PubMed] [Google Scholar]
- 26.Ferramosca A, Savy V, Zara V. Olive oil increases the hepatic triacylglycerol content in mice by a distinct influence on the synthesis and oxidation of fatty acids. Biosci Biotechnol Biochem 2008;72:62–69 [DOI] [PubMed] [Google Scholar]
- 27.Hussein O, Grosovski M, Lasri E, Svalb S, Ravid U, Assy N. Monounsaturated fat decreases hepatic lipid content in non-alcoholic fatty liver disease in rats. World J Gastroenterol 2007;13:361–368 [DOI] [PMC free article] [PubMed] [Google Scholar]
- 28.DeLany JP, Windhauser MM, Champagne CM, Bray GA. Differential oxidation of individual dietary fatty acids in humans. Am J Clin Nutr 2000;72:905–911 [DOI] [PubMed] [Google Scholar]
- 29.Rivellese AA, Giacco R, Annuzzi G, et al. Effects of monounsaturated vs. saturated fat on postprandial lipemia and adipose tissue lipases in type 2 diabetes. Clin Nutr 2008;27:133–141 [DOI] [PubMed] [Google Scholar]
- 30.Bessesen DH, Vensor SH, Jackman MR. Trafficking of dietary oleic, linolenic, and stearic acids in fasted or fed lean rats. Am J Physiol Endocrinol Metab 2000;278:E1124–E1132 [DOI] [PubMed] [Google Scholar]
- 31.Kolak M, Westerbacka J, Velagapudi VR, et al. Adipose tissue inflammation and increased ceramide content characterize subjects with high liver fat content independent of obesity. Diabetes 2007;56:1960–1968 [DOI] [PubMed] [Google Scholar]
- 32.Sanyal AJ, Chalasani N, Kowdley KV, et al. NASH CRN Pioglitazone, vitamin E, or placebo for nonalcoholic steatohepatitis. N Engl J Med 2010;362:1675–1685 [DOI] [PMC free article] [PubMed] [Google Scholar]
- 33.Lavine JE, Schwimmer JB, Van Natta ML, et al. Nonalcoholic Steatohepatitis Clinical Research Network Effect of vitamin E or metformin for treatment of nonalcoholic fatty liver disease in children and adolescents: the TONIC randomized controlled trial. JAMA 2011;305:1659–1668 [DOI] [PMC free article] [PubMed] [Google Scholar]
- 34.Scribner KB, Pawlak DB, Ludwig DS. Hepatic steatosis and increased adiposity in mice consuming rapidly vs. slowly absorbed carbohydrate. Obesity (Silver Spring) 2007;15:2190–2199 [DOI] [PubMed] [Google Scholar]
- 35.Parks EJ, Krauss RM, Christiansen MP, Neese RA, Hellerstein MK. Effects of a low-fat, high-carbohydrate diet on VLDL-triglyceride assembly, production, and clearance. J Clin Invest 1999;104:1087–1096 [DOI] [PMC free article] [PubMed] [Google Scholar]
- 36.Hudgins LC, Seidman CE, Diakun J, Hirsch J. Human fatty acid synthesis is reduced after the substitution of dietary starch for sugar. Am J Clin Nutr 1998;67:631–639 [DOI] [PubMed] [Google Scholar]
- 37.Musso G, Gambino R, Cassader M. Gut microbiota as a regulator of energy homeostasis and ectopic fat deposition: mechanisms and implications for metabolic disorders. Curr Opin Lipidol 2010;21:76–83 [DOI] [PubMed] [Google Scholar]
- 38.Yasari S, Prud’homme D, Tesson F, et al. Effects of exercise training on molecular markers of lipogenesis and lipid partitioning in fructose-induced liver fat accumulation. J Nutr Metab. 10 August 2011 [Epub ahead of print] [DOI] [PMC free article] [PubMed] [Google Scholar]
- 39.Burns N, Finucane FM, Hatunic M, et al. Early-onset type 2 diabetes in obese white subjects is characterised by a marked defect in beta cell insulin secretion, severe insulin resistance and a lack of response to aerobic exercise training. Diabetologia 2007;50:1500–1508 [DOI] [PubMed] [Google Scholar]
- 40.Poirier P, Tremblay A, Broderick T, Catellier C, Tancrède G, Nadeau A. Impact of moderate aerobic exercise training on insulin sensitivity in type 2 diabetic men treated with oral hypoglycemic agents: is insulin sensitivity enhanced only in nonobese subjects? Med Sci Monit 2002;8:CR59–CR65 [PubMed] [Google Scholar]