

Abstract
Genetically encoded FRET (Foerster resonance energy transfer) sensors are exciting tools in modern cell biology. Changes in the conformation of a sensor lead to an altered emission ratio and provide the means to determine both temporal and spatial changes in target molecules, as well as the activity of enzymes. FRET sensors are widely used to follow phosphorylation events and to monitor the effects of elevated calcium levels. Here, we report for the first time, to our knowledge, on the analysis of the conformational changes involved in sensor function at low resolution using a combination of in vitro and in cellulo FRET measurements and small-angle scattering of x rays (SAXS). The large and dynamic structural rearrangements involved in the modification of the calcium- and phosphorylation-sensitive probe CYNEX4 are comprehensively characterized. It is demonstrated that the synergistic use of SAXS and FRET methods allows one to resolve the ambiguities arising due to the rotation of the sensor molecules and the flexibility of the probe.
Introduction
Cellular localization of fluorescently labeled proteins (1) and, more important, analysis of metabolites and enzyme activities benefit from the development of intramolecular Foerster resonance energy transfer (FRET) probes (2–8), where the intramolecular interaction of a fluorescent donor-acceptor pair is altered after a reaction with a partner enzyme or binding to a target ligand. Intramolecular FRET probes in cellular or organismal localization experiments eliminate many technical problems associated with separate donor and acceptor tagged proteins (intermolecular FRET probes), the most significant of which is a requirement for similar levels of coexpression. Intramolecular FRET sensors designed to measure posttranslational modifications in a dynamic manner are now widely used (9–13). An example is CYNEX4 (14,15), a probe based on an annexin-A4 core and N-terminal domain, sensitive to phosphorylation and the presence of calcium. The sensor moiety is flanked by enhanced yellow fluorescent protein (EYFP) and enhanced cyan fluorescent protein (ECFP) at the N- and C-termini, respectively (Fig. 1 a). Although the elevation of the intracellular calcium concentration leads to polymerization of the probe at the plasma membrane and strong increases in FRET due to the tight packing of the fluorescent proteins (14), a significant decrease in FRET is observed when the sensor relocates from the membrane to the cytoplasm (15). This decrease is predicted to result from the known phosphorylation of the N-terminal annexin-A4 T9 (16). In this study, we focus on characterizing by small-angle x-ray scattering (SAXS) the conformational change of the CYNEX4 FRET probe after phosphorylation. The result will serve as a model for the analysis of conformational changes in intramolecular FRET probes in general and will permit an improvement to prediction in future probe development. Currently, these predictions are difficult, because although FRET-based biosensors rely on the nonradiative transfer of energy between an excited-state donor molecule and an acceptor (17), the efficiency of this decay process is dependent on the distance between the fluorescent donor-acceptor pair, as well as the orientation of their respective transition dipoles. The latter is very difficult to predict. It is important to note that when the donor-acceptor pair are not small-molecule dyes but 27-kDa fluorescent proteins, ambiguity regarding their position relative to the structure to which they are covalently attached prevents the accurate determination of a donor-acceptor distance by FRET alone. Progress has been made in predicting the effect of transition dipole orientation on the measured distances, and programs now exist that allow modeling of fluorescent-protein-based sensors and optimization of their construction (18). Direct observation of distance parameters in solution using an independent technique would validate these predictions, and SAXS (19–21) provides an excellent approach for the extraction of these parameters (22), in addition to providing methods for analyzing conformational flexibility and the oligomeric state and determining low-resolution three-dimensional structure.
Figure 1.
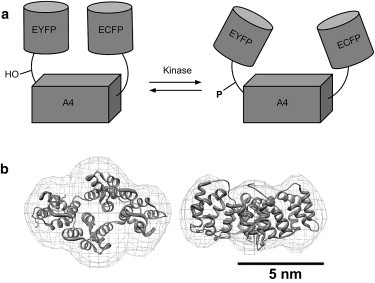
CYNEX4 biosensor construct designed for FRET based ratiometric imaging. (a) Left: A closed conformation of CYNEX4 with high efficiency of FRET between the donor (ECFP) and acceptor (EYFP) fluorophores. Right: Phosphorylation of the N-terminal Thr-9 (equivalent to Thr-266 in the full-length CYNEX4 construct) of Annexin-A4 leads to a decrease in the efficiency of FRET between the donor and acceptor. The observed decrease in the EYFP/ECFP emission ratio may result from an opening of the structure (an increased distance between fluorophores and/or reorientation of the transition dipoles of the CYNEX4 construct). (b) Overlay of the annexin-A4 SAXS bead model and crystal structure (PDB code 2ZOC). The annexin-A4 crystal structure is shown as a cartoon with the N-terminal domain shown in dark gray and the phosphorylation target, Thr-9 (Thr-266 in the CYNEX4 biosensor construct), and coordinated calcium ions shown as large and small spheres, respectively. The DAMMIF shape envelope is shown as a mesh surface. The structures on the right are rotated through 90° along the horizontal axis.
In the cellular environment, the CYNEX4 FRET sensor reports on intracellular calcium levels through an intermolecular change in FRET ratio and on the phosphorylation state of the N-terminal domain of annexin-A4 through an intramolecular change in FRET ratio (14,15). As the reponse to calcium also requires the presence of lipid and leads to an aggregation of the sensor via the annexin-A4 domain, study of this aspect of CYNEX4 using SAXS is complicated. In this article, the structural transition leading to an observed decrease in FRET ratio after conformational rearrangement upon phosphorylation of the sensor domain is examined using SAXS.
Materials and Methods
Cloning
The constructs for the mammalian expression of CYNEX4 have been described previously (14). The bacterial expression vector pASK-IBA7(+)-annexin-A4, encoding a Strep-tagged annexin-A4 fusion construct with a factor Xa cleavage site, was constructed by polymerase chain reaction (PCR) amplification of the annexin using the Eco31I restriction-enzyme sites and the primers forward 5′-TTT AAT GGT CTC AG CGC ATG GCC ATG GCA ACC AAA GGA GG-3′ and reverse 5′-CCC ACG GGT CTC CTA TCA TTA ATC ATC TCC TCC ACA GAG AAC-3′. The pPR-IBA2-EYFP-annexin-A4-ECFP bacterial vector was created in two steps. First, annexin-A4-ECFP was amplified by PCR from the pECFP-N1-annexin-A4 plasmid (construction described previously (14)) using the primers forward 5′-AAG CTT CGA ATT CTC GCC ACC ATG GCC ATG GCA ACC AAA GGA GGT-3′ and reverse 5′-GGT CCC CCT GCA GGT TTA CTT GTA CAG CTC GTC CAT GCC-3′. EcoRI and PstI restriction enzymes were used. Then, EYFP was amplified by PCR and inserted into the vector using BstBI and EcoRI restriction enzymes. The PCR primers used were forward 5′-CCG CAG TTC GAA AAA GGC GCC ATG GTG AGC AAG GGC GAG GAG CTG-3′ and reverse 5′-GTG GCG AGA ATT CGC TTG TAC AGC TCG TCCATG CCG AG-3′. The vector encoded a Strep-tag II-EYFP-annexin A4-ECFP fusion (Strep-tag II-CYNEX4). The T266D CYNEX4 constructs were created by site-directed mutagenesis (Stratagene, La Jolla, CA) of the CYNEX4 vector using the primers 5′-GGC AAC CAA AGG AGG TGA TGT CAA AGC TGC TTC-3′ and 5′-GAA GCA GCT TTG ACA TCA CCT CCT TTG GTT GCC-3′. The sequences of all constructs were verified by commercial sequencing (Eurofins, Galten, Denmark).
Protein expression and purification
All constructs were transformed into BL21(DE3) Escherichia coli cells for expression in Luria broth and either kanamycin (annexin-A4) or ampicillin (CYNEX4-wt and T266D) used for antibiotic selection. Cells were grown at 37°C until they reached an outer diameter (OD) of 600 nm ≈ 0.6, upon which the temperature was reduced to 15°C and protein expression induced with 0.5 μM anhydrotetracycline (annexin-A4) or 1 mM IPTG (CYNEX4-wt and T266D) overnight. Cells were harvested by centrifugation then stored at −20°C. Cells were lysed by sonication in 100 mM Tris-HCl, pH 8, 150 mM NaCl, and in the presence of 1 mM EGTA. Annexin-A4 was purified using streptactin affinity chromatography (IBA, Göttingen, Germany) followed by size-exclusion chromatography using Superdex-200 (Pharmacia, Peapack, NJ). CYNEX4-wt and T266D were purified using hydrophobic interaction chromatography on Phenyl-Sepharose (Pharmacia) followed by size-exclusion. All constructs were eluted from the size-exclusion column in 50 mM 4-(2-hydroxyethyl)-1-piperazineethanesulfonic acid (HEPES, Fluka, Sigma-Aldrich, St. Louis, MO), pH 7.5, 150 mM NaCl, and 1 mM EGTA and concentrated for SAXS using Vivaspin centrifugal concentrators (Sartorius, Göttingen, Germany).
Cell culture and transfection
Cell experiments were performed with HeLa Kyoto cells. The cells were passaged and maintained in Dulbecco's modified Eagle's medium (Gibco BRL, Gaithersburg, MD) supplemented with 10% FBS (Gibco) and 0.1 mg ml−1 primocin (Invivogen, San Diego, CA). Cells were plated in 35 mm MatTek chambers (MatTek, Ashland, MA) and transfected at ∼50% confluency with FuGENE 6 reagent (Roche, Basel, Switzerland). Transfections were performed in Opti-MEM (Gibco) according to the manufacturer's instructions. Cells were gently washed 20–24 h after transfection and incubated in imaging medium (20 mM HEPES, pH 7.4, 115 mM NaCl, 1.2 mM CaCl2, 1.2 mM MgCl2, 1.2 mM K2HPO4, and 2 gl−1 D-glucose) at 37°C with 5% CO2 for at least 15 min before imaging.
FRET experiments in cells
Images were acquired on a Leica TCS SP2 AOBS microscope (Leica Microsystems, Heidelberg, Germany) with an HCX PL APO lbd.BL 63.0 × 1.40 oil objective at 30°C. ECFP was excited with a 20-mW 405-nm diode laser. ECFP was sampled between 470 and 510 nm and EYFP between 520 and 540 nm (pinhole 2.62 airy, 4 lines averages). Background-subtracted EYFP and ECFP images were smoothed with a median filter and thresholded. EYFP images were then divided by ECFP images using ImageJ (http://rsb.info.nih.gov/ij/).
In vitro FRET experiments
In vitro FRET assays were conducted using an Infinite M1000 top class microplate reader with premium Quad4 Monochromator (TECAN). The assay buffer contained 50 mM HEPES, pH 7.5, 150 mM NaCl, and 0.1 mM EGTA (all from Fluka, St. Louis, MO). The experiments were run in the absence and presence of 10 mM CaCl2 (Fluka) and 0.5 μg proteinase-K (New England Biolabs, Ipswich, MA). For the experiment, we used 50 μl reaction buffer containing 1 μg CYNEX4 biosensor (CYNEX4-wt or T266D). Excitation wavelength was 430 nm and emission spectra were recorded from 450 nm to 600 nm with 2-nm step size. Ratios were calculated from the average values in the 474–484 nm range and the 520–530 nm range.
Theoretical calculation of FRET efficiency, E, the fraction of energy transferred between a donor-acceptor fluorescence pair, was determined using the function
| (1) |
where R0 is the Foerster distance (taken to be 4.9 nm for an EYFP/ECFP pair (23)) and R is the distance between the fluorophores.
SAXS data collection
Synchrotron radiation x-ray scattering data were collected on the X33 beamline of the EMBL (DESY, Hamburg, Germany) (24,25), using a 1M Pilatus pixel detector (Dectris, Baden, Switzerland) and eight frames of 15 s exposure time. Solutions of all constructs were measured at 10°C in 50 mM HEPES, pH 7.5, 150 mM NaCl, 1 mM EGTA at protein concentrations of 0.4–7.3 mg/ml (annexin-A4), 0.8–12.8 mg/ml (CYNEX4-wt), and 0.9–17.0 mg/ml (T266D). The sample-to-detector distance was 2.7 m, covering a range of momentum transfer of 0.08 ≤ s ≤ 5.0 nm−1 (s = 4π sinθ/λ, where 2θ is the scattering angle, and λ = 0.15 nm is the x-ray wavelength). Based on comparison of successive 15-s frames, no detectable radiation damage was observed. Data from the detectors were normalized to the transmitted beam intensity and averaged, and the scattering of buffer solutions was subtracted. The difference curves were scaled for solute concentration. All data manipulations were performed using the PRIMUS software package (26). The forward scattering I(0) and radius of gyration, Rg, were determined from Guinier analysis (21,27), assuming that at very small angles (s ≤ 1.3/Rg), the intensity is represented as I(s) = I(0)exp((sRg)2/3). These parameters were also estimated from the full scattering curves using the indirect Fourier transform method implemented in the program GNOM (28), along with the distance distribution function, p(r), and the maximum particle dimensions, Dmax. Molecular mass (MM) of solutes was estimated from SAXS data by comparing the extrapolated forward scattering with that of a reference solution of bovine serum albumin. Due to the uncertainty in MM estimation from SAXS data that results from uncertainty of the measured protein concentrations, an excluded volume of the solutes was also determined from the ab initio modeling program DAMMIF (29). This estimation is independent of protein concentration and can be obtained in an automated fashion with minimal user bias. For globular proteins, this hydrated particle volume in nm3 is around twofold the MM in kDa.
Fit of the annexin-A4 crystal structure to the SAXS data
The fit of the annexin-A4 crystal structure (PDB code 2ZOC) to the SAXS data was conducted using the program CRYSOL (30). CRYSOL calculates the partial scattering amplitudes of proteins from their atomic coordinates, taking into account the hydration layer and excluded solvent volume.
Analysis of flexibility
Analysis of the interdomain flexibility and size distribution of possible conformers, consistent with the measured scattering data for the CYNEX4 biosensor constructs, was conducted using the ensemble optimization method (EOM) (31). This method selects an ensemble of possible conformations from a pool of randomly generated models constructed from rigid domains linked by randomly generated flexible linkers. The program CRYSOL is used to calculate the theoretical scattering profiles of these models, and a genetic algorithm, GAJOE, is used to select an ensemble of conformations whose combined scattering profiles best fit the experimental data. For the input structures for analysis of the scattering data employing ensemble optimization, we used as rigid bodies the crystal structure of GFP (PDB code 1GFL) for both ECFP and EYFP, and the crystal structure of human annexin-A4 (PDB code 2Z0C). Linkers between the modules were represented as a flexible chain of dummy residues.
Ab initio shape determination and molecular modeling
Low-resolution shape envelopes for all constructs were determined using the ab initio bead-modeling program DAMMIF (29). DAMMIF represents the particle as a collection of M (≫1) densely packed beads inside an adaptable and loosely constrained search volume compatible with the experimentally determined Rg. Each bead is randomly assigned to solvent (index = 0) or solute (index = 1), and the particle structure in solution is described by a binary string of length M. Disconnected strings of beads are rejected and the scattering amplitudes calculated. Simulated annealing is then used to search for a compact model that minimizes the discrepancy,
| (2) |
where N is the number of experimental points, Iexp(sj), and Icalc(sj) are the experimental and calculated intensities, respectively, c is a scaling factor, and σ(sj) is the experimental error at the momentum transfer sj. The results of 10 independent DAMMIF reconstructions were compared using the alignment program SUPCOMB13 (32) to determine the most representative/typical model. Averaged DAMMIF models were also determined using the program DAMAVER (33), and these models were adjusted such that they agree with the excluded volume, experimentally determined using the program DAMFILT (33).
Molecular modeling was conducted using, as rigid bodies and where appropriate, the same structures as were used for EOM. Rigid-body models were generated for the CYNEX4 biosensor constructs using the program CORAL, an advanced version of the program BUNCH (34), where linkers/loops between the individual subunits are represented as random polypeptide chains. The results of 10 independent CORAL runs were analyzed using the programs SUPCOMB13 (32) and DAMAVER (33) to identify the most representative/typical models.
Results and Discussion
FRET analysis of CYNEX4
Phosphorylation of the annexin-A4 sensor domain in CYNEX4 leads to an observed decrease in the FRET ratio between donor and acceptor proteins (Fig. 2). As quantities of phosphorylated annexin-A4 and CYNEX4 sufficient for structural studies could not be produced, a mutant protein was used that has been shown to mimic the phosphorylated state (16). The decrease in FRET ratio between CYNEX4-wt and the phosphorylation mimic T266D was determined to be ∼19% (Fig. 2 b), strongly suggesting that a conformational rearrangement of the donor ECFP and acceptor EYFP domains occurred in cells. To confirm the results independent of the complex cellular environment, in vitro experiments were conducted to compare the FRET emission ratios of CYNEX-wt and T266D. These experiments again demonstrated that phosphorylation of CYNEX4 led to a decrease in the EYFP/ECFP emission ratio (Fig. 2, c and d) in both the absence and presence of calcium. The observed decrease in the emission ratio was ∼13%, consistent with the value observed in the cell FRET experiment. The addition of proteinase-K completely abolished FRET for CYNEX4, leaving exclusively a residual emission signal from the ECFP donor.
Figure 2.
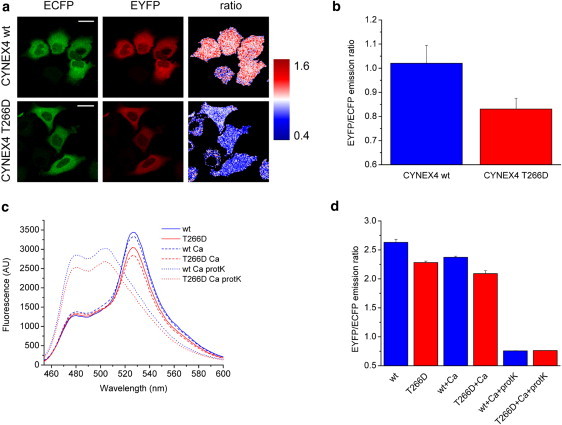
In vivo and in vitro FRET using CYNEX4. (a) Images of the donor (ECFP) and acceptor (EYFP) fluorescence emission and the EYFP/ECFP emission ratio in transfected HeLa cells, for CYNEX4-wt and the phosphorylated-state mimic, T266D. (b) Plot of the measured in vivo FRET emission ratio for CYNEX4-wt (blue) and T266D (red). (c) Fluorescence emission spectra for CYNEX4-wt and T266D. (d) In vitro FRET EYFP/ECFP emission ratios calculated from C in the presence and absence of calcium and after complete proteolysis using proteinase-K.
Analysis of the conformational rearrangement of FRET probes using SAXS
To elucidate the mechanism of phosphorylation-induced structural rearrangement of the CYNEX4 FRET probe, SAXS analysis was conducted on the constructs annexin-A4 (residues 1–319); CYNEX4, a construct with a central annexin-A4 domain (consisting of the N-terminal head and core domains of annexin-A4) flanked by N-terminal EYFP (the FRET acceptor) and C-terminal ECFP (the FRET donor); and a CYNEX4 mutant, T266D, that mimics the phosphorylated state of annexin-A4.
Overall SAXS parameters
The experimental scattering patterns of three FRET probe constructs (CYNEX4, T266D, and the sensor domain annexin-A4) are presented in Fig. 3, and the overall SAXS parameters determined from these data sets are listed in Table 1. Due to possible uncertainties in the concentrations of the probes, molecular masses (MM) were also estimated from the hydrated particle volumes (Vp) calculated from the scattering curves during ab initio modeling in the program DAMMIF (29). The hydrated particle volumes and MM values for all constructs were consistent with values expected for a monomeric species; however, some interparticle attraction was observed at increased protein concentration (Table 1 and Fig. 3 c, upper and lower).
Figure 3.
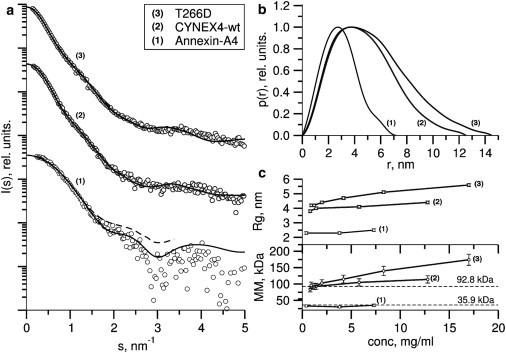
SAXS data for CYNEX4. (a) Fits of the ab initio and rigid-body models reconstructed from the SAXS data. Fits of the CORAL and DAMMIF models are shown as solid and broken lines, respectively (annexin-A4, CYNEX4, and T266D fits are numbered 1–3, respectively). Note: the solid line for annexin-A4 is the fit of the crystal structure (PDB code 2ZOC) to the SAXS data as calculated in the program CRYSOL. Curves are vertically displaced for clarity. (b) Distance distribution functions. (c) Concentration dependence of the radius of gyration, Rg (upper), and of the molecular mass, MM (lower), calculated from the forward scattering intensity.
Table 1.
Overall SAXS parameters
| Construct | Conc (mg/ml) | Rg (nm) | Dmax (nm) | Vp (nm3) | MMexp (kDa) | MMcalc (kDa) |
|---|---|---|---|---|---|---|
| Annexin-A4 | 7.3 | 2.5 ± 0.1 | 8.5 ± 0.5 | 55 ± 5 | 35 ± 5 | 35.9 |
| 3.8 | 2.3 ± 0.1 | 8.0 ± 0.5 | 48 ± 5 | 30 ± 5 | 35.9 | |
| 0.4 | 2.3 ± 0.1 | 7.6 ± 0.5 | 53 ± 5 | 33 ± 5 | 35.9 | |
| CYNEX4-wt | 12.8 | 4.4 ± 0.1 | 15.0 ± 0.5 | 202 ± 20 | 114 ± 10 | 92.8 |
| 5.8 | 4.1 ± 0.1 | 14.3 ± 0.5 | 178 ± 20 | 105 ± 10 | 92.8 | |
| 1.4 | 4.0 ± 0.1 | 13.4 ± 0.5 | 156 ± 15 | 93 ± 10 | 92.8 | |
| 0.8 | 3.8 ± 0.1 | 12.8 ± 0.5 | 142 ± 15 | 84 ± 10 | 92.8 | |
| CYNEX-T266D | 17.0 | 5.6 ± 0.1 | 19.9 ± 0.5 | 361 ± 35 | 174 ± 20 | 92.8 |
| 8.3 | 5.1 ± 0.1 | 18.1 ± 0.5 | 263 ± 25 | 140 ± 15 | 92.8 | |
| 4.2 | 4.7 ± 0.1 | 15.8 ± 0.5 | 203 ± 20 | 115 ± 10 | 92.8 | |
| 2.0 | 4.4 ± 0.1 | 15.0 ± 0.5 | 173 ± 20 | 103 ± 10 | 92.8 | |
| 1.2 | 4.2 ± 0.1 | 14.3 ± 0.5 | 155 ± 15 | 92 ± 10 | 92.8 | |
| 0.9 | 4.2 ± 0.1 | 14.4 ± 0.5 | 157 ± 15 | 96 ± 10 | 92.8 |
Rg, Dmax, Vp, and MMexp are the experimentally (SAXS) determined radius of gyration, maximum particle dimension, hydrated particle volume, and molecular mass, respectively. MMcalc is the molecular mass calculated based on the sequence.
The distance distribution functions, p(r), of the FRET constructs are shown in Fig. 3 b. The CYNEX4 and T266D probes exhibited positively skewed profiles with tails at large distances, characteristic of elongated particles, whereas the p(r) function for annexin-A4 was typical of a prolate ellipsoid. The CYNEX4 constructs exhibited only single maxima, and the absence of additional features could indicate the presence of significant structural flexibility (35). The distance distribution of T266D relative to wildtype CYNEX4 (Fig. 3 b) showed that mutation of this residue led to a significant increase in the maximum dimension of the probe, with Dmax increased from 12.8 ± 0.5 nm to 14.4 ± 0.5 nm. This significant change in the maximum dimension of the biosensor, combined with a significant increase in the radius of gyration, confirms the hypothesis that a change in the conformation of CYNEX4 is caused by charge modification of T266.
In addition, although the phosphorylation-mimicking mutant of annexin-A4, T9D (T6D in the bovine ortholog), is predicted to change conformation of the N-terminal head domain relative to the wildtype protein, no electron density was observed in the crystal structure (1I4A) to support this (16). A clear conformational change originating from this region is observed by SAXS analysis of the CYNEX4 sensor.
Analysis of biosensor flexibility
The presence of possible interdomain flexibility in the CYNEX4 FRET biosensor was investigated using several approaches. In the first, more qualitative approach, insight into the flexibility and foldedness of sensor constructs is made directly from the SAXS data using a dimensionless Kratky plot, (sRg)2(I(s)/I(0) vs. sRg representation (36). In such a plot, folded single-domain globular proteins following Guinier law behavior (see Materials and Methods) provide a bell-shaped curve at low angles with a maximum of 1.1 at sRg 1.75. A completely flexible and unfolded random chain, however, yields a plot that increases with scattering angle to a constant value of 2. An advantage of this type of representation compared to the traditional Kratky plot, s2I(s) vs. s (37) is that it allows objects of different shape and size to be directly compared by making the x and y axes independent of protein size and molecular mass, respectively.
Dimensionless Kratky plots are shown for the CYNEX4 constructs used in this study (Fig. 4 a). For annexin-A4, a bell-shaped curve with a maximum close to 1.1 at sRg 1.75 is observed, suggesting that this construct is a compact folded protein with limited flexibility. The plots for CYNEX4-wt and T266D both show a broadening of the bell-shaped curve and a shift of the maxima to larger sRg, expected for more extended and flexible multidomain particles.
Figure 4.
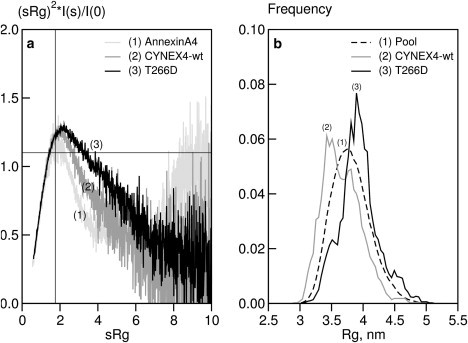
Flexibility analysis of CYNEX4 biosensor constructs. (a) Dimensionless Kratky plot of annexin-A4 (1), CYNEX4 (2), and T266D (3). Cross-hairs indicate the theoretical maximum for a globular Guinier particle in a dimensionless Kratky plot (at coordinates (1.75, 1.10)). (b) Ensemble optimization. Rg distributions of CYNEX4 FRET probe constructs from EOM are shown. The pool of random models is shown as a broken line (1) and the selected ensembles as solid lines: CYNEX4-wt (2), phosphorylation mimic T266D (3).
In the second, more quantitative approach to the analysis of interdomain flexibility, the EOM (31) was employed. This method represents the solution scattering as an average of an ensemble of conformations. A pool of random structures based on the protein sequence and (where available) high-resolution atomic models is generated, and from this pool a genetic algorithm is employed to select subsets of this pool that best fit the experimental scattering data. The EOM analysis of CYNEX4 and T266D is presented in Fig. 4 b as a size distribution, using the radius of gyration, Rg, of the structures forming the pool and the selected ensembles. The Rg distribution of the selected ensemble of conformations for CYNEX4 is slightly skewed toward compact structures and is almost as broad as that of the random pool (Fig. 4 b). Thus, the protein is inherently flexible in solution but samples a restricted range of conformational space. The opposite skew is observed for the selected pool of T266D, where there is a clear trend toward extended conformations. The selected ensemble for T266D is also as broad as the pool, indicating that the phosphorylation mimic is also a flexible entity, sampling a restricted but distinct (compared to CYNEX4-wt) range of conformational space.
Ab initio modeling
Low-resolution three-dimensional models of annexin-A4 (Fig. 1 b) and the CYNEX4 and T266D biosensors (Fig. 5) were reconstructed from the SAXS data using the ab initio modeling program DAMMIF (29), with all models providing an excellent fit to the experimental data (Table 2 and Fig. 3 a). The compact ab initio model for annexin-A4 overlays the crystal structure perfectly (PDB code 1ZOC) (Fig. 1 b), which is also independently validated by the very good fit of this high-resolution structure to the SAXS data (Table 2 and Fig. 3 a). The ab initio model of CYNEX4 is zig-zag shaped, with dimensions that could well accommodate a probe with a central annexin domain (both head and core) flanked by EYFP and ECFP. The ab initio model of the T266D construct is more extended than the CYNEX4-wt model and accommodates the CYNEX4-wt model neatly in a superposition using the program SUPCOMB13 (32) (Fig. 5). The visible similarity in the shapes of the CYNEX4-wt and T266D models suggests that only a minor rearrangement (at low resolution) of the biosensor occurs upon phosphorylation, leading to a more extended structure.
Figure 5.
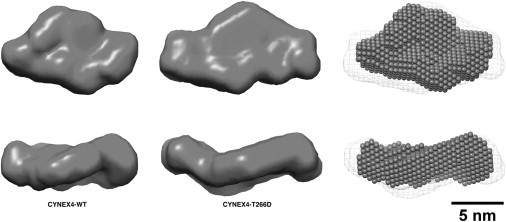
Modeling of CYNEX4 biosensor constructs. Ab initio bead models of CYNEX4 (left) and the phosphorylation mimic T266D (middle), from the program DAMMIF, are shown as solid surfaces. On the right is a best-superposition from SUPCOMB13 of the CYNEX4-wt (spheres) and the T266D (mesh surface) bead models. The lower structures in each panel are rotated through 90° along the horizontal axis.
Table 2.
Modeling of CYNEX4 biosensors
| Construct | χPDB | χS | χRB | χEOM |
|---|---|---|---|---|
| Annexin-A4 | 1.0 | 0.9 | — | — |
| CYNEX4-wt | — | 1.0 | 1.0 | 1.0 |
| CYNEX-T266D | — | 0.9 | 1.0 | 1.2 |
Discrepancies χPDB, χS, χRB, and χEOM refer to that calculated from fits of the relevant x-ray crystal structures, ab initio shape envelopes, rigid-body models, and ensemble optimizations to the SAXS data, respectively.
Rigid-body modeling
Rigid-body modeling of the FRET probes from the scattering data was conducted using the program CORAL, an advanced version of the program BUNCH (34). High-resolution models of EYFP and ECFP (PDB code 1GFL was used for both fluorophores) and the annexin-A4 sensor (PDB code 1ZOC) domains were used as input rigid bodies, with unstructured linkers represented as random loops of dummy residues. The CORAL models of CYNEX4-wt (Fig. 6 a) overlaid well with the ab initio models, describing a zig-zag-shaped conformation. The ensemble of structures shows very little deviation in the intramolecular fluorophore distance, yielding an average EYFP-ECFP separation of 3.5 ± 0.1 nm (measured from the centers of mass of the EYFP and ECFP domains for 10 independent reconstructions), but a number of different relative orientations of the donor and acceptor domains are explored. The CORAL models of T266D fall into two distinct structural clusters (all the while maintaining a shape consistent with that of the ab initio model). The first cluster (7 of 10 reconstructions) shows an ensemble of relatively compact models with an average intramolecular fluorophore distance of 4.5 ± 0.6 nm. The second cluster (3 of 10 reconstructions) shows an ensemble of extended models with an average intramolecular fluorophore distance of 7.5 ± 0.3 nm. The good fit of the best CYNEX4 and T266D rigid-body models (Table 2 and Fig. 3 a) indicates that although these constructs appear to be highly flexible in solution (see Analysis of flexibility), they provide a good representation of the average conformation.
Figure 6.
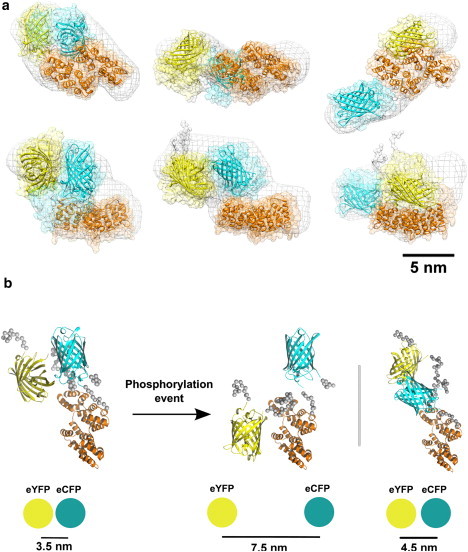
Rigid-body modeling of CYNEX4 biosensor constructs. (a) Ensembles of models from multiple structure calculations using CORAL are shown for CYNEX4-wt (left), the T266D compact cluster (middle), and the T266D extended cluster (right). Representative models from the ensembles are displayed as cartoons and the conformational space mapped out by the ensemble is shown as a transparent surface. The CORAL models are overlaid with the ab initio shape envelopes from DAMMIF (mesh surface, aligned with representative models). The EYFP, annexin-A4, and ECFP domains are yellow, orange, and cyan, respectively. The lower structures in each panel are rotated through 90° along the horizontal axis. (b) Model mechanisms for the EYFP/ECFP ratio change upon phosphorylation of the CYNEX4 biosensor. The average intramolecular fluorophore (EYFP-ECFP) distance for the extended (left) and more compact (right) SAXS-derived conformations are shown.
Identifying a model mechanism for conformational change in the CYNEX4 biosensor
The in vivo and in vitro FRET data strongly suggest that a conformational rearrangement of the CYNEX4 biosensor must occur upon modification of the phosphorylation-sensitive T266. The SAXS data clearly support this suggestion, with a significant increase observed in the overall SAXS parameters describing the size and dimension of the modified biosensor. Further, the ab initio modeling suggests that any conformational rearrangement should maintain the general shape of the biosensor but increase the maximum dimension. Although the ab initio overall shape of the T266D construct reconstructed from SAXS is unique, different interpretations in terms of the high-resolution structures are possible. This reflects the inherently low resolution of the SAXS experimental data and models. The rigid-body modeling approach provides a more informative, higher-resolution picture (by way of the incorporation of high-resolution structures of the constituent domains), albeit not entirely without ambiguity due to the low-resolution nature of the modeling procedure from SAXS data. Rigid-body modeling, in this case, provides information beyond an increase in maximum sensor dimension with charge modification and sheds light on the relative separation of the donor and acceptor fluorophores, shown here to be compatible with the observed FRET data in one of two predicted conformations. Our approach, which combines SAXS and FRET, allows one to clearly distinguish between the concurrent interpretations of SAXS data in terms of rigid-body models.
From the two major solutions of the rigid-body modeling for the phosphorylation mimic, the compact and extended biosensor models, a significant increase in the distance between the donor and acceptor fluorophores was observed (Fig. 6 b). For the compact solution, this distance corresponds to an increase of ∼1 nm relative to the unmodified CYNEX4 biosensor. From theoretical calculations of FRET efficiency for an ECFP/EYFP donor-acceptor pair (see Materials and Methods), this increase in the separation of the donor and acceptor would decrease the FRET efficiency from 0.85 to 0.56 (Fig. 7). This decrease is consistent with the observed change in FRET ratio of ∼13–19% from the in vivo and in vitro experiments. For the extended solution, the observed increase in the intramolecular fluorophore distance is significantly larger, corresponding to an increase of ∼4 nm relative to the unmodified biosensor. This large separation of the donor and acceptor would decrease the FRET efficiency from 0.85 to 0.06 (Fig. 7) and yield an EYFP/ECFP FRET ratio close to zero. This directly conflicts with the experimentally determined decrease of ∼13–19% and eliminates this solution as a plausible average model for the change in FRET observed upon modification of the CYNEX4 biosensor.
Figure 7.
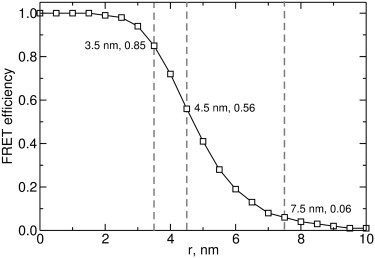
Theoretical FRET efficiency calculations for CYNEX4-wt and both compact and extended T266D conformations (vertical dashed lines) using the intramolecular fluorophore distances (assuming κ2 = 2/3 for a flexible system and R0 = 4.9 nm for an EYFP-ECFP FRET pair).
Conclusion
The assumption commonly used for FRET efficiency calculations is of a dynamic isotropic distribution of the donor and acceptor fluorophores, yielding an orientation factor (κ2) value of 2/3 (∼0.667) (38). In the context of the work described here, with covalent attachment of large proteinaceous fluorophores to a sensor domain, this is of course not entirely valid. There is indeed significant flexibility in the CYNEX4 construct in solution, as evidenced by the results of the EOM analysis, but it is not fully isotropic. Thus, it is expected that the observed change in the FRET efficiency from the in vivo and in vitro experiments will differ somewhat from the exact values calculated from theory. In this case, the FRET data are consistent with an increased separation of the EYFP and ECFP domains, most likely also involving some change in their relative orientation. However, from this data alone, it is not possible to extract accurate distances or be more definite about the domain orientations. In contrast, the SAXS data presented here provide low-resolution structural information that make it possible to accurately measure the average donor-acceptor distance (to within 0.5 nm). From the SAXS analysis, a dynamic model is proposed that demonstrates a change in the average EYFP-ECFP separation from 3.5 nm to 4.5 nm, fully describing the conformational rearrangement of the CYNEX4 biosensor triggered by charge increase at amino acid 266, as is typical for phosphorylation at T266.
Genetically encoded and chemically constructed fluorescence-based biosensors have been developed and employed for many cell and in vivo applications (39,40). For sensors designed to respond to an event such as a chemical modification or ligand binding inducing a conformational rearrangement, characterization of the expected behavior through structural analysis, typically in vitro, is highly desirable. Structural analysis of large flexible sensors, such as the dual-fluorescent-protein-tagged CYNEX4 biosensor, by high-resolution methods (e.g., NMR and x-ray crystallography) is problematic. Constructs >50 kDa in size are particularly challenging for NMR due to spectral overlap and increased signal broadening. Further, flexible systems are difficult to crystallize for x-ray crystallography. SAXS provides a readily accessible approach for structural characterization of such biosensors, because it requires minimal sample preparation and, in principle, allows for time-resolved studies suitable to follow targeted conformational changes (41).
This structural study provides, to our knowledge, the first insight into how typical genetically encoded FRET sensors equipped with fluorescent proteins behave in three dimensions under the influence of varying charge distributions, as is typical for phosphorylation events. In fact, FRET changes of the CYNEX4 sensor pick up these molecular changes. Hence, the strong correlation between structural and fluorescence data presented here will help us to understand the molecular basis of sensor performance. Currently, the development of novel sensors is largely based on a trial and error process due to uncertainty regarding the extent of distance versus dipole change within the sensor molecule (13). Through careful analysis of low-resolution SAXS data and modeling, the distance component can be predicted. By measuring the actual FRET change, it will be possible in the future to also predict the change in fluorophore orientation, albeit with more than one solution unless one of the fluorescent proteins is fully free in its orientation. What is missing is the capacity to observe the dynamics of an actual sensor modification by SAXS before and after the molecular transition. It may be possible to observe such a conformational change using an in-line chromatography system attached to a high-brilliance synchrotron SAXS beamline and capturing the products of a phosphorylation reaction, and this is a future target of investigation. The more static approach presented here provides an excellent model for the possible structures representing the most relevant states of the sensor, and it demonstrates the potential of the synergistic use of the SAXS and FRET approaches. Similar sets of experiments are expected to be of broad applicability for the analysis of structural transitions of FRET-tagged biomolecules, leading to the improvement of future sensor design and performance.
Acknowledgments
The authors thank Gunter Stier, Arie Geerlof, and Gregor Reither for advice on cloning. Molecular graphics images were produced using the UCSF Chimera package from the Resource for Biocomputing, Visualization, and Informatics at the University of California, San Francisco (supported by National Institutes of Health grant P41 RR001081). Plots were created using the program Grace (http://plasma-gate.weizmann.ac.il/Grace/).
This work was supported by the European Comission (the 7th Framework Programme) e-Infrastructures grant (IDPbyNMR contract number 264257) and the Helmholtz Association, SBCancer (Berlin, Germany). H.D.T.M is supported by a fellowship from the European Molecular Biology Laboratory Interdisciplinary Postdocs programme (EIPOD).
Footnotes
Haydyn Mertens's present address is SAXS/WAXS Beamline, The Australian Synchrotron, Clayton, Victoria, Australia.
References
- 1.Chalfie M., Tu Y., Prasher D.C. Green fluorescent protein as a marker for gene expression. Science. 1994;263:802–805. doi: 10.1126/science.8303295. [DOI] [PubMed] [Google Scholar]
- 2.Romoser V.A., Hinkle P.M., Persechini A. Detection in living cells of Ca2+-dependent changes in the fluorescence emission of an indicator composed of two green fluorescent protein variants linked by a calmodulin-binding sequence. A new class of fluorescent indicators. J. Biol. Chem. 1997;272:13270–13274. doi: 10.1074/jbc.272.20.13270. [DOI] [PubMed] [Google Scholar]
- 3.Miyawaki A., Llopis J., Tsien R.Y. Fluorescent indicators for Ca2+ based on green fluorescent proteins and calmodulin. Nature. 1997;388:882–887. doi: 10.1038/42264. [DOI] [PubMed] [Google Scholar]
- 4.Violin J.D., Zhang J., Newton A.C. A genetically encoded fluorescent reporter reveals oscillatory phosphorylation by protein kinase C. J. Cell Biol. 2003;161:899–909. doi: 10.1083/jcb.200302125. [DOI] [PMC free article] [PubMed] [Google Scholar]
- 5.Nikolaev V.O., Bünemann M., Lohse M.J. Novel single chain cAMP sensors for receptor-induced signal propagation. J. Biol. Chem. 2004;279:37215–37218. doi: 10.1074/jbc.C400302200. [DOI] [PubMed] [Google Scholar]
- 6.Wang Y., Botvinick E.L., Chien S. Visualizing the mechanical activation of Src. Nature. 2005;434:1040–1045. doi: 10.1038/nature03469. [DOI] [PubMed] [Google Scholar]
- 7.Fuller B.G., Lampson M.A., Brautigan D.L. Midzone activation of aurora B in anaphase produces an intracellular phosphorylation gradient. Nature. 2008;453:1132–1136. doi: 10.1038/nature06923. [DOI] [PMC free article] [PubMed] [Google Scholar]
- 8.Grashoff C., Hoffman B.D., Schwartz M.A. Measuring mechanical tension across vinculin reveals regulation of focal adhesion dynamics. Nature. 2010;466:263–266. doi: 10.1038/nature09198. [DOI] [PMC free article] [PubMed] [Google Scholar]
- 9.Wang H., Nakata E., Hamachi I. Recent progress in strategies for the creation of protein-based fluorescent biosensors. ChemBioChem. 2009;10:2560–2577. doi: 10.1002/cbic.200900249. [DOI] [PubMed] [Google Scholar]
- 10.Morris M.C. Fluorescent biosensors of intracellular targets from genetically encoded reporters to modular polypeptide probes. Cell Biochem. Biophys. 2010;56:19–37. doi: 10.1007/s12013-009-9070-7. [DOI] [PubMed] [Google Scholar]
- 11.Schleifenbaum A., Stier G., Schultz C. Genetically encoded FRET probe for PKC activity based on pleckstrin. J. Am. Chem. Soc. 2004;126:11786–11787. doi: 10.1021/ja0460155. [DOI] [PubMed] [Google Scholar]
- 12.Newman R.J., Fosbrink M.D., Zhang J. Genetically encodable fluorescent biosensors for tracking signaling dynamics in living cells. Chem. Rev. 2011;111:3614–3666. doi: 10.1021/cr100002u. [DOI] [PMC free article] [PubMed] [Google Scholar]
- 13.Piljić A., de Diego I., Schultz C. Rapid development of genetically encoded FRET reporters. ACS Chem. Biol. 2011;6:685–691. doi: 10.1021/cb100402n. [DOI] [PubMed] [Google Scholar]
- 14.Piljic A., Schultz C. Annexin A4 self-association modulates general membrane protein mobility in living cells. Mol. Biol. Cell. 2006;17:3318–3328. doi: 10.1091/mbc.E06-01-0041. [DOI] [PMC free article] [PubMed] [Google Scholar]
- 15.Piljic A., Schultz C. Simultaneous recording of multiple cellular events by FRET. ACS Chem. Biol. 2008;3:156–160. doi: 10.1021/cb700247q. [DOI] [PubMed] [Google Scholar]
- 16.Kaetzel M.A., Mo Y.D., Seaton B.A. Phosphorylation mutants elucidate the mechanism of annexin IV-mediated membrane aggregation. Biochemistry. 2001;40:4192–4199. doi: 10.1021/bi002507s. [DOI] [PubMed] [Google Scholar]
- 17.Förster T. Zwischenmolekulare Energiewanderung und Fluoreszenz. Annal. Phys. 1948;437:55–75. [Google Scholar]
- 18.Pham E., Chiang J., Truong K. A computational tool for designing FRET protein biosensors by rigid-body sampling of their conformational space. Structure. 2007;15:515–523. doi: 10.1016/j.str.2007.03.009. [DOI] [PubMed] [Google Scholar]
- 19.Feigin L.A., Svergun D.I. Plenum Press; New York: 1987. Structure Analysis by Small-Angle X-ray and Neutron Scattering. [Google Scholar]
- 20.Glatter O., Kratky O., editors. Small Angle X-ray Scattering. Academic Press; London: 1982. [Google Scholar]
- 21.Guinier A., Fournet G., Walker C.B., Vineyard G.H. Phys. Today. 1956;9:38–39. [Google Scholar]
- 22.Mertens H.D.T., Svergun D.I. Structural characterization of proteins and complexes using small-angle X-ray solution scattering. J. Struct. Biol. 2010;172:128–141. doi: 10.1016/j.jsb.2010.06.012. [DOI] [PubMed] [Google Scholar]
- 23.Patterson G.H., Piston D.W., Barisas B.G. Förster distances between green fluorescent protein pairs. Anal. Biochem. 2000;284:438–440. doi: 10.1006/abio.2000.4708. [DOI] [PubMed] [Google Scholar]
- 24.Roessle M.W., Klaering R., Svergun D.I. Upgrade of the small-angle X-ray scattering beamline X33 at the European Molecular Biology Laboratory, Hamburg. J. Appl. Crystallogr. 2007;40:s190–s194. [Google Scholar]
- 25.Round A.R., Franke D., Roessle M. Automated sample-changing robot for solution scattering experiments at the EMBL Hamburg SAXS station X33. J. Appl. Crystallogr. 2008;41:913–917. doi: 10.1107/S0021889808021018. [DOI] [PMC free article] [PubMed] [Google Scholar]
- 26.Konarev P.V., Volkov V.V., Svergun D.I. J. Appl. Cryst. 2003;36:1277–1282. [Google Scholar]
- 27.Guinier A. La diffraction des rayons X aux trés petits angles: application à l'étude de phénomènes ultramicroscopiques. Phys. (Paris) 1939;12:161–237. [Google Scholar]
- 28.Semenyuk A.V., Svergun D.I. GNOM—a program package for small-angle scattering data processing. J. Appl. Crystallogr. 1991;24:537–540. [Google Scholar]
- 29.Franke D., Svergun D.I. DAMMIF, a program for rapid ab initio shape determination in small-angle scattering. J. Appl. Crystallogr. 2009;42:342–346. doi: 10.1107/S0021889809000338. [DOI] [PMC free article] [PubMed] [Google Scholar]
- 30.Svergun D.I., Barberato C., Koch M.H.J. CRYSOL - a program to evaluate X-ray solution scattering of biological macromolecules from atomic coordinates. J. Appl. Crystallogr. 1995;28:768–773. [Google Scholar]
- 31.Bernadó P., Mylonas E., Svergun D.I. Structural characterization of flexible proteins using small-angle X-ray scattering. J. Am. Chem. Soc. 2007;129:5656–5664. doi: 10.1021/ja069124n. [DOI] [PubMed] [Google Scholar]
- 32.Kozin M.B., Svergun D.I. Automated matching of high- and low-resolution structural models. J. Appl. Crystallogr. 2001;34:33–41. [Google Scholar]
- 33.Volkov V.V., Svergun D.I. Uniqueness of ab initio shape determination in small-angle scattering. J. Appl. Crystallogr. 2003;36:860–864. doi: 10.1107/S0021889809000338. [DOI] [PMC free article] [PubMed] [Google Scholar]
- 34.Petoukhov M.V., Svergun D.I. Global rigid body modeling of macromolecular complexes against small-angle scattering data. Biophys. J. 2005;89:1237–1250. doi: 10.1529/biophysj.105.064154. [DOI] [PMC free article] [PubMed] [Google Scholar]
- 35.Bernadó P. Effect of interdomain dynamics on the structure determination of modular proteins by small-angle scattering. Eur. Biophys. J. 2010;39:769–780. doi: 10.1007/s00249-009-0549-3. [DOI] [PubMed] [Google Scholar]
- 36.Durand D., Vivès C., Fieschi F. NADPH oxidase activator p67(phox) behaves in solution as a multidomain protein with semi-flexible linkers. J. Struct. Biol. 2010;169:45–53. doi: 10.1016/j.jsb.2009.08.009. [DOI] [PubMed] [Google Scholar]
- 37.Koch M.H.J., Vachette P., Svergun D.I. Small-angle scattering: a view on the properties, structures and structural changes of biological macromolecules in solution. Q. Rev. Biophys. 2003;36:147–227. doi: 10.1017/s0033583503003871. [DOI] [PubMed] [Google Scholar]
- 38.Griffin B.A., Adams S.R., Tsien R.Y. Specific covalent labeling of recombinant protein molecules inside live cells. Science. 1998;281:269–272. doi: 10.1126/science.281.5374.269. [DOI] [PubMed] [Google Scholar]
- 39.Miyawaki A. Development of probes for cellular functions using fluorescent proteins and fluorescence resonance energy transfer. Annu. Rev. Biochem. 2011;80:357–373. doi: 10.1146/annurev-biochem-072909-094736. [DOI] [PubMed] [Google Scholar]
- 40.Cobos Correa A., Schultz C. Small molecule-based FRET probes. In: Gadella T., editor. FLIM and FRET. Elsevier; Amsterdam: 2008. pp. 225–288. [Google Scholar]
- 41.Cammarata M., Levantino M., Ihee H. Tracking the structural dynamics of proteins in solution using time-resolved wide-angle X-ray scattering. Nat. Methods. 2008;5:881–886. doi: 10.1038/nmeth.1255. [DOI] [PMC free article] [PubMed] [Google Scholar]