

Abstract
Imaging mRNA with single-molecule sensitivity in live cells has become an indispensable tool for quantitatively studying RNA biology. The MS2 system has been extensively used due to its unique simplicity and sensitivity. However, the levels of the coat protein needed for consistent labeling of mRNAs limits the sensitivity and quantitation of this technology. Here, we applied fluorescence fluctuation spectroscopy to quantitatively characterize and enhance the MS2 system. Surprisingly, we found that a high fluorescence background resulted from inefficient dimerization of fluorescent protein (FP)-labeled MS2 coat protein (MCP). To mitigate this problem, we used a single-chain tandem dimer of MCP (tdMCP) that significantly increased the uniformity and sensitivity of mRNA labeling. Furthermore, we characterized the PP7 coat protein and the binding to its respective RNA stem loop. We conclude that the PP7 system performs better for RNA labeling. Finally, we used these improvements to study endogenous β-actin mRNA, which has 24xMS2 binding sites inserted into the 3′ untranslated region. The tdMCP-FP allowed uniform RNA labeling and provided quantitative measurements of endogenous mRNA concentration and diffusion. This work provides a foundation for quantitative spectroscopy and imaging of single mRNAs directly in live cells.
Introduction
Imaging mRNAs in single living cells allows the dynamics of mRNA transcription, transport, and localization to be studied with greater spatiotemporal resolution compared with traditional approaches. Several techniques have been developed to visualize mRNA with single transcript sensitivity in live cells (1,2). One can directly inject or transfect fluorescently labeled mRNA into cells that can be imaged with excellent signal/noise ratio (SNR) (3,4). A drawback of this approach is that these RNAs are not synthesized and processed normally by the cell, and consequently may lack certain trans-acting protein factors that influence RNA metabolism. To image endogenous mRNA, investigators have used different fluorogenic probes, such as molecular beacons. These probes produce fluorescence signal only when they hybridize to their target RNAs (5). However, this technology is limited by complicated hybridization kinetics and the reduced stability of hybridized mRNA. Recently, RNA aptamers that bind to small molecules that resemble GFP-like fluorophores have been developed (6). The small molecule becomes fluorescent only when the reporter RNA containing the aptamer sequence binds to it. This is a promising technique to image RNA; however, the sensitivity needs to be improved to detect single transcripts. In the last approach, an RNA-binding protein fused to a fluorescent protein (FP) is coexpressed with a reporter mRNA containing the RNA sequence that the RNA-binding protein recognizes. The MS2 system is the first and most widely used technique utilizing this strategy (7). A drawback of this system, however, is the background fluorescence generated from free coat proteins, which decreases the SNR and labeling efficiency. In this work, we developed a technology to address this problem by engineering coat proteins so that very low background levels and high SNR can be obtained.
In the MS2 labeling method, a genetically encoded sequence derived from the bacteriophage MS2 is inserted into the gene of interest. The sequence folds into a unique stem-loop structure that forms the MS2-binding site (MBS) for the MS2 coat protein (MCP) (8). When cells that express the gene carrying MBS also express MCP fused to an FP (MCP-FP), the mRNA of interest is fluorescently labeled by MCP-FP. Because both the MCP-FP and the reporter mRNA are genetically encoded, it is possible to make stable cell lines or even transgenic animals. This technique was first employed to image ASH1 mRNA in yeast (7). Since then it has been used to image transcription, transport, and localization of mRNA in various cell types and organisms (9–13). Recently, a transgenic mouse model (the MBS mouse) was established in which the 24xMBS cassette is inserted into the 3′ untranslated region (UTR) of the β-actin gene (15). With the MBS mouse, it is possible to image an endogenous mRNA in isolated cells, tissue, or even a living animal. For example, visualization of the endogenous β-actin mRNA moving through the nuclear pore complex has been achieved in a cell line derived from the MBS mouse (11). To image multiple mRNAs in the same cell, other RNA-binding proteins and their cognate RNAs have been engineered in a similar manner as the MS2 system (16–19). PP7 bacteriophage coat protein binds to its own stem-loop RNA primer-binding site (PBS) with high affinity (Kd = 1.6 nM (18)) but only weakly interacts with the MBS (Kd > 1 μM). Because both MCP and PCP recognize unique RNA stem loops, this allows both systems to be used in the same cell to visualize distinct mRNA populations. Recently, the PP7 system was used to image real-time transcription dynamics in live yeast cells (20).
One of the limitations of MS2-like systems is the high fluorescent background due to the unbound MCP-FP signal. To detect single mRNA molecules, it is necessary to incorporate multiple binding sites into the mRNA to increase the signal of the mRNA over the background of MCP-FP. It was previously observed that not all MBSs are completely bound by MCP-FP (21). In addition, it is often found that the mRNAs are not uniformly labeled in different cells, which complicates quantitative analysis. For example, to quantify the number of nascent transcripts at the transcription site, one must know the number of MCP-GFPs per mRNA to correctly calibrate the measurement. It is accepted that both MCP and PCP bind to their target RNA stem loops as dimers. However, the extent of dimerization of the CP-FP fusions in the cell is not known. Therefore, to fully utilize these labeling techniques to obtain quantitative information about mRNA dynamics in living cells, one must ensure that the dimerization of CP-FP is thoroughly calibrated and carefully optimized. In this work, we constructed single-chain tandem dimers of the MS2 and PP7 coat proteins (termed tdMCP and tdPCP, respectively), which eliminated the additional dimerization step and allowed us to achieve uniform labeling and quantitative imaging of RNA with substantially increased SNR.
We used fluorescence fluctuation spectroscopy (FFS) to quantify the MS2 and PP7 labeling systems. FFS utilizes the fluctuating fluorescence signal when fluorescently labeled molecules move through a subfemtoliter observation volume, allowing various physical and biological systems to be studied at the single-molecule level. Fluorescence correlation spectroscopy (FCS) (22–24), a well-known FFS technique, uses the autocorrelation function to measure concentration, diffusion, transport, and interactions both in vitro and in vivo. FCS distinguishes species based on their diffusion coefficients, which ultimately depend on molecular weights (25). The mRNA diffuses much more slowly than the free CP-FP, which allows the diffusion constant of mRNA to be specifically measured with FCS. Another important FFS tool is brightness analysis. Brightness characterizes the average fluorescence intensity of a single particle. Because brightness depends on the number of fluorophores in a particle, it reveals the oligomerization state of a molecule (26–28). For example, if two fluorescently labeled monomers form a dimer, the brightness of the dimer will be twice that of the monomer (27). Brightness analysis has been used to measure stoichiometry and binding curves of proteins directly in live cells (29,30). The mRNA molecule, bound by multiple CP-FPs, has a brightness value much higher than that of free CP-FP. Therefore, both the brightness and the diffusion coefficient can be used to resolve mRNA from the background of free CP-FPs. Time-integrated fluorescence cumulant analysis (TIFCA) (31), which was developed to unify the brightness and diffusion coefficient into a same analytical model, is an ideal tool for extracting quantitative information from the data.
In this study, we first used an FFS brightness analysis to measure the dimerization of both MCP-FP and PCP-FP. We then generated single-chain tandem dimers of both coat protein (tdMCP and tdPCP) that significantly improved the labeling efficiency and uniformity. Subsequently, we measured the copy number of the CP-FPs (or tdCP-FPs) on an mRNA and compared the MS2 and PP7 systems quantitatively. Finally, we demonstrated the biological value of this approach by applying FFS to measure the diffusion constants and concentration of endogenous β-actin mRNA. The concentration of β-actin transcripts in the nucleus during serum stimulation was measured quantitatively.
Materials and Methods
FFS and data analysis
The FFS experiments were performed on an in-house-built, dual-channel, two-photon fluorescence fluctuation microscope. The instrument consists of an Olympus IX-71 and a mode-locked Ti:Sapphire laser (Chameleon Ultra; Coherent, Santa Clara, CA). A 60× Plan-Apo oil immersion objective (NA=1.4; Olympus, Center Valley, PA) is used to focus the laser and collect the fluorescence. The scattered laser light is eliminated by two short-pass filters (ET680sp-2p8; Chroma, Rockingham, VT). The fluorescence is separated into two different detection channels with a dichroic mirror (565DCXR; Chroma). The green channel is equipped with a band-pass emission filter (FF01-525/50-01; Semrock, Rochester, NY) to eliminate the reflected fluorescence from red channel. Two avalanche photodiodes (APD) (SPCM-AQR-14; PerkinElmer, Waltham, MA) detect photons in each channel. The output of the APD, which produces TTL pulses, is directly connected to a two-channel data acquisition card (FLEX02; Correlator.com). The recorded photon counts were stored and later analyzed with programs written in IDL (ITT Exelis, McLean, VA).
The normalized brightness b (27) is defined as b = λapp/λEGFP. The sample apparent brightness λapp is measured via generalized Mandel's Q parameter analysis (32). The brightness λEGFP is obtained in a calibration experiment by measuring cells transfected with enhanced green fluorescent protein (EGFP). For a mixture of different homo-oligomers, the normalized brightness depends on the dissociation constant and the degree of oligomerization. For a monomer/dimer equilibrium with dissociation constant Kd, the normalized brightness b is
| (1) |
where At is the total concentration of A, At = 2A2 +A. In the FFS experiment, At is readily measured by the total intensity divided by the monomer brightness. Therefore, the dissociation constant Kd is determined by fitting b as a function of At.
We performed a single-color TIFCA analysis as described previously (31). Basically, we rebinned the raw photon counts to calculate the factorial cumulants for different sampling times. We then fit the experimental cumulants to a theoretical model:
| (2) |
where Ni, λi, and τdi are respectively the number of molecules, brightness, and diffusion time of the ith species. The function Bn(T; τdi, r) is the nth order binning function as defined previously (31). The summation is over the number of species. The parameter γn is the nth order γ-factors, and r is the squared beam waist ratio that describes the excitation laser profile (31).
The autocorrelation curves were fit to a simple diffusion model:
| (3) |
where the parameter . Note that G0i depends not only on the number of molecules but also on the fractional intensities fi = Niλi/ΣjNjλj. Without knowledge of brightness, the autocorrelation function is not able to recover the number of molecules. Thus, we used it only to obtain the diffusion time of molecules.
Fluorescence imaging and analysis
Images were taken with a 150× 1.45 NA oil immersion objective (Olympus) and 488-nm excitation laser, and recorded with an EMCCD camera (model DU897 BI; Andor iXon, South Windsor, CT). The microscope was controlled with MetaMorph imaging software. A time-lapse movie of a single Z-plane was recorded with a 50-ms exposure time. To count mRNA in a single plane, we used a spot detection algorithm based on a two-dimensional Gaussian mask as described previously (33) and implemented in MATLAB (The MathWorks, Natick, MA).
Plasmid construction
To create single-chain tandem dimeric coat proteins, we used polymerase chain reaction (PCR) to produce two coat protein gene sequences with appropriate restriction sites. The linker region between the two MCPs is ATCTACGCCATGGCTTCT, and that between the two PCPs is CGTGCGGATCCGCTAGCCTCC. A nuclear localization signal (NLS) and hemagglutinin (HA) tag were also added to the constructs. We created NLS-PCP-EGFP (P000234), NLS-tdPCP-EGFP (P000233), NLS-MCP-EGFP (P000109), and NLS-tdMCP-EGFP (P000143) genes by PCR (Fig. 1 A). The NLS sequence was added to sequester the coat protein in the nucleus and keep the unbound coat protein in the cytoplasm at a minimum. All coat protein constructs used in this work have an NLS signal, so the NLS is omitted for simplicity when we refer to a coat protein. We cloned these genes into a phage-ubc-RIG lentiviral backbone from which the DsRed-IRES-GFP fragments had been excised using NotI and ClaI. We also further modified the lentiviral backbone to replace the human ubiquitin C (UBC) promoter with the cytomegalovirus (CMV) promoter. Using PCR, we generated the sequence coding for cyan fluorescent protein (CFP). After the stop codon, we inserted 24xMBS (24xPBS) sites. Finally, we combined phage-CMV backbone and CFP-24xMBS (P000169) (or CFP-24xPBS (P000179)) into a complete plasmid, yielding mRNA with a CFP open reading frame and 24xMBS (or 24xPBS) in the 3′ UTR.
Figure 1.
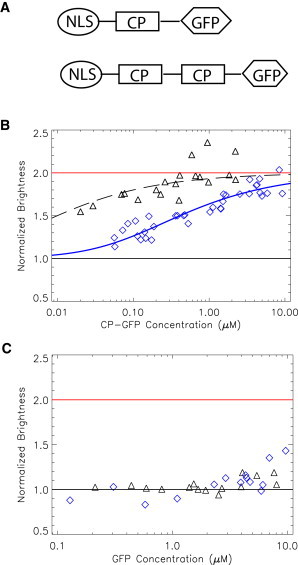
Normalized brightness of coat proteins. (A) Schematic of the coat protein constructs. (B) The brightness of CP-EGFP measured in U2OS cells is plotted as a function of CP concentration. From the data, it is clear that PCP-EGFP (triangles) dimerizes at a much lower concentration than MCP-EGFP (diamonds) does . The data were fit to Eq. 1 to obtain the dissociation constant of the coat protein (410 nM for MCP-EGFP and <20 nM for PCP-EGFP). (C) The normalized brightness of tdCP-EGFP stays at unity at different concentrations, indicating that the tandem dimers are behaving as monomers.
Cell culture and sample preparation
We used a mouse with 24xMBS sites knocked into the 3′ UTR of the Actb gene (MBS mouse) and isolated the E14 mouse embryonic fibroblast (MEF) line as described elsewhere (15). To stably express MCP-EGFP and tdMCP-EGFP, we created recombinant lentiviral particles using the phage UBC plasmid (described above) and used them to infect the MBS-MEF. After several passages, the cells were sorted for positive EGFP fluorescence by flow cytometry. U2OS cells were obtained from American Type Culture Collection. Both cells were maintained in Dulbecco's modified Eagle's medium (10-013; Cellgro, Manassa, VA) supplemented with 10% fetal bovine serum (FBS, F4135; Sigma-Aldrich, St. Louis, MO) and 1% penicillin and streptomycin (15140-122; Invitrogen). Transient transfection was performed with Fugene 6 (11814443001; Roche, Indianapolis, IN) according to the manufacturer's instructions. Cells were subcultured in a Delta-T coverglass-bottomed imaging dish (Bioptechs, Butler, PA). Before measurements, the growth medium was removed and replaced with Leibovitz L15 medium (21083-027; Invitrogen, Grand Island, NY) with 10% FBS unless explicitly indicated. For MEFs, the dish was also coated with 10 μg/ml human fibronectin (F2006; Sigma-Aldrich) for 30 min before the cells were plated. During the course of the experiment, the Delta-T dish was kept at 37°C.
Results
Brightness analysis of the CP-FP and tdCP-FP fusion proteins
Previous studies showed that MCPs and PCPs bind to their target stem loops as dimers (18,34,35). We used FFS brightness analysis to characterize the oligomerization state of MCP-FP and PCP-FP in living cells. We constructed coat proteins fused to EGFP that also contained an N-terminal NLS (Fig. 1 A). The NLS was used to concentrate the free CP-FPs in the nucleus and thus achieve a higher SNR of mRNA in the cytoplasm. We expressed CP-EGFP in U2OS cells and conducted FFS measurements in the nucleus. The brightness of the sample was calculated via a generalized Mandel's Q parameter analysis (32). In Fig. 1 B, the normalized brightness values are plotted as a function of the concentration of CP-EGFP. Each point represents a measurement in a different cell. The normalized brightness b, determined by the ratio between the brightness of CP-EGFP and EGFP monomer (27), provides a direct measure of the average oligomeric states of the labeled proteins. For instance, a normalized brightness of b = 2 indicates that the protein is a dimer. When the concentration of the protein is varied, the normalized brightness will increase from 1 to 2, depending on the proportions of the monomer and dimer. Therefore, a titration curve of brightness versus concentration gives rise to the apparent Kd of the dimerization interaction. The normalized brightness of PCP in Fig. 1 B (triangle) lies between 1 and 2 and saturates at 2 at high concentrations. The titration curve indicates that the Kd,app of PCP-EGFP is <20 nM (due to the lack of data at very low concentration, we extrapolated the data using Eq. 1; dashed line). Surprisingly, for the MCP (Fig. 1 B, diamond), the situation is very different. MCP-EGFP reaches a dimer fraction at a much higher concentration than PCP-EGFP does, indicating that the former is a much weaker dimer. Fitting the data to Eq. 1 yields Kd, app = 410 nM, which is considerably weaker than the dimerization estimated by biochemical experiments (8). Although biochemical experiments show similar Kd-values for PCP and MCP in vitro, the live-cell FFS experiment shows that MCP-EGFP is a weaker dimer than PCP-EGFP. Further experiments showed that the NLS signal, the linker length between MCP and EGFP, and the identity of the FP do not affect the dimerization affinity of MCP. The reason for the reduced dimerization affinity for MCP-FP is still under investigation.
Free CP-FPs that do not bind to mRNA increase the background fluorescence, so the concentration of CP should be maintained as low as possible. However, because only the dimeric CP can bind to the stem loop, it is imperative to have the CP concentration high enough to maintain sufficient dimer concentration. This is particularly important for the MS2 system because our data suggest that significant amounts of monomeric MCP-EGFP exist under most experimental conditions. In the crystal structures of both MCP and PCP dimers, the N-terminus of one protomer is in close vicinity to the C-terminus of the other protomer (18,35). Due to this structural arrangement, a single-chain tandem dimer of the coat proteins (tdMCP and tdPCP) can be constructed that enables an intramolecular dimer to be formed. The tdMCP has been shown to bind to the MBS with the same affinity as the intermolecular MCP dimer, and has been used to image single molecules of RNA in bacteria (36,37). Based upon these experiments, we generated tdMCP-EGFP and tdPCP-EGFP and determined that they both had a brightness of one (Fig. 1 C), which was, as expected, independent of concentration. The fact that tdCP-FP has a single brightness value is particularly advantageous for FFS brightness analysis, because the apparent brightness of CP-FP depends on its concentration.
tdCP-FP-labeled mRNA has uniform brightness
Quantitative fluorescence imaging and spectroscopy require knowledge of the labeling efficiency of mRNA. Uniform labeling of the mRNA facilitates a quantitative interpretation of experimental results. FFS offers a simple method to measure the number of CP-FPs bound to an mRNA by the normalized brightness of an mRNA. Usually the mRNA has multiple MBSs (or PBSs) and therefore binds to many CP-FPs. The brightness of the mRNA is much higher than that of the free CP-FP. Furthermore, the mRNA is significantly larger than the free CP-FP and diffuses much more slowly. Therefore, one can distinguish them by both brightness and diffusion time. TIFCA (31) is ideal for such an analysis because it incorporates both brightness and diffusion time into the same analysis model.
We constructed plasmids coding for CFP with 24xPBS or 24xMBS inserted after the stop codon in the 3′ UTR (Fig. 2 A). The plasmid was transiently transfected together with the appropriate CP-EGFP in U2OS cells. The experiment was done at a two-photon laser wavelength of 1010 nm so that the CFP would not be excited. To aid the focus of the laser in the cell, mCherry was also cotransfected. The fluorescence was split into two channels by a dichroic mirror and detected by two APDs. We focused the two-photon laser spot at the mid-section in the perinuclear region of a cell by monitoring the red channel signal. The fluorescence intensity trace of the red channel and green channel are plotted in Fig. S1 A of the Supporting Material. From the figure, it is clear that the green fluorescence intensity has a much higher level of fluctuations than that of the red channel, emphasizing the value of the red channel for defining the focal point of the laser. We analyzed the data in the green channel using TIFCA. A one-species model was not able to fit the data, which was expected because of the presence of two components (the mRNA and the free CP-FPs). We fit the data with a two-species model, which more accurately described the data. An example of the fit is presented in Fig. S1 B. From this fit, we measured the brightness of the mRNA. In Fig. 2 B, we plot the normalized brightness of the CFP-24xPBS mRNA labeled by tdPCP-EGFP as a function of total EGFP concentration. Each symbol represents a measurement of a single cell. Even though there were different concentrations of mRNA and tdPCP among the cells, the brightness and the number of coat proteins that bound to the mRNA were relatively constant. The average number of tdPCP-EGFP was 23 ± 5, that is, within error, equal to the expected maximum occupancy of the 24xPBS. We also measured the CFP-24xPBS mRNA cotransfected with PCP-EGFP. The normalized molecular brightness of mRNA is shown in Fig. 2 C. At high concentrations of PCP-EGFP, the normalized brightness saturated at 49 ± 9. This is also equal to the expected maximum occupancy number, 48 (represented as the dash-dotted line), because each stem loop binds to a dimer of PCP-EGFP. In addition, we notice that the mRNA brightness was reduced at low concentrations of PCP-EGFP, where the dimer was not sufficient to saturate all stem loops on the mRNA.
Figure 2.
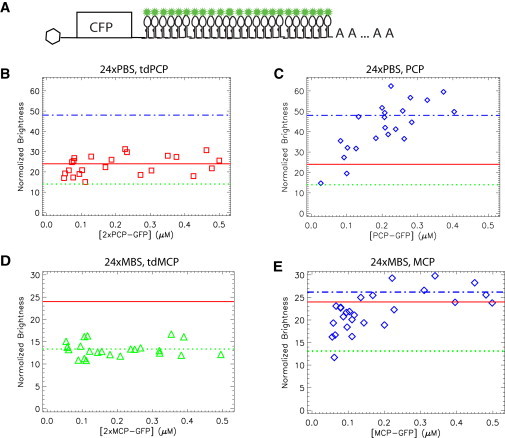
Normalized brightness of mRNA. (A) mRNA constructs used in the experiment. The mRNAs have a CFP open reading frame. After the stop codon, 24xPBS or 24xMBS is inserted into the 3′ UTR. (B) CFP-24xPBS is cotransfected with tdPCP-EGFP and mCherry in U2OS cells and measured for 3 min at a wavelength of 1010 nm. The two-species fit of the data reports the brightness of the mRNA. The normalized mRNA brightness, which measures the number of EGFPs on the mRNA, is plotted as a function of the total concentration of EGFP, determined by dividing the total fluorescence intensity by the EGFP brightness. The data indicate that the average number of EGFP on mRNA is 23 ± 5, implying that 24 PBS are fully occupied. (C) The same experiments were performed as in B except that tdPCP-EGFP was substituted by PCP-EGFP. The normalized brightness of mRNA saturates at 48 at high PCP concentration, but at low concentration the PP7 stem loops are not fully occupied. (D and E) The same experiments were performed on CFP-24xMBS cotransfected with tdMCP-EGFP (D) or MCP-EGFP (E). The normalized brightness of mRNA does not change with concentration for tdMCP-EGFP (the average is 13 ± 2), but it is approximately half of the expected full occupation number, 24. For MCP-EGFP, the mRNA brightness increases with the concentration of MCP and saturates at 26 ± 3.
We performed the same experiment using the MS2 system. We cotransfected the CFP-24xMBS mRNA with tdMCP-EGFP and mCherry. The measured mRNA brightness is shown in Fig. 2 D. It is apparent that the normalized brightness stays constant, but at a lower value than the expected number of 24. In fact, the average is only 13 ± 2 (shown as dotted lines). Similarly, we cotransfected the CFP-24xMBS mRNA and MCP-EGFP together to assess the binding of MCP dimer to mRNA. Not surprisingly, the brightness of the MCP-EGFP-labeled mRNA depended on the concentration of MCP-FP, as shown in Fig. 2 E. The brightness increased with the concentration of MCP-GFP. At the saturation level, the average brightness of mRNA is 26 ± 3, twice that of tdMCP-EGFP, as expected. It was previously reported that the average number of MCP-EGFPs on an mRNA that contains 24xMBS is 33 (21), also indicating an incomplete occupancy. The reason for incomplete binding is further discussed below, but a direct consequence of differences in CP-FP occupancy is that the mRNAs labeled using the PP7 system were brighter, and hence had better SNR than those labeled with the MS2 system in live-cell imaging.
Imaging endogenous β-actin mRNA
As mentioned above, we constructed an MBS mouse in which the 3′ UTR of β-actin gene has 24xMBS knocked in (15). It is possible to image the endogenous β-actin in any cell type from this mouse. We isolated E14 mouse embryonic fibroblasts (MBS-MEF) and made a stable MEF cell line with SV40 T antigen (15). To compare the performance of tdMCP with that of MCP, we made MBS-MEF cell lines that stably express tdMCP-EGFP and MCP-EGFP, respectively, via lentiviral infection, as described in Materials and Methods. The cells were then imaged on a fluorescence microscope. As shown in Fig. 3 A, MCP-EGFP did not label the cells uniformly. The cell in the upper-left corner had higher fluorescence intensity in the nucleus and the mRNA was brightly labeled. However, the mRNAs at the lower right of the image were only faintly labeled. The densities of labeled mRNA were also significantly different between the two cells. This is clearly demonstrated in Movie S1. On the other hand, the cell labeled with tdMCP-EGFP had more uniform labeling, as shown in Fig. 3 B and Movie S2. Although the fluorescence intensity in the nucleus was similar to that of the dimmer cell in Fig. 3 A, the mRNA was brightly labeled. In fact, in some cells, the tdMCP-EGFP concentration was so low that the nuclei looked dark, but the mRNAs were still brightly labeled. To evaluate the labeling efficiency of MCP and tdMCP quantitatively, we counted the number of β-actin mRNAs in the cytoplasm. We used an automated computer program as described in Materials and Methods (Airlocalize) to localize the diffraction-limited fluorescence spots. The cytoplasm was segmented manually, and spots inside the cytoplasmic area were counted as mRNAs. The average fluorescence intensity inside the nucleus was measured to indicate the expression level of the coat proteins. As shown in Fig. 3 C, the detected mRNA number (normalized by the cytoplasm size) stayed constant for various expression levels of tdMCP (triangle), whereas for MCP (diamond) it depended on the concentration of the coat protein in the nucleus. Only at high concentration did it saturate at the level detected by tdMCP.
Figure 3.
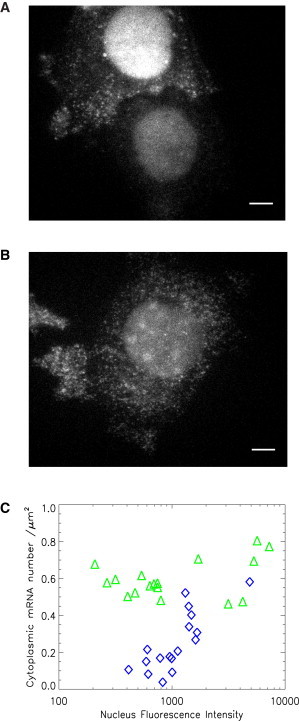
MBS-MEF cells stably expressing (A) MCP-EGFP or (B) tdMCP-EGFP are imaged on an epifluorescence microscope with an excitation wavelength of 488 nm. To assist the comparison, both images are scaled with the same black/white levels. (A) The signal of MCP-EGFP-labeled mRNA depends on the concentration of MCP. The upper-left cell has higher fluorescence intensity in the nucleus and more detectable mRNA than the lower-right cell. These two cells are in the same imaging field. (B) mRNA is uniformly labeled with tdMCP-EGFP. The cell has similar fluorescence intensity in the nucleus as the dimmer cell in panel A, but mRNA molecules are brightly and uniformly labeled. The scale bar is 5 μm. (C) The detected mRNA number in the cytoplasm (normalized by the size of the cytoplasm) is plotted as a function of fluorescence intensity in the nucleus. Each symbol is a measurement of a single cell. To facilitate comparison, the same criterion for spot detection was used for all images. With tdMCP labeling, the detected mRNA number does not depend on the expression level of tdMCP (triangles). However, for MCP-labeled mRNA (diamonds), the detected mRNAs increase with the concentration of MCP and only reach the tdMCP-detected mRNA level at high concentration.
FFS of endogenous β-actin mRNA
Finally, we applied FFS to study endogenous β-actin mRNA in MBS-MEF. We stably expressed tdMCP-EGFP in the MBS-MEF as described in the Materials and Methods section and in (15). The two-photon laser was focused in the cytoplasm near the nucleus and measured for 3 min. An example of a fluorescence intensity trace is plotted in Fig. S2 A. The autocorrelation function was calculated from the data and fit with a two-species diffusion model (Fig. S2 B). From the fit, we obtained two diffusion times. One is close to that of free tdMCP-EGFP and the other is much longer (100 ± 30 ms), which is identified as the mRNA. From the diffusion time, we can infer the diffusion constant based on the calibration of the laser beam waist. A scatter plot of the diffusion constant of mRNA in the cytoplasm is shown in Fig. 4 A. The diffusion constants of mRNA ranged from 0.15 to 0.74 μm2/s, with an average of 0.35 μm2/s. The same data were also subjected to TIFCA fitting, which provided the molecular brightness and the concentration of mRNA. The histogram of mRNA concentration is plotted in Fig. 4 B. The β-actin mRNA concentration ranged from 1 to 30 nM, with an average of 11 nM.
Figure 4.
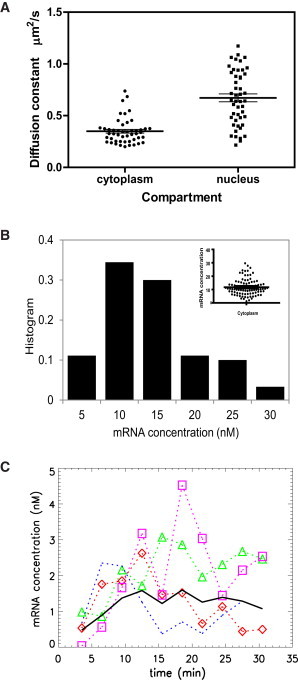
FFS measurements of endogenous β-actin mRNA. (A) Diffusion constant of β-actin mRNA in the cytoplasm and nucleus. MBS-MEF was infected with lentivirus to stably express tdMCP-EGFP. First, the MBS-MEF cell was measured in cytoplasm for 3 min. The autocorrelation function was fit with a two-species diffusion model (Eq. 3; see Fig. S2 for fit) and the mRNA diffusion constant was measured. Second, to measure the diffusion property of mRNA in the nucleus, MBS-MEF cells were stimulated with 20% serum after serum starvation overnight. FFS measurements were conducted in the nucleus immediately after serum stimulation. The photon counting traces were split into 5-min segments. The autocorrelation curves were calculated from the segments and fit to Eq. 3 to obtain the diffusion constant of mRNA. The scatter plot of the diffusion constants of β-actin mRNA is shown. In the cytoplasm, the diffusion constant of β-actin mRNA ranges from 0.15 to 0.74 μm2/s, with an average of 0.35 μm2/s. The diffusion constant of mRNA in the nucleus is larger than in cytoplasm, with an average of 0.72 μm2/s. (B) Concentration of β-actin in cytoplasm. The MBS-MEF cell was measured for 3 min in cytoplasm. The data are fit by a two-species TIFCA model, which provides the concentration of β-actin mRNA. The histogram of mRNA concentration is plotted. In the inset, the scatterplot of the concentration is also shown. The concentration ranges from 1 to 30 nM, with an average of 11 nM. (C) The MBS-MEF was serum-stimulated as described for panel A. The data were subjected to a two-species TIFCA fit, and the concentration of β-actin mRNA is plotted as a function of time. Each dotted curve represents a measurement of a single cell. The average response of these cells is plotted as solid lines.
The transcription of β-actin responds to serum starvation and stimulation (38), and the transcription dynamics can be followed by fluorescence in situ hybridization to monitor the transcript level. We studied the serum stimulation kinetics by measuring mRNA concentration in the nucleus with FFS. The MBS-MEF cells were serum-starved overnight before they were subjected to 20% serum. We then took FFS measurements in the nucleus for 30 min. We divided the data into 3-min segments and fit all segments globally by linking the brightness parameters together while allowing the concentration of species to vary. As a result, the concentration of mRNA during the serum stimulation was obtained. The concentration is plotted in Fig. 4 C. From the plot, there is essentially no mRNA in the nucleus due to the serum starvation. The concentration of mRNA increases after serum stimulation and reaches a maximum after 10 min and then decreases slowly to a steady-state value. There is a large variation among the cells in terms of kinetic response. In Fig. 4 A, we show the scatter plot of the diffusion constant of mRNA in the nucleus compared with that in the cytoplasm. The diffusion constant is larger in the nucleus than in the cytoplasm, possibly due to factors (e.g., ribosomes) binding to the mRNA. The average diffusion constant in the nucleus is 0.72 μm2/s.
Discussion
When imaging mRNA with single-transcript sensitivity, the SNR is the limiting factor. The MS2 technology amplifies the signal of mRNA by multimerizing the MS2-binding sites and increasing the number of FPs bound to an individual mRNA. Another way to increase the SNR is to reduce the background. The background, besides the cellular autofluorescence, results from the free unbound CP-FP. It is known that coat proteins must dimerize before they can bind to their respective RNA stem loops. At a certain concentration of coat protein, the fraction of dimer depends on the dissociation constant Kd. By creating an intramolecular dimer, we eliminate the intermolecular dimerization process and enable all tdCPs to bind directly to their targets. As a result, we can express the tdCP-FP at low concentrations and still label the mRNA efficiently. For example, if the total MCP-FP concentration is 50 nM, the concentration of the dimer would be 4 nM, assuming that the dimerization Kd = 410 nM. If we further assume that the dimer binds to the stem loop with Kd = 5 nM in cells (39), only 40% of the stem loops will be occupied and the SNR of mRNA will be 1.4. However, if a cell has 50 nM tdMCP-FP, 90% of the stem loops will be labeled and the SNR of mRNA will be 3. If we have two EGFPs linked to the tandem dimer (tdMCP-tdFP), the SNR will increase to 4.2, a threefold increase. Experimentally, if the SNR of a particle is too low, it will not be detected. As demonstrated in Fig. 3 C, with tdMCP-FP labeling, the total number of mRNAs detected does not depend on the expression of coat proteins. However, MCP-FP-labeled mRNA depends on the concentration of coat proteins. Therefore, tdCP is more suitable for quantitative counting experiments. Furthermore, tdCP readily saturated the binding sites on an mRNA and resulted in a uniform mRNA brightness, as demonstrated in Fig. 2. This is particularly advantageous for quantifying the number of transcripts at the transcription site.
Combining two coat proteins into a single peptide provides additional advantages. For example, in some applications the coat protein is used to tether the target protein onto RNA (40). The dimerization of coat protein forces the dimerization of the target protein, which might introduce undesirable side effects. The pseudo tandem dimer is a single peptide and effectively behaves as a monomer, which will not cause an undesired oligomerization of the fusion protein. There is, however, a potential drawback of the tandem dimer. Because each tandem dimer is fused to one FP, the maximum number of FPs labeling one mRNA will be reduced to half that of the true dimer. Nevertheless, there is an easy solution for this problem: one can fuse two FPs to the tandem dimer. Preliminary data show that the construct tdMCP-tdEGFP labels mRNA as efficiently as tdMCP-EGFP, but with the additional advantage of being brighter.
Quantitative and sensitive fluorescence fluctuation spectroscopy combined with specific labeling of mRNA provides unique information that is unattainable otherwise. By performing an FFS brightness analysis, we determined the number of CP dimers on the mRNA. For mRNA labeled with 24xPBS, we recovered the expected maximum occupancy number for both tdPCP and PCP. Previously, brightness has been used to measure unknown supramolecular complexes, such as the copy number of the coat protein in viral-like particles (41). Our results provide the first measurement, to our knowledge, of experimentally controlled copy number, which further establishes the validity of the brightness analysis for supramolecular complexes. For mRNA labeled with 24xMBS, our data show that the maximum occupancy number is far below 24. This is consistent with the fluorescence imaging data. The PP7-labeled mRNA is much brighter and has a better SNR than MS2 mRNA. We constructed different MBS constructs by varying the stem length and the linker between the stem loops. The occupation numbers of these mRNAs did not change substantially within experimental error.
We applied FFS to study endogenous β-actin mRNA. As a result, the concentration of β-actin mRNA was measured to be ∼10 nM and varied between 1 and 30 nM. Another metric that we are able to determine is the diffusion constant in both cytoplasm and nucleoplasm. The average value of the diffusion constant in cytoplasm and nucleoplasm is 0.35 μm2/s and 0.72 μm2/s, respectively. Previous studies obtained mRNA diffusion constants between 0.04 μm2/s (42) and 1.3 μm2/s (11) in nucleoplasm by single-particle tracking, depending on the exposure time and tracking algorithm used. FCS effectively measures an average diffusion constant of many mRNAs and is closer to the recent measurements obtained with single-particle tracking (11). To further investigate the diffusion property of mRNA in the cytoplasm, we constructed mRNAs with different lengths, as shown in Fig. S3 A. All three mRNAs have the same coding region of CFP. In the 3′ UTR, 24xPP7, 24xPP7-24xMS2, or 6xPP7 were inserted. Each of these mRNAs was expressed in U2OS cells together with tdPCP-EGFP. The diffusion constants of the mRNAs were measured by FCS and plotted in Fig. S3 B. Although CFP-24xPP7-24xMS2 has 1000 more nucleotides than CFP-24xPP7, their diffusion times are the same within experimental error. The diffusion constant of CFP-6xPP7 is slightly larger than that of CFP-24xPP7.
To summarize, we have established methods for obtaining absolute measurements of specifically labeled endogenous and exogenous mRNAs using FFS. We created a single-chain tandem coat protein dimer that labels mRNA uniformly with increased SNR. Such a careful analysis of the kinetics of the two aptamers binding to their respective coat proteins is a requisite for developing a two-color intra- or intermolecular labeling scheme for RNA. This will prove to be an important technology for measuring the single-molecule kinetics of mRNA metabolism, including synthesis, processing, export, translation, and degradation. Another powerful extension of this study is dual-color FFS. Once we have the ability to label an RNA-binding protein of interest with a different color, dual-color FFS promises to provide information about the interaction between protein and mRNA in precise cellular locations.
Acknowledgments
We thank Timothée Lionnet for sharing the MATLAB program (Airlocalize) for image analysis, and Xiuhua Meng for cloning some of the plasmids.
This work was supported by grants from the National Institutes of Health (GM84364 and GM86217).
Supporting Material
References
- 1.Tyagi S. Imaging intracellular RNA distribution and dynamics in living cells. Nat. Methods. 2009;6:331–338. doi: 10.1038/nmeth.1321. [DOI] [PubMed] [Google Scholar]
- 2.Rodriguez A.J., Condeelis J., Dictenberg J.B. Imaging mRNA movement from transcription sites to translation sites. Semin. Cell Dev. Biol. 2007;18:202–208. doi: 10.1016/j.semcdb.2007.02.002. [DOI] [PMC free article] [PubMed] [Google Scholar]
- 3.Cha B.J., Koppetsch B.S., Theurkauf W.E. In vivo analysis of Drosophila bicoid mRNA localization reveals a novel microtubule-dependent axis specification pathway. Cell. 2001;106:35–46. doi: 10.1016/s0092-8674(01)00419-6. [DOI] [PubMed] [Google Scholar]
- 4.Ainger K., Avossa D., Carson J.H. Transport and localization of exogenous myelin basic protein mRNA microinjected into oligodendrocytes. J. Cell Biol. 1993;123:431–441. doi: 10.1083/jcb.123.2.431. [DOI] [PMC free article] [PubMed] [Google Scholar]
- 5.Bratu D.P., Cha B.J., Tyagi S. Visualizing the distribution and transport of mRNAs in living cells. Proc. Natl. Acad. Sci. USA. 2003;100:13308–13313. doi: 10.1073/pnas.2233244100. [DOI] [PMC free article] [PubMed] [Google Scholar]
- 6.Paige J.S., Wu K.Y., Jaffrey S.R. RNA mimics of green fluorescent protein. Science. 2011;333:642–646. doi: 10.1126/science.1207339. [DOI] [PMC free article] [PubMed] [Google Scholar]
- 7.Bertrand E., Chartrand P., Long R.M. Localization of ASH1 mRNA particles in living yeast. Mol. Cell. 1998;2:437–445. doi: 10.1016/s1097-2765(00)80143-4. [DOI] [PubMed] [Google Scholar]
- 8.Lim F., Spingola M., Peabody D.S. Altering the RNA binding specificity of a translational repressor. J. Biol. Chem. 1994;269:9006–9010. [PubMed] [Google Scholar]
- 9.Zimyanin V.L., Belaya K., St Johnston D. In vivo imaging of oskar mRNA transport reveals the mechanism of posterior localization. Cell. 2008;134:843–853. doi: 10.1016/j.cell.2008.06.053. [DOI] [PMC free article] [PubMed] [Google Scholar]
- 10.Dynes J.L., Steward O. Dynamics of bidirectional transport of Arc mRNA in neuronal dendrites. J. Comp. Neurol. 2007;500:433–447. doi: 10.1002/cne.21189. [DOI] [PubMed] [Google Scholar]
- 11.Grünwald D., Singer R.H. In vivo imaging of labelled endogenous β-actin mRNA during nucleocytoplasmic transport. Nature. 2010;467:604–607. doi: 10.1038/nature09438. [DOI] [PMC free article] [PubMed] [Google Scholar]
- 12.Chubb J.R., Trcek T., Singer R.H. Transcriptional pulsing of a developmental gene. Curr. Biol. 2006;16:1018–1025. doi: 10.1016/j.cub.2006.03.092. [DOI] [PMC free article] [PubMed] [Google Scholar]
- 13.Golding I., Paulsson J., Cox E.C. Real-time kinetics of gene activity in individual bacteria. Cell. 2005;123:1025–1036. doi: 10.1016/j.cell.2005.09.031. [DOI] [PubMed] [Google Scholar]
- 14.Reference deleted in proof.
- 15.Lionnet T., Czaplinski K., Singer R.H. A transgenic mouse for in vivo detection of endogenous labeled mRNA. Nat. Methods. 2011;8:165–170. doi: 10.1038/nmeth.1551. [DOI] [PMC free article] [PubMed] [Google Scholar]
- 16.Brodsky A.S., Silver P.A. Pre-mRNA processing factors are required for nuclear export. RNA. 2000;6:1737–1749. doi: 10.1017/s1355838200001059. [DOI] [PMC free article] [PubMed] [Google Scholar]
- 17.Lange S., Katayama Y., Jansen R.P. Simultaneous transport of different localized mRNA species revealed by live-cell imaging. Traffic. 2008;9:1256–1267. doi: 10.1111/j.1600-0854.2008.00763.x. [DOI] [PubMed] [Google Scholar]
- 18.Chao J.A., Patskovsky Y., Singer R.H. Structural basis for the coevolution of a viral RNA-protein complex. Nat. Struct. Mol. Biol. 2008;15:103–105. doi: 10.1038/nsmb1327. [DOI] [PMC free article] [PubMed] [Google Scholar]
- 19.Daigle N., Ellenberg J. λN-GFP: an RNA reporter system for live-cell imaging. Nat. Methods. 2007;4:633–636. doi: 10.1038/nmeth1065. [DOI] [PubMed] [Google Scholar]
- 20.Larson D.R., Zenklusen D., Singer R.H. Real-time observation of transcription initiation and elongation on an endogenous yeast gene. Science. 2011;332:475–478. doi: 10.1126/science.1202142. [DOI] [PMC free article] [PubMed] [Google Scholar]
- 21.Fusco D., Accornero N., Bertrand E. Single mRNA molecules demonstrate probabilistic movement in living mammalian cells. Curr. Biol. 2003;13:161–167. doi: 10.1016/s0960-9822(02)01436-7. [DOI] [PMC free article] [PubMed] [Google Scholar]
- 22.Magde D., Elson E., Webb W.W. Thermodynamics fluctuations in a reacting system: measurement by fluorescence correlation spectroscopy. Phys. Rev. Lett. 1972;29:705–708. [Google Scholar]
- 23.Berland K.M., So P.T., Gratton E. Two-photon fluorescence correlation spectroscopy: method and application to the intracellular environment. Biophys. J. 1995;68:694–701. doi: 10.1016/S0006-3495(95)80230-4. [DOI] [PMC free article] [PubMed] [Google Scholar]
- 24.Dittrich P., Malvezzi-Campeggi F., Schwille P. Accessing molecular dynamics in cells by fluorescence correlation spectroscopy. Biol. Chem. 2001;382:491–494. doi: 10.1515/BC.2001.061. [DOI] [PubMed] [Google Scholar]
- 25.Meseth U., Wohland T., Vogel H. Resolution of fluorescence correlation measurements. Biophys. J. 1999;76:1619–1631. doi: 10.1016/S0006-3495(99)77321-2. [DOI] [PMC free article] [PubMed] [Google Scholar]
- 26.Digman M.A., Wiseman P.W., Gratton E. Stoichiometry of molecular complexes at adhesions in living cells. Proc. Natl. Acad. Sci. USA. 2009;106:2170–2175. doi: 10.1073/pnas.0806036106. [DOI] [PMC free article] [PubMed] [Google Scholar]
- 27.Chen Y., Wei L.N., Müller J.D. Probing protein oligomerization in living cells with fluorescence fluctuation spectroscopy. Proc. Natl. Acad. Sci. USA. 2003;100:15492–15497. doi: 10.1073/pnas.2533045100. [DOI] [PMC free article] [PubMed] [Google Scholar]
- 28.Saffarian S., Li Y., Pike L.J. Oligomerization of the EGF receptor investigated by live cell fluorescence intensity distribution analysis. Biophys. J. 2007;93:1021–1031. doi: 10.1529/biophysj.107.105494. [DOI] [PMC free article] [PubMed] [Google Scholar]
- 29.Wu B., Chen Y., Müller J.D. Heterospecies partition analysis reveals binding curve and stoichiometry of protein interactions in living cells. Proc. Natl. Acad. Sci. USA. 2010;107:4117–4122. doi: 10.1073/pnas.0905670107. [DOI] [PMC free article] [PubMed] [Google Scholar]
- 30.Chen Y., Müller J.D. Determining the stoichiometry of protein heterocomplexes in living cells with fluorescence fluctuation spectroscopy. Proc. Natl. Acad. Sci. USA. 2007;104:3147–3152. doi: 10.1073/pnas.0606557104. [DOI] [PMC free article] [PubMed] [Google Scholar]
- 31.Wu B., Müller J.D. Time-integrated fluorescence cumulant analysis in fluorescence fluctuation spectroscopy. Biophys. J. 2005;89:2721–2735. doi: 10.1529/biophysj.105.063685. [DOI] [PMC free article] [PubMed] [Google Scholar]
- 32.Sanchez-Andres A., Chen Y., Müller J.D. Molecular brightness determined from a generalized form of Mandel's Q-parameter. Biophys. J. 2005;89:3531–3547. doi: 10.1529/biophysj.105.067082. [DOI] [PMC free article] [PubMed] [Google Scholar]
- 33.Thompson R.E., Larson D.R., Webb W.W. Precise nanometer localization analysis for individual fluorescent probes. Biophys. J. 2002;82:2775–2783. doi: 10.1016/S0006-3495(02)75618-X. [DOI] [PMC free article] [PubMed] [Google Scholar]
- 34.Valegård K., Liljas L., Unge T. The three-dimensional structure of the bacterial virus MS2. Nature. 1990;345:36–41. doi: 10.1038/345036a0. [DOI] [PubMed] [Google Scholar]
- 35.Ni C.Z., Syed R., Ely K.R. Crystal structure of the MS2 coat protein dimer: implications for RNA binding and virus assembly. Structure. 1995;3:255–263. doi: 10.1016/S0969-2126(01)00156-3. [DOI] [PubMed] [Google Scholar]
- 36.Peabody D.S., Lim F. Complementation of RNA binding site mutations in MS2 coat protein heterodimers. Nucleic Acids Res. 1996;24:2352–2359. doi: 10.1093/nar/24.12.2352. [DOI] [PMC free article] [PubMed] [Google Scholar]
- 37.Golding I., Cox E.C. RNA dynamics in live Escherichia coli cells. Proc. Natl. Acad. Sci. USA. 2004;101:11310–11315. doi: 10.1073/pnas.0404443101. [DOI] [PMC free article] [PubMed] [Google Scholar]
- 38.Levsky J.M., Shenoy S.M., Singer R.H. Single-cell gene expression profiling. Science. 2002;297:836–840. doi: 10.1126/science.1072241. [DOI] [PubMed] [Google Scholar]
- 39.Schneider D., Tuerk C., Gold L. Selection of high affinity RNA ligands to the bacteriophage R17 coat protein. J. Mol. Biol. 1992;228:862–869. doi: 10.1016/0022-2836(92)90870-p. [DOI] [PubMed] [Google Scholar]
- 40.Rackham O., Brown C.M. Visualization of RNA-protein interactions in living cells: FMRP and IMP1 interact on mRNAs. EMBO J. 2004;23:3346–3355. doi: 10.1038/sj.emboj.7600341. [DOI] [PMC free article] [PubMed] [Google Scholar]
- 41.Chen Y., Wu B., Mueller J.D. Fluorescence fluctuation spectroscopy on viral-like particles reveals variable gag stoichiometry. Biophys. J. 2009;96:1961–1969. doi: 10.1016/j.bpj.2008.10.067. [DOI] [PMC free article] [PubMed] [Google Scholar]
- 42.Shav-Tal Y., Darzacq X., Singer R.H. Dynamics of single mRNPs in nuclei of living cells. Science. 2004;304:1797–1800. doi: 10.1126/science.1099754. [DOI] [PMC free article] [PubMed] [Google Scholar]
Associated Data
This section collects any data citations, data availability statements, or supplementary materials included in this article.