

Abstract
Cigarette smoking is a risk factor for type 2 diabetes. Genetic variants in the nicotinic acetylcholine receptor (nAChR) genes have been associated with smoking phenotypes and are likely to influence diabetes. Although each single variant may have only a minor effect, the joint contribution of multiple single nucleotide polymorphisms (SNPs) to the occurrence of disease may be larger. In this study, we conducted a gene-family analysis to investigate the joint impact of 61 tag SNPs in 7 nAChRs genes on insulin resistance and type 2 diabetes in 3,665 American Indians recruited by the Strong Heart Family Study. Results show that although multiple SNPs showed marginal individual association with insulin resistance and type 2 diabetes, only a few can pass adjustment for multiple testing. However, a gene-family analysis considering the joint impact of all 61 SNPs reveals significant association of the nAChR gene family with both insulin resistance and type 2 diabetes (both P < 0.0001), suggesting that genetic variants in the nAChR genes jointly contribute to insulin resistance and type 2 diabetes among American Indians. The effects of these genetic variants on insulin resistance and diabetes are independent of cigarette smoking per se.
Type 2 diabetes disproportionately affects American Indians. The prevalence of type 2 diabetes is, on average, two to four times higher than that in other ethnic groups (1). Although lifestyle and environmental risk factors are believed to be significant contributors to the etiology of diabetes, genetic predisposition also plays a critical role (2). Recent genome-wide association studies have identified multiple genetic variants, each of which explains only a small proportion of interindividual variability to diabetes risk (3). It is well accepted that the etiology of type 2 diabetes involves many genes, but a single gene does not cause disease individually; instead, multiple genes act jointly in the context of complex networks or biological pathways in leading to disease susceptibility and disease development (4). A pathway- or gene-family approach taking into account the joint effect of multiple genetic variants with marginal individual effect may capture a large proportion of the associated genetic variants and thus should have a higher power than single-gene analysis in dissecting the complex genetic etiology of diabetes.
American Indians have the highest prevalence of cigarette smoking of all U.S. ethnic groups (5). Previous research from experimental and human studies has demonstrated that cigarette smoking impairs insulin action (6), causes β-cell dysfunction, and induces insulin resistance (7), whereas smoking cessation improves insulin resistance (8) and reduces diabetes risk (9). Therefore, cigarette smoking is believed to be an important risk factor for type 2 diabetes (10). However, the association between cigarette smoking and type 2 diabetes reported in previous studies was primarily performed in European or African American populations. It is unclear whether this relationship also holds for American Indians.
Nicotine is the major bioactive component of cigarette smoke that leads to insulin resistance (11) and diabetes (12). Nicotine acts by binding to nicotinic acetylcholine receptors (nAChRs), a superfamily of ligand-gated ion channels that are widely present within neuronal and nonneuronal cell types (13). Evidence from human and animal research has documented that genetic polymorphisms in nAChRs are associated with nicotine dependence (14) and lung cancer (15). However, according to our knowledge, no study has yet investigated the potential effect of nAChRs genetic variants on diabetes risk. Moreover, existing studies focused on single-gene analysis, which is less powerful in detecting small genetic effect and cannot capture the joint contribution of multiple genes. In this study, we conduct a gene-family analysis to examine whether 61 tag single nucleotide polymorphisms (SNPs) in 7 nAChRs genes jointly contribute to the susceptibility for insulin resistance and type 2 diabetes in a large, well-characterized American Indian population.
RESEARCH DESIGN AND METHODS
Study population.
The Strong Heart Family Study (SHFS) is a multicenter, family-based prospective study designed to identify genetic factors for cardiovascular disease, diabetes, and their risk factors in American Indians. A total of 3,665 tribal members (aged 18 years and older) from 94 multiplex families residing in Arizona (AZ), North and South Dakota (DK), and Oklahoma (OK) were recruited and examined between 2001 and 2003. Detailed descriptions of the SHFS protocols for the collection of phenotype data have been described previously (16). Briefly, a total of 94 families, including 76 three-generation families (26 from AZ, 28 from OK, and 22 from DK) and 18 two-generation families (5 from AZ, 8 from OK, and 5 from DK), were included in this analysis. The largest family size is 113 individuals from DK, 61 from OK, and 80 from AZ, with an average family size of 38 (37 in AZ, 34 in OK, and 45 in DK). The largest sibling size is 9 in DK, 9 in OK, and 10 in AZ. All participants received a personal interview and a physical examination. The personal interview used a standard questionnaire and was administered by trained study personnel to collect data on demographic characteristics, medical history, and lifestyle risk factors including smoking, alcohol consumption, diet, and physical activity. The physical examination included anthropometric and blood pressure measurements and an examination of the heart and lungs. Fasting blood samples were collected to measure lipids and lipoproteins, insulin, plasma creatinine, plasma fibrinogen, and glycosylated hemoglobin, and a 75-g oral glucose tolerance test was performed as described previously (17). Laboratory methods were reported previously (16,18). The SHFS protocol was approved by the Institutional Review Boards from the Indian Health Service and the participating centers. All participants have given informed consent for genetic study of cardiovascular disease, diabetes, and associated risk factors.
Assessments of insulin resistance and diabetes.
According to the 1997 American Diabetes Association criteria (19), diabetes was defined as fasting plasma glucose ≥7.0 mmol/L or post–75-g oral glucose challenge blood glucose of ≥11.1 mmol/L or receiving insulin or oral hyperglycemic treatment. Impaired fasting glucose was defined as a fasting glucose of 6.1–7.0 mmol/L. Fasting glucose <6.1 mmol/L was defined as normal. Insulin resistance was assessed using the homeostatic model assessment (HOMA) according to the following formula: HOMA = fasting glucose (mg/dL) × insulin (μU/mL)/405 (20).
Measurements of diabetes risk factors.
Body weight (kg) and height (cm) were measured by trained research staff when participants wore light clothes and no shoes. BMI was calculated by dividing weight in kilograms by the square of height in meters. Waist circumference was measured at the level midway between the lowest rib and the uppermost iliac crest with the subjects standing. Hip circumference was measured at the level of widest circumference over greater trochanters with the legs close together. Waist/hip ratio (WHR) was calculated as waist circumference divided by hip circumference. Cigarette smoking was assessed via questionnaire and classified as current smokers, former smokers, and never smokers. Current smokers reported smoking ≥100 cigarettes in their lifetime and were currently smoking every day or some days. Former smokers are those who had smoked ≥100 cigarettes but were no longer smoking. Never smokers are those who smoked <100 cigarettes or never smoked in their lifetime. Pack-years were calculated by multiplying the number of packs of cigarettes smoked per day by the number of years the person has smoked. For instance, one pack-year was defined as smoking one pack (20 manufactured cigarettes) per day for 1 year, or two packs per day for half a year, and so on. Alcohol consumption was determined by self-reported history of alcohol intake, the type of alcoholic beverages consumed, frequency of alcohol consumption, and average quantity consumed per day and per week. In this analysis, participants were classified as current drinkers, former drinkers, and never drinkers. Each participant received a pedometer, instructions for wearing the pedometer, and an activity diary at their clinical examination. They were asked to wear the pedometer for 7 consecutive days and to record the number of the steps taken daily in the activity diary. Physical activity was assessed by the mean number of steps per day calculated by averaging the total number of steps recorded each day during the 7-day period.
Tag SNPs selection and genotyping.
Sixty-one tag SNPs in 7 nAChRs genes (CHRNA3–A6, CHRNB2–B4) from the nAChRs gene family were genotyped in 3,665 SHFS participants. These genes were consistently reported to be associated with cigarette smoking in previous studies. For tag SNP selection within each candidate gene, we used the computer program Haploview 4.2 (21) with an r2 threshold of 0.80 for linkage disequilibrium (LD). The following criteria were also considered: minor allele frequency (>5%), SNP location (i.e., coding region), and Illumina design scores (quantifying how likely a SNP can be genotyped). SNPs that could not be tagged (i.e., singletons) were included as long as their design score was >0.15. All genotyping was done at the Texas Biomedical Research Institute using the Illumina VeraCode technology (Illumina, Inc., San Diego, CA). The average genotyping call rates were 98% for the 61 tag SNPs, and sample success rate was >99.5%.
Statistical analysis
Single SNP association analysis.
We examined the association of each individual SNP with insulin resistance or type 2 diabetes, separately, using the generalized estimating equation (GEE). The relatedness among family members of the study participants was accounted for using GEE by including family identifier as a clustering variable. The model also controlled for other covariates, including age, sex, WHR, smoking status (former versus current versus never), alcohol intake (current versus former versus never), HDL cholesterol, LDL cholesterol, systolic blood pressure, levels of physical activity, plasma fibrinogen, and renal function (assessed by estimated glomerular filtration rate [eGFR]). Results from GEE were further validated by family-based association tests using the computer program FBAT (22). Power of genetic association analyses for insulin resistance and type 2 diabetes was estimated using the computer program PBAT (23). To avoid population substructure, we first stratified the analyses by study center (OK, AZ, and DK) and then combined the results from three centers by meta-analysis using the truncated product method (TPM; described below).
Gene-based and gene-family analysis.
The association of a candidate gene (including all SNPs within the gene) with insulin resistance or type 2 diabetes was assessed by combining P values from single SNP association analysis. This was done using the TPM, as described below. A gene-family analysis was then performed by combing the P value of each gene from gene-based analysis, including seven genes in the nAChRs gene family.
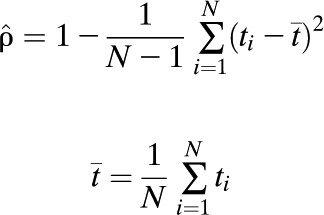
TPM is a P value combination method that is used widely in biostatistics (24). Suppose there are N SNPs within a gene, denoted by s1, s2, …, sN. Let Pi be the P value obtained from single gene-association analysis for si in relation to insulin resistance or type 2 diabetes. TPM takes the product of the P values that do not exceed some prespecified value τ, and the test statistic is calculated as:
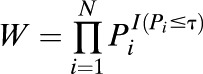 |
where I(·) is an indicator function. When the P values are independent, W has a known distribution. If the P values are not independent, the distribution of W can be estimated using Monte Carlo simulation (24). To calculate W, we need to estimate the correlation matrix, ∑, for the P values. Define the probits  as
as 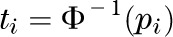 where
where  represents the inverse of a standard normal distribution. Following Demetrescu et al. (25), we assume a constant correlation, ρ, between the probits:
ρ can be estimated by
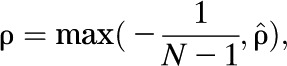 |
where
 |
The correlation matrix ∑ can be estimated using ρ (26). The choice of truncation point, τ, is somewhat arbitrary, and in our analysis, we used τ = 0.1. This is based on our previous research demonstrating that TPM is quite robust to the assumption of constant correlation. Though different choices of truncation points have little influence on the results, our simulation studies indicated that a smaller truncation point may be preferable in terms of type I error of the test (26,27). Our previous research has also demonstrated that this method has good properties in terms of type I error and power under various correlation structures among the P values (26,27). The P value for TPM was estimated by 5,000 simulations. To confirm our results by TPM, we also conducted analyses using other P value combination methods, such as modified inverse normal method (28) or Simes’ method (29), and obtained similar results. In this study, we chose to use TPM because it focuses only on P values below some threshold, thus avoiding the offset on the overall effect by removing some large P values from the analysis and thus probably gains power.
Other statistical analyses.
We first stratified all statistical analyses by geographical sites (AZ, OK, and DK), and then conducted meta-analysis to combine results from the three study centers using TPM. To examine whether cigarette smoking influences the association between genetic variants and insulin resistance or type 2 diabetes, we conducted separate analyses to compare the results with or without adjustment for smoking status. Multiple testing was controlled by Bonferroni correction. That is, for single SNP association analysis, we used the significance level of 0.05/61 = 8.2 × 10⁻⁴. The significance level for gene-based analysis was set to 0.05/7 = 0.007. In all analyses, continuous variables, including insulin resistance, WHR, HDL, LDL, level of physical activity, plasma fibrinogen, and eGFR, were logarithmically transformed to improve normality. Participants with missing information on smoking status (n = 18) or diabetes (n = 39) were excluded from analyses. Analyses were done using SAS version 9.2 (SAS Institute Inc., Cary, NC) and Matlab 7.10.0.499 (The MathWorks, Inc., Natick, MA).
RESULTS
Baseline characteristics of the study participants.
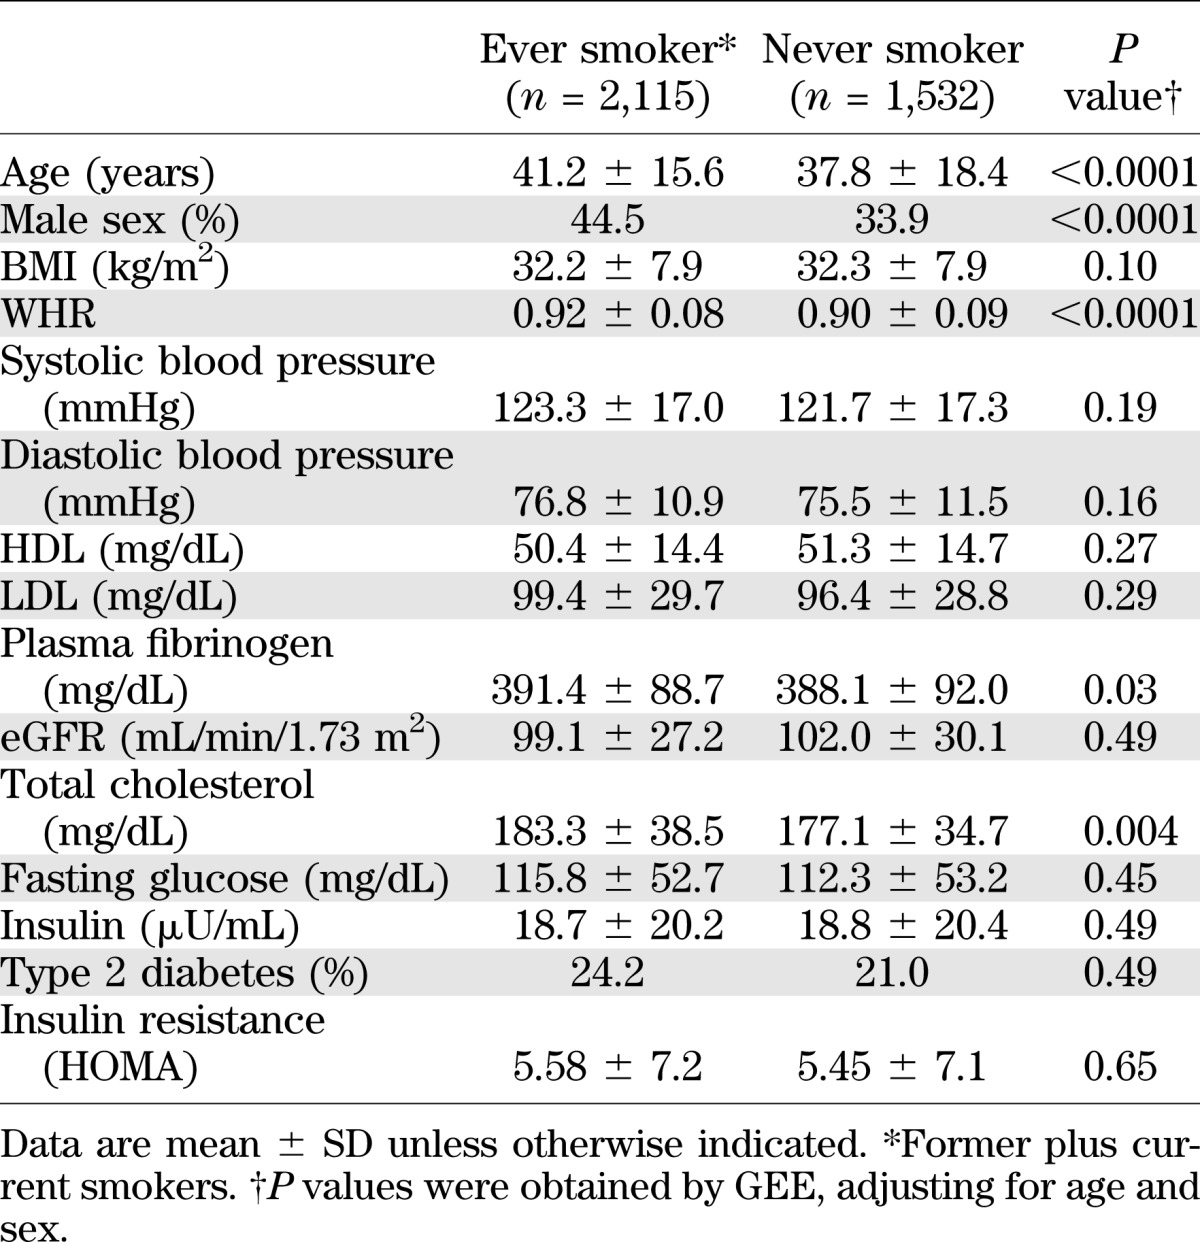
Table 1 presents the baseline characteristics of the study participants by smoking status. Compared with never smokers, smokers were older (38 vs. 41 years old; P < 0.0001), more likely to be males (34 vs. 44%; P < 0.0001), more likely to be centrally obese (WHR 0.90 vs. 0.92; P < 0.0001), had a higher level of plasma fibrinogen (388 vs. 391 mg/dL), and had a higher level of total cholesterol (177 vs. 183 mg/dL; P = 0.004). The demographic characteristics of the study participants according to study center or diabetes status are summarized in Supplementary Tables 1 and 2, respectively
TABLE 1.
Characteristics of the study participants according to smoking status
LD analysis.
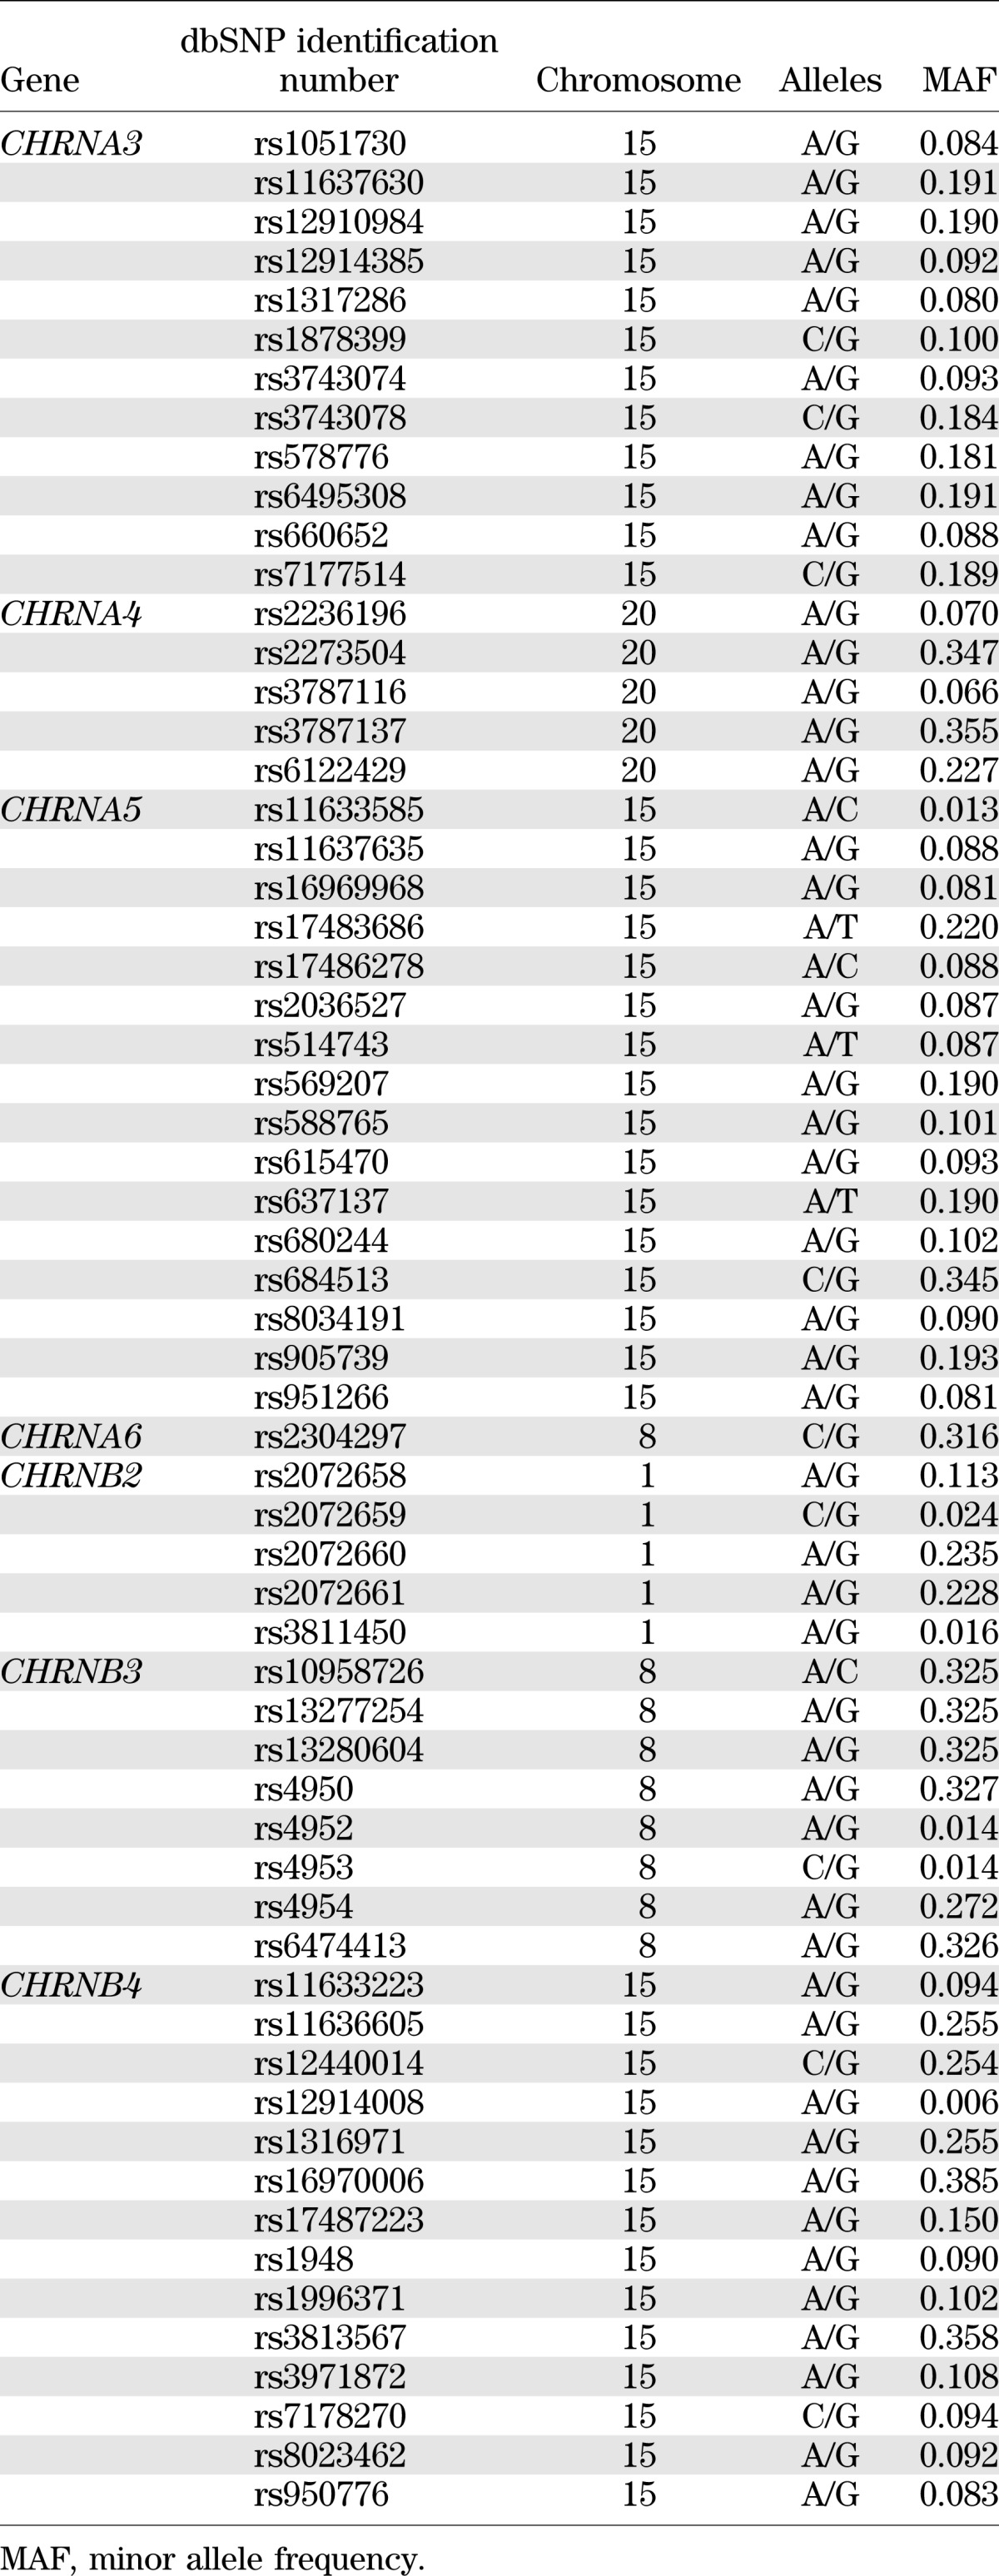
Information for the 61 tagging SNPs examined in this study is shown in Table 2. Pairwise LD patterns were examined by Haploview (21) using the definition of haplotype blocks proposed by Gabriel et al. (30). The LD patterns of the 61 SNPs by chromosome in each study center were illustrated in Supplementary Figures 1–3. In brief, seven haplotype blocks were identified in participants from OK and DK, and six haplotype blocks were found in those from AZ. Two haplotype blocks, one in CHRNB2 and one in CHRNB3, were observed in participants from all three centers, but other blocks differ slightly according to study center, indicating that genetic architecture of study participants from the three centers may not be exactly the same. We therefore stratified all statistical genetics analyses by study center. To increase power, we then combine results from three centers by meta-analysis.
TABLE 2.
Information for the 61 tag SNPs in 7 nAChRs candidate genes genotyped in this study
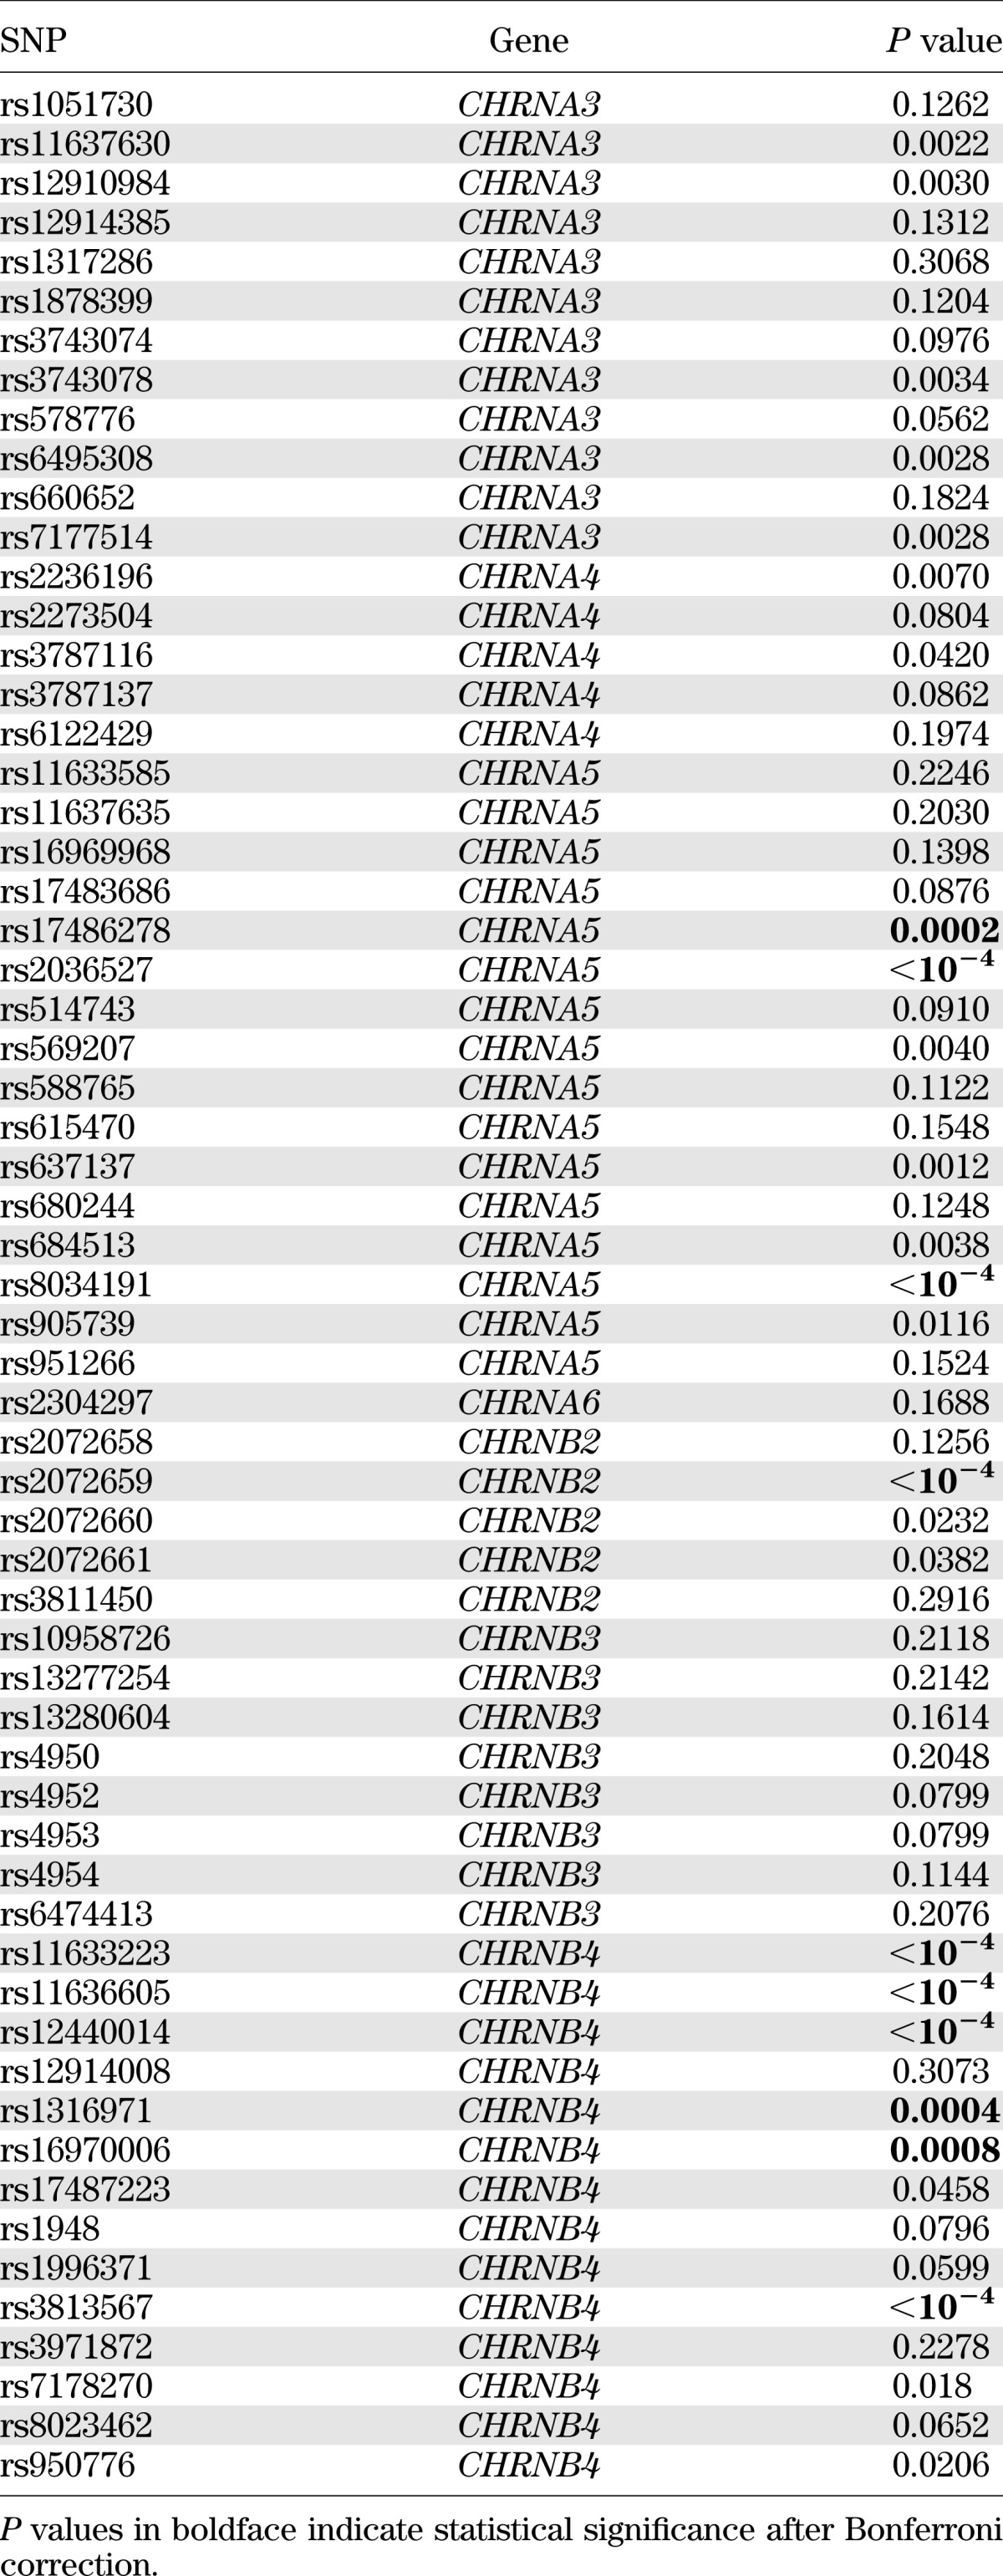
Single SNP association analysis.
Of the 61 SNPs examined, multiple SNPs showed individual association with insulin resistance or type 2 diabetes. After adjustments for age, sex, WHR, smoking, alcohol intake, lipids, blood pressure, physical activity levels, fibrinogen, and renal function, 7 SNPs in CHRNA3, 2 SNP in CHRNA4, 7 SNPs in CHRNA5, 3 SNP in CHRNB2, and 10 SNPs in CHRNB4 were associated with insulin resistance, whereas 5 SNPs in CHRNA3, 2 SNPs in CHRNA4, 7 SNPs in CHRNA5, 3 SNPs in CHRNB2, and 9 SNPs in CHRNB4 were associated with type 2 diabetes. However, only 9 SNPs with insulin resistance and 10 SNPs with diabetes remained statistically significant after correction for multiple testing by Bonferroni. Tables 3 and 4 show the results of single SNP association with insulin resistance and type 2 diabetes, respectively, by meta-analyses. Results of single SNP association analysis with insulin resistance and diabetes according to study centers are listed in Supplementary Tables 3 and 4, respectively. To confirm our results, we also conducted family-based association analysis using the computer program FBAT. Compared with the results by GEE, the genetic associations with insulin resistance or diabetes obtained by FBAT are in general less significant, and none of these associations survives multiple testing correction by Bonferroni (Supplementary Tables 5 and 6).
TABLE 3.
Association of the 61 SNPs with insulin resistance by meta-analysis
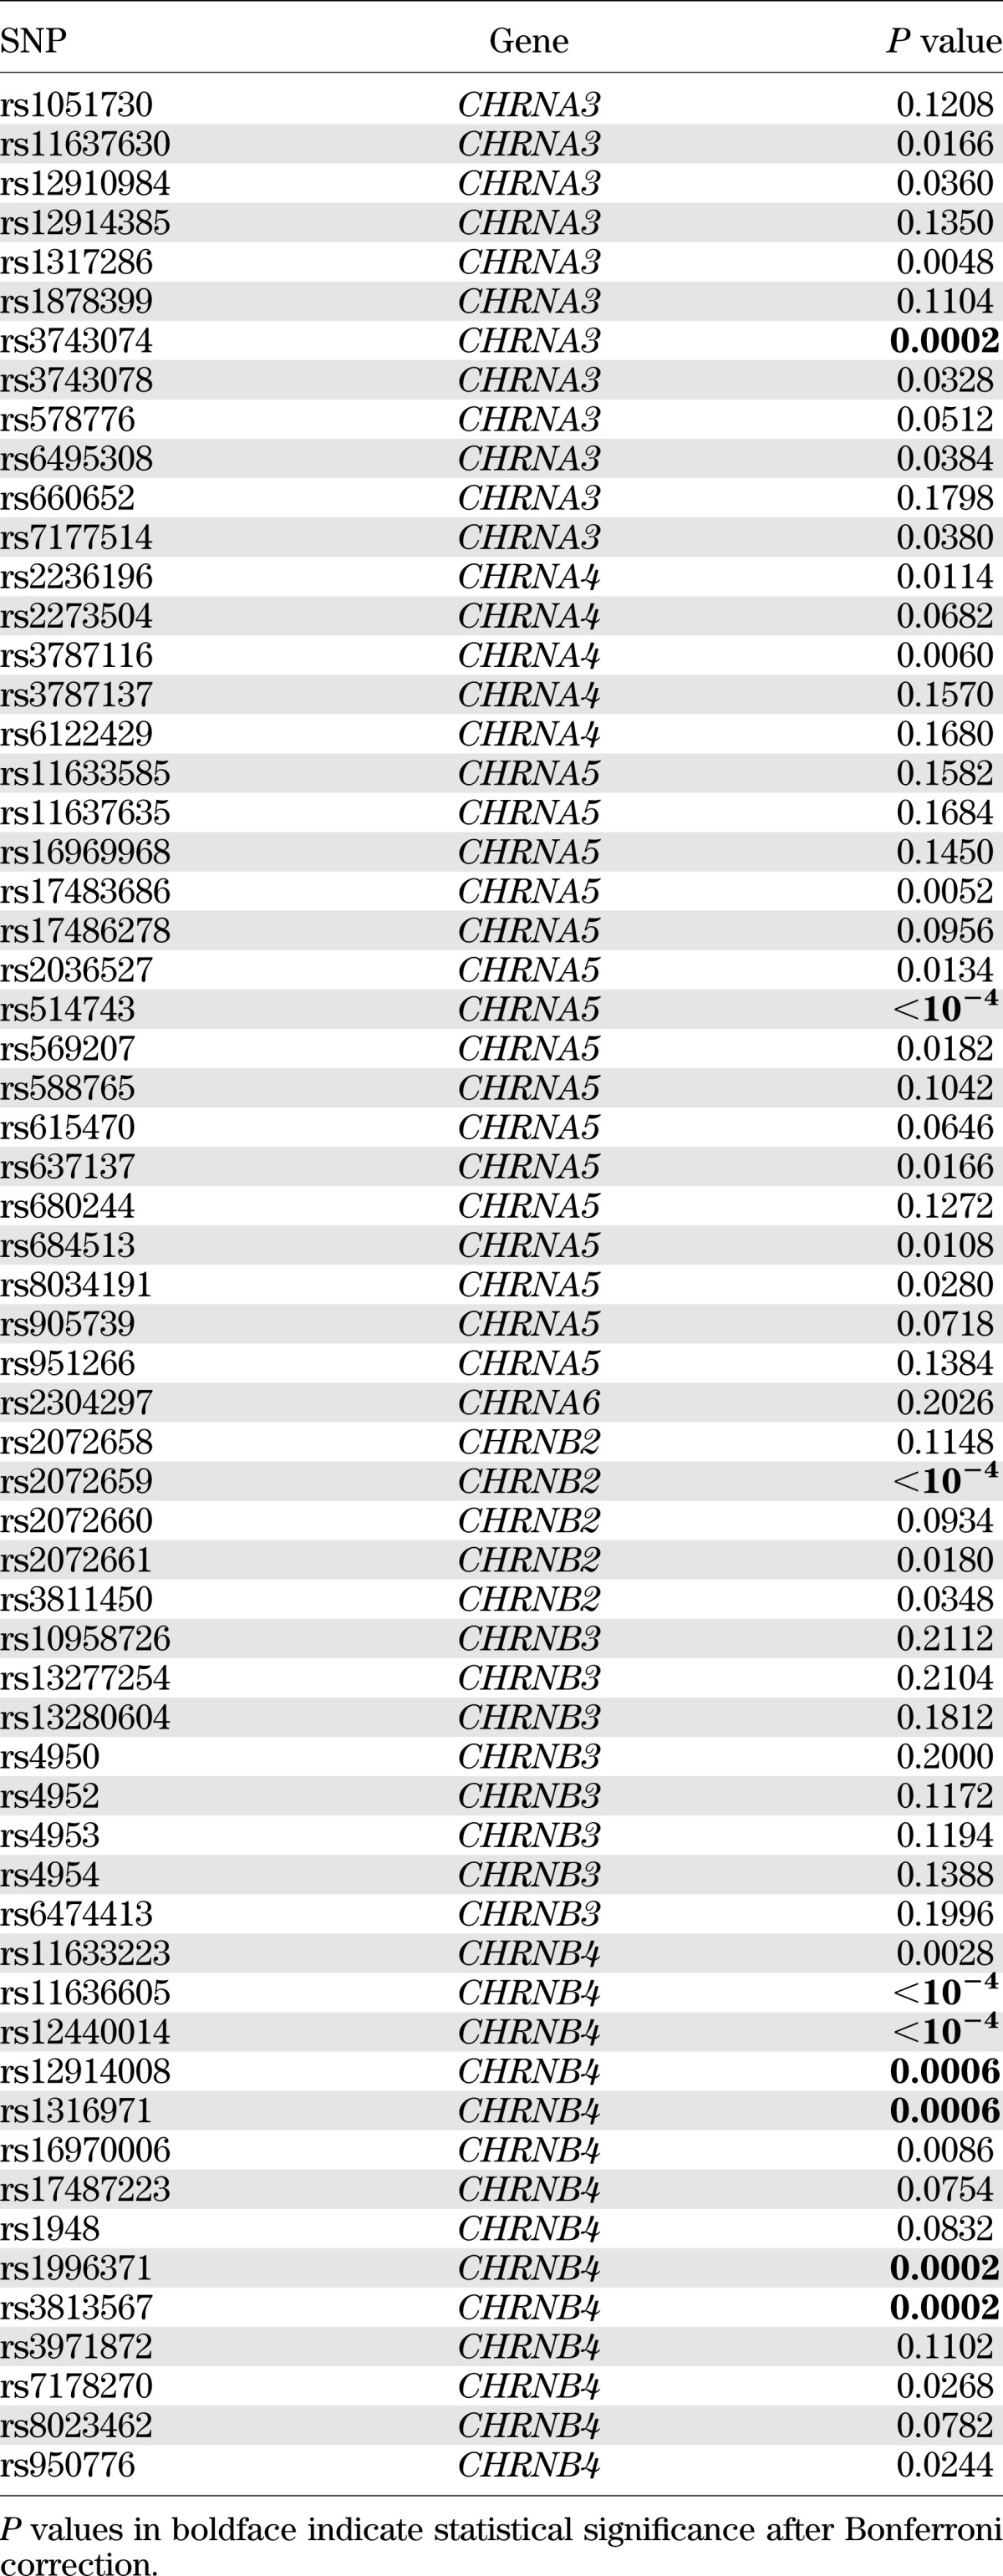
TABLE 4.
Association of the 61 SNPs with type 2 diabetes by meta-analysis
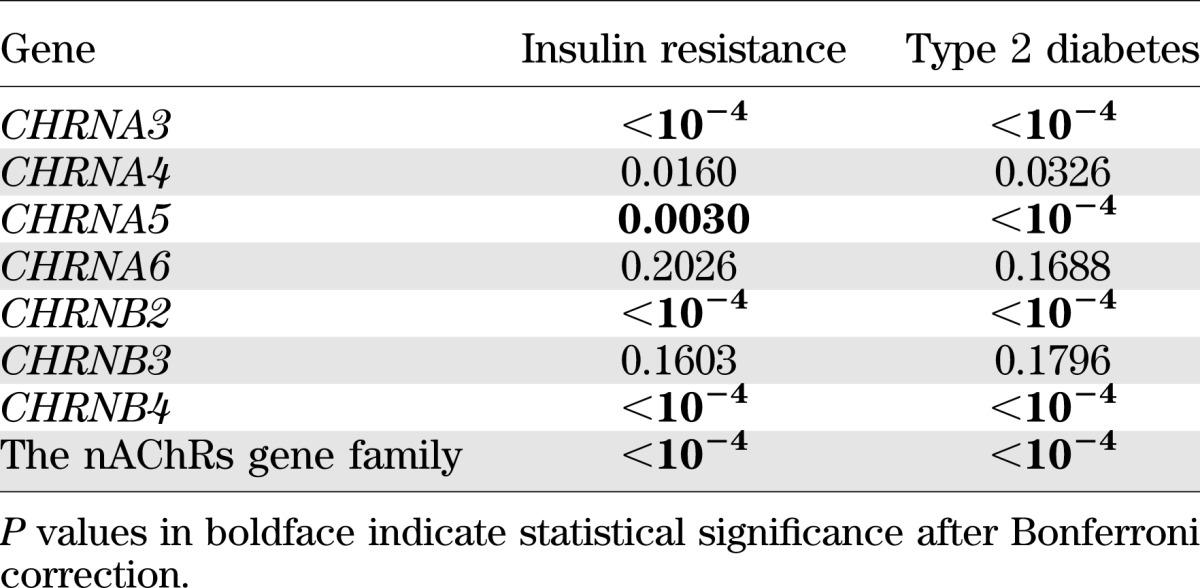
Gene-based and gene-family analysis.
Using P values obtained from single SNP association analysis, we conducted gene-based and gene-family analysis for both insulin resistance and type 2 diabetes by meta-analyses to combine results from the three study centers. Results for gene-based analysis show that, after correction for multiple comparisons, genetic variants in four genes (CHRNA3, CHRNA5, CHRNB2, and CHRNB4) jointly contribute to the susceptibility for insulin resistance and type 2 diabetes (all P values ≤0.005). Gene-family analysis comprising all seven genes demonstrates that the nAChRs gene family as a whole is significantly associated with both insulin resistance and type 2 diabetes (both P < 0.0001). Results for gene-based and gene-family analyses are presented in Table 5. Center-specific results for gene-based and gene-family analyses are shown in online Supplementary Table 7.
TABLE 5.
Gene-based and gene-family associations for the seven nAChRs genes with insulin resistance and type 2 diabetes by meta-analysis
DISCUSSION
Using a sample of 3,665 subjects from the SHFS, we conducted a gene-family analysis to examine the joint impact of 61 genetic variants in seven nAChRs candidate genes on insulin resistance and diabetes in American Indians. We found that, although multiple genetic polymorphisms are individually associated with insulin resistance and/or type 2 diabetes, only a few SNPs survive adjustments for multiple testing. However, a gene-based or a gene-family analysis considering the joint contribution of multiple SNPs reveals significant associations with both insulin resistance and type 2 diabetes. To our best knowledge, this is the first study examining the joint contribution of the nAChRs gene family to the susceptibility for insulin resistance and type 2 diabetes in any ethnic group.
Several aspects of our investigation merit comment. First, although a SNP may show no or marginal association with diabetes by single gene analysis, the joint impact of multiple SNPs within a gene or a gene family on disease susceptibility could be large. For example, no SNP in CHRNA3 is individually associated with diabetes after adjusting for multiple testing, but the joint effect of all SNPs within this gene reveals a significant association with diabetes (P < 0.0001). This finding is in line with previous research demonstrating that a gene-based or gene-family approach simultaneously modeling the joint effect of multiple SNPs within a gene or a gene family may provide a better chance to identify genetic variants that would otherwise be missed by single gene association analysis (31). It is worth pointing out that the observed genetic associations by gene-family analysis may not be driven by the gene showing the most significant association in gene-based analysis, because removing the most significant gene from gene-family analysis did not change our results. Second, genetic variants in the CHRNA5/CHRNA3/CHRNB4 gene cluster located on chromosome 15q24 have been consistently associated with nicotine dependence (32,33). Our gene-family analysis also reveals a significant association of this gene cluster with both insulin resistance and type 2 diabetes, lending further support to previous findings. These associations, however, may not be mediated by cigarette smoking, because further adjustment for smoking had little impact on the observed associations. Moreover, smoking status is associated with neither insulin resistance nor diabetes in our study (Table 1), indicating that it is unlikely to be a mediator for the association between genetic variants and insulin resistance or diabetes. Third, previous studies repeatedly reported an association of rs16969968 in CHRNA5 with nicotine dependence in European Americans or African Americans (15,34). Our analyses, however, did not find an association of this SNP with either insulin resistance or type 2 diabetes, probably due to difference in genetic background between American Indians and other ethnic groups. It is also possible that this SNP might influence diabetes risk through pathways beyond cigarette smoking. Fourth, in our study sample, >50% of the study participants were smokers. However, the amount of cigarettes smoked per day is quite low (median = 5). The frequency of cigarette smoke and the amount of smoke varied by study center, with the lowest being AZ, followed by OK and DK (Supplementary Table 1). Interestingly, though tribal members from AZ had the lowest number of cigarettes smoked per day, strong genetic associations with insulin resistance and type 2 diabetes were observed in this study center. This supports the hypothesis that the impact of nAChRs genes on the susceptibility to insulin resistance or diabetes may not be through cigarette smoking per se. To examine whether smoking quantity influences our study results, we conducted a separate analysis by including pack-year instead of smoking status as a covariate in the statistical models, but our results remained unchanged.
Smokers tend to be thinner than nonsmokers, and smoking cessation results in an increase in body weight (35,36). The mechanism underlying the link between cigarette smoking and body weight is unclear, but a recent study by Mineur et al. (37) suggests that nicotine may stimulate the activity of pro-opiomelanocortin neurons by activation of hypothalamic α3β4 nAChRs, leading to decreased appetite and body weight. Though smokers tend to have lower BMI than never smokers, smokers are more likely to have increased central adiposity (38,39), a strong determinant for insulin resistance and type 2 diabetes (40,41). Furthermore, within a normal BMI, smokers tend to have a greater risk of abdominal fat accumulation compared with nonsmokers (38,42). In our study sample, smokers and never smokers did not exhibit significant difference in BMI, but smokers had significantly larger WHR than never smokers, indicating that smokers tend to be more centrally obese than never smokers. This is consistent with previous findings (38,42). Our results, however, are unlikely to be confounded by obesity because we controlled for WHR in all statistical analyses.
The precise mechanisms through which genetic variants in the nAChRs gene family influence diabetes are unclear, but because smoking increases inflammation (43) and oxidative stress (44), each of which has been strongly implicated in insulin resistance and diabetes (45,46), it is plausible that genetic polymorphisms in nAChRs genes may influence diabetes susceptibility through their impact on inflammatory and/or oxidative responses to cigarette smoking. This hypothesis is supported by our analysis, which shows that smokers have a higher level of plasma fibrinogen than never smokers. In the current study, however, we did not observe a significant difference in the prevalence of type 2 diabetes or the level of insulin resistance between smokers and never smokers, suggesting that the impact of nAChR genetic variants on insulin resistance and type 2 diabetes may not be due to the direct detrimental effect of cigarette smoking per se. Instead, nAChR genetic abnormalities may influence diabetes through regulating appetite or eating behavior (37,47), thus causing changes in body weight or metabolic profiles (48). This hypothesis is corroborated by our observation that smokers are more centrally obese than never smokers, probably due to overeating. Of course, it is also possible that the nAChRs genetic variants could affect diabetes vulnerability through other independent yet uncharacterized mechanisms.
Our study has some limitations. First, though we were able to control many of the potential confounders, we cannot entirely exclude the possibility of residual confounding by other factors such as diet, which is known to be related to diabetes (49). However, a previous study investigating the relationship between cigarette smoking and glycemia indicated that dietary factors may not be a confounder (50). Furthermore, it is possible that adjustment for dietary factors may be overadjustment, as these could be on the causal pathway linking cigarette smoking to diabetes. Second, this study used a cross-sectional design, which thus precluded causal inference. Finally, our analyses were undertaken among American Indians, and hence our results might not be generalized to other ethnic groups.
In summary, this study provides initial evidence for a joint impact of multiple genetic variants in the nAChRs gene family on insulin resistance and type 2 diabetes in American Indians. The impact of these genetic variants on the susceptibility to diabetes is independent of cigarette smoking per se. Our results may provide valuable information for individualized prevention or intervention on diabetes in American Indians who suffer from disproportionately high prevalence of type 2 diabetes.
ACKNOWLEDGMENTS
This study was supported by a seed grant from the Oklahoma Tobacco Research Center and National Institutes of Health Grants K01-AG-034259 and R21-HL-092363 and Cooperative Agreement Grants U01-HL-65520, U01-HL-41642, U01-HL-41652, U01-HL-41654, and U01-HL-65521.
No potential conflicts of interest relevant to this article were reported.
The views expressed in this article are those of the authors and do not necessarily reflect those of the Indian Health Service.
J.Y. and Y. Zhu conducted statistical analyses and wrote the manuscript. S.A.C. and K.H. collected genotype data and reviewed the manuscript. Y.Zha., L.A.B., B.V.H., L.G.B., R.B.D., J.A.H., P.H., and E.T.L. contributed to discussion and reviewed and edited the manuscript. J.Z. conceived the study and wrote the manuscript. J.Z. is the guarantor of this work and, as such, had full access to all of the data in the study and takes full responsibility for the integrity of the data and the accuracy of the data analysis.
The authors thank the SHFS participants, Indian Health Service facilities, and participating tribal communities for extraordinary cooperation and involvement, which has contributed to the success of the SHFS.
Footnotes
This article contains Supplementary Data online at http://diabetes.diabetesjournals.org/lookup/suppl/doi:10.2337/db11-1393/-/DC1.
REFERENCES
- 1.Burrows NR, Geiss LS, Engelgau MM, Acton KJ. Prevalence of diabetes among Native Americans and Alaska Natives, 1990-1997: an increasing burden. Diabetes Care 2000;23:1786–1790 [DOI] [PubMed] [Google Scholar]
- 2.Barroso I. Genetics of Type 2 diabetes. Diabet Med 2005;22:517–535 [DOI] [PubMed] [Google Scholar]
- 3.McCarthy MI, Zeggini E. Genome-wide association studies in type 2 diabetes. Curr Diab Rep 2009;9:164–171 [DOI] [PMC free article] [PubMed] [Google Scholar]
- 4.Schadt EE. Molecular networks as sensors and drivers of common human diseases. Nature 2009;461:218–223 [DOI] [PubMed] [Google Scholar]
- 5.Daley CM, Greiner KA, Nazir N, et al. All Nations Breath of Life: using community-based participatory research to address health disparities in cigarette smoking among American Indians. Ethn Dis 2010;20:334–338 [PMC free article] [PubMed] [Google Scholar]
- 6.Attvall S, Fowelin J, Lager I, Von Schenck H, Smith U. Smoking induces insulin resistance—a potential link with the insulin resistance syndrome. J Intern Med 1993;233:327–332 [DOI] [PubMed] [Google Scholar]
- 7.Targher G, Alberiche M, Zenere MB, Bonadonna RC, Muggeo M, Bonora E. Cigarette smoking and insulin resistance in patients with noninsulin-dependent diabetes mellitus. J Clin Endocrinol Metab 1997;82:3619–3624 [DOI] [PubMed] [Google Scholar]
- 8.Eliasson B, Attvall S, Taskinen MR, Smith U. Smoking cessation improves insulin sensitivity in healthy middle-aged men. Eur J Clin Invest 1997;27:450–456 [DOI] [PubMed] [Google Scholar]
- 9.Will JC, Galuska DA, Ford ES, Mokdad A, Calle EE. Cigarette smoking and diabetes mellitus: evidence of a positive association from a large prospective cohort study. Int J Epidemiol 2001;30:540–546 [DOI] [PubMed] [Google Scholar]
- 10.Manson JE, Ajani UA, Liu S, Nathan DM, Hennekens CH. A prospective study of cigarette smoking and the incidence of diabetes mellitus among US male physicians. Am J Med 2000;109:538–542 [DOI] [PubMed] [Google Scholar]
- 11.Eliasson B, Taskinen MR, Smith U. Long-term use of nicotine gum is associated with hyperinsulinemia and insulin resistance. Circulation 1996;94:878–881 [DOI] [PubMed] [Google Scholar]
- 12.Borowitz JL, Isom GE. Nicotine and type 2 diabetes. Toxicol Sci 2008;103:225–227 [DOI] [PubMed] [Google Scholar]
- 13.Millar NS, Harkness PC. Assembly and trafficking of nicotinic acetylcholine receptors (Review). Mol Membr Biol 2008;25:279–292 [DOI] [PubMed] [Google Scholar]
- 14.Changeux JP. Nicotine addiction and nicotinic receptors: lessons from genetically modified mice. Nat Rev Neurosci 2010;11:389–401 [DOI] [PubMed] [Google Scholar]
- 15.Saccone NL, Culverhouse RC, Schwantes-An TH, et al. Multiple independent loci at chromosome 15q25.1 affect smoking quantity: a meta-analysis and comparison with lung cancer and COPD. PLoS Genet 2010;6:e1001053. [DOI] [PMC free article] [PubMed] [Google Scholar]
- 16.Lee ET, Welty TK, Fabsitz R, et al. The Strong Heart Study. A study of cardiovascular disease in American Indians: design and methods. Am J Epidemiol 1990;132:1141–1155 [DOI] [PubMed] [Google Scholar]
- 17.Lee ET, Howard BV, Savage PJ, et al. Diabetes and impaired glucose tolerance in three American Indian populations aged 45-74 years. The Strong Heart Study. Diabetes Care 1995;18:599–610 [DOI] [PubMed] [Google Scholar]
- 18.Howard BV, Welty TK, Fabsitz RR, et al. Risk factors for coronary heart disease in diabetic and nondiabetic Native Americans. The Strong Heart Study. Diabetes 1992;41(Suppl. 2):4–11 [DOI] [PubMed] [Google Scholar]
- 19.Mellitus TECotDaCoD: Report of the Expert Committee on the Diagnosis and Classification of Diabetes Mellitus. Diabetes Care 2003;26(Suppl. 1):s5–s20 [DOI] [PubMed] [Google Scholar]
- 20.Matthews DR, Hosker JP, Rudenski AS, Naylor BA, Treacher DF, Turner RC. Homeostasis model assessment: insulin resistance and beta-cell function from fasting plasma glucose and insulin concentrations in man. Diabetologia 1985;28:412–419 [DOI] [PubMed] [Google Scholar]
- 21.Barrett JC, Fry B, Maller J, Daly MJ. Haploview: analysis and visualization of LD and haplotype maps. Bioinformatics 2005;21:263–265 [DOI] [PubMed] [Google Scholar]
- 22.Laird NM, Horvath S, Xu X. Implementing a unified approach to family-based tests of association. Genet Epidemiol 2000;19(Suppl. 1):S36–S42 [DOI] [PubMed] [Google Scholar]
- 23.Lange C, DeMeo D, Silverman EK, Weiss ST, Laird NM. PBAT: tools for family-based association studies. Am J Hum Genet 2004;74:367–369 [DOI] [PMC free article] [PubMed] [Google Scholar]
- 24.Zaykin DV, Zhivotovsky LA, Westfall PH, Weir BS. Truncated product method for combining P-values. Genet Epidemiol 2002;22:170–185 [DOI] [PubMed] [Google Scholar]
- 25.Demetrescu M, Hassler U, Tarcolea AI. Combining significance of correlated statistics with application to panel data. Oxf Bull Econ Stat 2006;68:647–663 [Google Scholar]
- 26.Sheng X, Yang J. Truncated product methods for panel unit root tests. Oxf Bull Econ Stat. In press [DOI] [PMC free article] [PubMed] [Google Scholar]
- 27.Sheng X, Yang J. Panel unit root test by combining dependent p-values: a comparative study. J Prob Stat 2011;2011:617652 [Google Scholar]
- 28.Hartung J. A note on combining dependent tests of significance. Biom J 1999;41:849–855 [Google Scholar]
- 29.Simes RJ. An improved Bonferroni procedure for multiple tests of significance. Biometrika 1986;73:751–754 [Google Scholar]
- 30.Gabriel SB, Schaffner SF, Nguyen H, et al. The structure of haplotype blocks in the human genome. Science 2002;296:2225–2229 [DOI] [PubMed] [Google Scholar]
- 31.Wang K, Li M, Hakonarson H. Analysing biological pathways in genome-wide association studies. Nat Rev Genet 2010;11:843–854 [DOI] [PubMed] [Google Scholar]
- 32.Li MD, Xu Q, Lou XY, Payne TJ, Niu T, Ma JZ. Association and interaction analysis of variants in CHRNA5/CHRNA3/CHRNB4 gene cluster with nicotine dependence in African and European Americans. Am J Med Genet B Neuropsychiatr Genet 2010;153B:745–756 [DOI] [PMC free article] [PubMed] [Google Scholar]
- 33.Saccone NL, Wang JC, Breslau N, et al. The CHRNA5-CHRNA3-CHRNB4 nicotinic receptor subunit gene cluster affects risk for nicotine dependence in African-Americans and in European-Americans. Cancer Res 2009;69:6848–6856 [DOI] [PMC free article] [PubMed] [Google Scholar]
- 34.Liu JZ, Tozzi F, Waterworth DM, et al. Wellcome Trust Case Control Consortium Meta-analysis and imputation refines the association of 15q25 with smoking quantity. Nat Genet 2010;42:436–440 [DOI] [PMC free article] [PubMed] [Google Scholar]
- 35.Albanes D, Jones DY, Micozzi MS, Mattson ME. Associations between smoking and body weight in the US population: analysis of NHANES II. Am J Public Health 1987;77:439–444 [DOI] [PMC free article] [PubMed] [Google Scholar]
- 36.Eisen SA, Lyons MJ, Goldberg J, True WR. The impact of cigarette and alcohol consumption on weight and obesity. An analysis of 1911 monozygotic male twin pairs. Arch Intern Med 1993;153:2457–2463 [PubMed] [Google Scholar]
- 37.Mineur YS, Abizaid A, Rao Y, et al. Nicotine decreases food intake through activation of POMC neurons. Science 2011;332:1330–1332 [DOI] [PMC free article] [PubMed] [Google Scholar]
- 38.Shimokata H, Muller DC, Andres R. Studies in the distribution of body fat. III. Effects of cigarette smoking. JAMA 1989;261:1169–1173 [PubMed] [Google Scholar]
- 39.Barrett-Connor E, Khaw KT. Cigarette smoking and increased central adiposity. Ann Intern Med 1989;111:783–787 [DOI] [PubMed] [Google Scholar]
- 40.Kahn SE, Hull RL, Utzschneider KM. Mechanisms linking obesity to insulin resistance and type 2 diabetes. Nature 2006;444:840–846 [DOI] [PubMed] [Google Scholar]
- 41.Ross R, Després JP. Abdominal obesity, insulin resistance, and the metabolic syndrome: contribution of physical activity/exercise. Obesity (Silver Spring) 2009;17(Suppl. 3):S1–S2 [DOI] [PubMed] [Google Scholar]
- 42.Simon JA, Seeley DG, Lipschutz RC, Vittinghoff E, Browner WS. The relation of smoking to waist-to-hip ratio and diabetes mellitus among elderly women. Prev Med 1997;26:639–644 [DOI] [PubMed] [Google Scholar]
- 43.Gonçalves RB, Coletta RD, Silvério KG, et al. Impact of smoking on inflammation: overview of molecular mechanisms. Inflamm Res 2011;60:409–424 [DOI] [PubMed] [Google Scholar]
- 44.Morrow JD, Frei B, Longmire AW, et al. Increase in circulating products of lipid peroxidation (F2-isoprostanes) in smokers. Smoking as a cause of oxidative damage. N Engl J Med 1995;332:1198–1203 [DOI] [PubMed] [Google Scholar]
- 45.Wright E, Jr, Scism-Bacon JL, Glass LC. Oxidative stress in type 2 diabetes: the role of fasting and postprandial glycaemia. Int J Clin Pract 2006;60:308–314 [DOI] [PMC free article] [PubMed] [Google Scholar]
- 46.Wellen KE, Hotamisligil GS. Inflammation, stress, and diabetes. J Clin Invest 2005;115:1111–1119 [DOI] [PMC free article] [PubMed] [Google Scholar]
- 47.Jo YH, Talmage DA, Role LW. Nicotinic receptor-mediated effects on appetite and food intake. J Neurobiol 2002;53:618–632 [DOI] [PMC free article] [PubMed] [Google Scholar]
- 48.Marrero MB, Lucas R, Salet C, et al. An alpha7 nicotinic acetylcholine receptor-selective agonist reduces weight gain and metabolic changes in a mouse model of diabetes. J Pharmacol Exp Ther 2010;332:173–180 [DOI] [PubMed] [Google Scholar]
- 49.McNaughton SA, Mishra GD, Brunner EJ. Dietary patterns, insulin resistance, and incidence of type 2 diabetes in the Whitehall II Study. Diabetes Care 2008;31:1343–1348 [DOI] [PMC free article] [PubMed] [Google Scholar]
- 50.Sargeant LA, Khaw KT, Bingham S, et al. Cigarette smoking and glycaemia: the EPIC-Norfolk Study. European Prospective Investigation into Cancer. Int J Epidemiol 2001;30:547–554 [DOI] [PubMed] [Google Scholar]