

Abstract
Non-technical summary
Cough is the commonest symptom for which people seek medical advice and has significant impact upon quality of life. Moreover ineffective coughing is associated with significant morbidity and mortality. A better understanding of cough mechanics is important for dealing with the complications of both excessive and impaired cough. This study investigates how the mechanical changes during coughing are influenced by the amount of air inhaled prior to coughing (operating volume), examining chest and abdominal motion, pressures and flow. We have shown that operating volume is the most important determinant of the flow achieved and volume expelled during single voluntary coughs and peals of voluntary coughs. Coughs within a peal appear to have a different motor pattern, producing similar pressures and flows but more rapidly than single coughs and therefore may be more efficient. Future studies investigating cough mechanics should control for the influence of operating volume.
Abstract
Coughing both protects the airways from foreign material and clears excessive secretions in respiratory diseases, and therefore requires high expiratory flows. We hypothesised that the volume inspired prior to coughing (operating volume) would significantly influence the mechanical changes during coughing and thus cough flow. Sixteen healthy volunteers (6 female, mean age 31 ± 10 years) performed six single voluntary coughs from four different operating volumes (10%, 30%, 60% and 90% of vital capacity) followed by three peals of voluntary and citric acid-induced coughs. During coughing we simultaneously measured (i) chest and upper abdominal wall motion using opto-electronic plethysmography (OEP), (ii) intra-thoracic and intra-abdominal pressures with a balloon catheter in each compartment and (iii) flow at the mouth. Operating volume was the most important determinant of the peak flow achieved and volume expelled during coughing, but had little influence on the pressures generated. The duration of single coughs increased with operating volume, whereas coughs were much shorter and varied little during peals. Voluntary cough peals were also associated with significant blood shift away from the trunk. In conclusion, this study has shown that operating volume is the most important determinant of cough peak flow and volume expelled in healthy individuals. During peals of coughs, similar mechanical effects were achieved more rapidly, suggesting a modification of the motor pattern with improved efficiency. Future studies investigating cough mechanics in health and disease should control for the influence of operating volume.
Introduction
Cough is the commonest symptom for which people seek medical advice and is associated with significant impact upon quality of life. Whilst the mechanical changes that occur during coughing are responsible for the detrimental physical effects of excessive coughing they are also essential for protection and clearance of the airway. Indeed, impaired cough function is associated with significant morbidity and mortality. A better understanding of the mechanical processes involved in coughing is therefore important for developing treatments for both conditions characterised by ineffective coughing, such as after stoke or with neuromuscular disease, and also excessive coughing as occurs in patients with isolated chronic cough. In health cough protects the airways from inhaled foreign material and in illness coughing clears excess mucus secretions. To perform these functions, a high expiratory flow rate is needed to produce sufficient shearing force at the airway surface. This high flow is generated by forceful contraction of the expiratory muscles which produce large pressure swings within the chest and abdomen.
Classically cough is considered to involve three phases: (i) an inspiration, (ii) a compressive phase, where the muscles of expiration contract against a closed glottis and (iii) an expulsive phase where the glottis suddenly opens and air is rapidly expelled (Guyton & Halls, 1995)). The study of voluntary coughing has shown that intra-thoracic pressures cause dynamic compression of the major airways during the expulsive phase, displacing additional air and reducing the airway diameter (Ross et al. 1955)). This results in flows exceeding those generated during maximal forced expiratory manoeuvres, known as ‘supra-maximal’ flows (Knudson et al. 1974)). The volume inspired prior to coughing may also be an important determinant of cough flow as when partially curarized healthy volunteers were studied performing voluntary coughing, the progressive expiratory muscle weakness decreased expiratory pressures, but expiratory flows were well preserved until the highest dose of d-tubocurare when the volume inspired prior to coughing was significantly reduced (Arora & Gal, 1981)).
It has been suggested that coughing can occur from as little as 50% of tidal volume to 50% of vital capacity (McCool, 2006)) but the lung volumes from which spontaneous coughing occurs are unknown. Moreover few studies have controlled for the effect of inspiratory volume (or ‘operating’ volume) on cough mechanics; indeed, until recently it has been difficult to accurately measure lung volume changes during coughing. The operating volume has the potential to significantly influence the flows generated during coughing by affecting both the volume of air that can be expelled during the cough and the expiratory muscle length prior to coughing and therefore the efficiency of contraction. Studies of respiratory muscle activity during voluntary and reflex cough have generally investigated coughs from a fixed operating volume e.g. functional residual capacity (Lavietes et al. 1998; Lasserson et al. 2006)) or not controlled operating volume at all (Fontana et al. 1997)).
Opto-electronic plethysmography (OEP) provides an accurate, non-invasive method of determining the volume of the trunk (Cala et al. 1996)) and the contribution of the different compartments during coughing. Additionally, this method allows the computation of the degree of gas compression and blood shift from the thorax during respiratory manoeuvres (Iandelli et al. 2002; Chiumello et al. 2007)), which may be relevant to cough syncope (Sharpey-Schafer, 1953)).
We hypothesised that the volume inspired prior to coughing (operating volume) would significantly influence the mechanical changes during the expiratory phase of coughing and therefore cough peak flow. To test this idea we studied the effect of increasing operating volume on trunk movement, peak pressures, peak flow and volume change during single voluntary coughs in healthy individuals. In addition we explored whether these relationships differed during peals of voluntary coughs and coughs induced by citric acid, a method widely used in the investigation of cough physiology.
Methods
Ethical approval
The study was approved by the Local Research Ethics Committee (Tameside and Glossop Research Ethics Committee, 06/Q1402/61), all participants gave written informed consent and the study was performed in accordance with the Declaration of Helsinki.
Subjects
Adult healthy volunteers were recruited from hospital staff and researchers. We studied 16 healthy volunteers (10 male, 6 female, mean age 31 ±10 years) who did not complain of cough. All subjects were non-smokers, on no medication and were studied at least 4 weeks from any upper respiratory tract infection. We intended to recruit approximately equal numbers of males and females and no restrictions were made upon age or body mass index. All subjects had normal spirometry, BMI within normal limits and measureable cough reflex sensitivity to citric acid. Table 1 summarises the subject characteristics.
Table 1.
Demographics of subjects
| Mean ± SD | |
|---|---|
| Age | 31 ± 10 |
| Sex (M:F) | 10:6 |
| Height (cm) | 177 ± 11 |
| Weight (kg) | 73 ± 13 |
| Forced expiratory volume in 1 s (l) | 4.1 ± 1.1 |
| Vital capacity (l) | 4.8 ± 1.3 |
| Inspiratory capacity (l) | 3.0 ± 0.9 |
| Residual volume (l) | 2.1 ± 0.7 |
Measurements
Spirometry and flow
Spirometry and plethysmographic lung volumes were measured to ATS/ERS standards (Miller et al. 2005)) prior to the experiment (ZAN 500, nSpire Health, Louisville, CO, USA). During the experiment, flow was measured at the mouth using a symmetrically disposed Pitot tube flowmeter (Medical Graphics, St Paul, MN, USA) with a linear response up to 18 l s−1.
Cough reflex sensitivity
Prior to the experiment, cough reflex sensitivity to citric acid was measured according to ERS guidelines (Morice et al. 2007)) using the single breath inhalation technique (for details see online Supplemental material). The concentration of citric acid inducing at least five coughs (C5) was recorded and this concentration was inhaled during the experiment to induce coughing. Subjects coughing on inhalation of placebo were excluded from further study.
Opto-electronic plethysmography
Kinematics of the trunk were measured by opto-electronic plethysmography (OEP System, BTS, Milan, Italy). This method is described in detail elsewhere (Cala et al. 1996; Aliverti et al. 2000)). Briefly, OEP measures changes in the trunk surface during breathing and other respiratory manoeuvres. Eighty-nine reflective markers are placed on the trunk of the subject according to precise anatomical reference points (see Supplemental Fig. S1). The three dimensional locations of these markers and any change in their position is captured by six TV cameras (3 in front and 3 behind the subject) operating at 60 frames per second, synchronised with coaxial infrared flashing LEDs. The three-dimensional coordinates of the markers are calculated with stereo-photogrammetry and linked to form a mesh of triangles representing the surface of the trunk. The volume contained by this surface is computed using Gauss’ theorem.
Oesophageal and gastric pressures
In all subjects, standard balloon-tipped catheters were inserted via one nostril into the stomach and oesophagus (Jaeger, Wurzburg, Germany) and were connected to pressure transducers (MP45, Validyne, USA) for recording oesophageal (Poes) and gastric (Pgas) pressures, which were used as indices of pleural (Ppl) and abdominal (Pab) pressures. Trans-diaphragmatic pressure (Pdi) was calculated as the difference between Pgas and Poes. Balloon position was checked by a method previously described (Baydur et al. 1982)).
Protocol
All assessments were made on a single study day. Clinical review, measurement of spirometry, plethysmographic lung volumes and cough reflex sensitivity to citric acid were performed first. After a short break (approximately 30 min) subjects were prepared for main study data collection. Subjects were seated, reflective markers placed on the trunk and balloon catheters positioned (see Supplemental Fig. S1). Once comfortable, subjects were asked to perform three slow vital capacity (VC) manoeuvres followed by 3 min of quiet breathing to establish baseline values for the trunk volumes and thoracic and abdominal pressures. Signals representing pressure, flow and trunk motion changes were collected simultaneously and recorded on a personal computer. After assessing the baseline values, each subject performed single voluntary coughs, peals of voluntary coughs and citric acid-induced coughs as described below. The whole protocol took approximately 2–2.5 h to complete.
Single voluntary coughs
Coughs were performed from four different operating volumes (specifically 10%, 30%, 60% and 90% of vital capacity (VC), six coughs at each volume); subjects found coughing from 100% VC unpleasant and hence 90% was used as the maximum. The operating volume was controlled using custom-written software displaying volume changes from the output signal from a spirometer (Morgan Ltd, Rainham, UK) (see Supplemental Fig. S2). Subjects were instructed to perform a deep inspiration from the spirometer to total lung capacity (TLC) (volume as determined by integration of the flow at the mouthpiece) and then to breathe out until the desired operating volume was reached. The changes in volume were displayed throughout on a screen and the required operating volumes represented by a horizontal line on the visual display, calculated from the maximum slow VC manoeuvre (see Supplemental Fig. S2). Once the desired operating volume was reached, the software sounded an alarm and displayed the instruction ‘Cough’. Subjects were instructed to perform a single voluntary cough (without taking any further breath in or out) into the spirometer; a nose-clip was worn throughout each manoeuvre. They were not instructed to perform a maximal cough; instead they were coached to use a consistent effort, as preliminary experiments found maximal coughing produced less reliable results, introducing vocal cord-related artefacts.
Peals of voluntary coughs
Subjects again inhaled to TLC and then exhaled to 90% of VC. This was followed by a peal of voluntary coughs. Subjects were instructed to cough repeatedly, until they could cough no more, without taking a further breath in. If a further inspiration was taken, subsequent coughs were considered to be a separate peal and not used in the analysis. This manoeuvre was repeated 3 times.
Induced coughs
Subjects were instructed to perform a full inhalation from the dosimeter (i.e. to TLC) which contained citric acid at the concentration previously shown to induce at least five coughs. Flow could not be measured during induced coughing as the mouthpiece had to be removed to allow citric acid inhalation from the dosimeter. This manoeuvre was repeated 3 times. The first peal of coughs after the initial inhalation was analysed. If a further inspiration was taken, subsequent coughs were considered to be a separate peal and excluded from the analysis.
Data analysis
The cough events and the phases within each event were defined by changes in the flow measured at the mouth (see Fig. 1)). Following the volume-setting manoeuvre (i.e. inspiration to TLC, then expiration to the desired operating volume (Fig. 1A, time points 1–3), the compressive and expulsive phases of cough were identified. The compressive phase (Fig. 1A, time points 3–4) was defined by absent flow, during which the pressure rose as the trunk volume began to fall. This was followed by the expulsive phase (Fig. 1A, time points 4–5), where flow rapidly increased with a further fall in trunk volume, and peak oesophageal and gastric pressures were reached. The end of the expulsive phase was defined as the return to zero flow. As can be seen in Fig. 1B, cough peals consisted of multiple compressive–expulsive phases and the number of these phases varied for each cough peal, both within and between individuals. Therefore to characterise cough peals, measures were made on the first, middle and last coughs using the same criteria as for single coughs. The same process was used to characterise the citric acid-induced coughs.
Figure 1. Signals collected: flow at the mouth, trunk volume (Vtr), oesophageal (Poes) and gastric (Pgas) pressures during single voluntary cough (A) and voluntary peal of coughs (B).
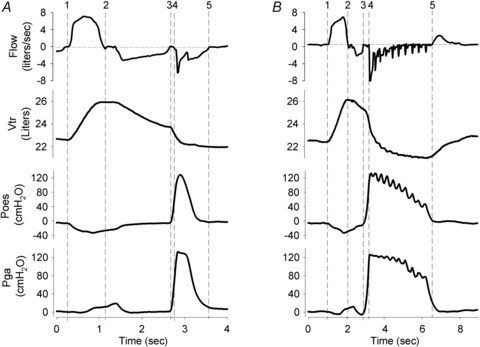
The volume setting procedure required inspiration to TLC (1–2) followed by expiration to the required operating volume (2–3). In A the subject then performed a single voluntary cough, consisting of a compressive phase (3–4) and expulsive phase (4–5). In B a peal of coughs was performed, each containing a compressive/expulsive phase, with the final expulsive phase completing at point 5.
Modelling of the trunk
The trunk was modelled in three compartments: pulmonary rib cage (RCp), abdominal rib cage (RCa) and abdomen (Ab). Thus, the total volume displaced by the trunk (VTR) was calculated as the sum of the volumes occupied by the individual three compartments (VRCp+VRCa+VAb). The boundaries between the three compartments were represented by the xiphoid process (between RCp and RCa) and the costal margin (between RCa and Ab). Changes in the volume displaced by the total trunk (ΔVTR) and the separate compartments (ΔVRCp, ΔVRCa and ΔVAb) were expressed as percentages of each subjects vital capacity (as measured in the body box) and also as a percentage of the volume inhaled prior to coughing (operating volume) for voluntary coughs.
Analysis of pressure, flow and volume traces
For each subject at each operating volume, the mean value of six repetitions was calculated for the peak pressure, peak expiratory flow and change in volume derived from the movement of the total trunk and the three sub-compartments. For the peals of coughs, the same parameters were measured in the first, middle and final cough of each peal, representing decreasing operating volumes.
Cough phase duration
From the signals collected, the distinct phases of single voluntary coughs can be observed and were defined as described above. The effect of operating volume on the duration of these phases and the trunk motion during each phase was examined.
Calculation of gas compression and blood shift
During coughing, the abrupt rise in pressure compresses the gas inside the thorax and pushes blood out of the trunk to the limbs. Therefore, the total change in volume measured with OEP (ΔVTR) represents not only the expired air (ΔVEXP) but also the decrease in volume due to gas compression (ΔVCOMP) and blood shift to the extremities (ΔVBLOOD):
| 1 |
ΔVEXP can be calculated by integrating the flow measured at the mouth and ΔVCOMP can be estimated from Boyle's law for isothermal transformations. According to this law, the pressure of an ideal gas at constant temperature varies inversely with the volume. Applying this law to pressure and volume changes in the lungs we can assume that the product of the volume of air in the lungs (VL) and of the pressure acting on the lungs (alveolar pressure, Palv) is constant. Therefore:
| 2 |
Expanding eqn (2):
 |
3 |
The initial Palv can be assumed to be equal to atmospheric pressure and ΔPalv equal to the change in pleural and therefore oesophageal pressure (measured by the balloon). The volume of air in the lungs (VL) can be obtained from the body plethysmography measurement of total gas volume (TGV) and using the baseline values from OEP measurement at functional residual capacity (FRC), the volume measured with OEP can be referenced to the absolute volume of air present in the lungs. Additionally, ΔPalv×ΔVCOMP can be assumed to be a very low value and therefore excluded from the equation. Rearranging eqn (3) we obtain the volume variation due to gas compression:
| 4 |
Replacing the value obtained in eqn (4) in eqn (1) we can obtain the volume displacement due to gas compression by subtracting ΔVCOMP and ΔVEXP from ΔVTR.
| 5 |
Statistical analysis
Statistical analyses were performed using SPSS (version 15.0, Chicago, IL, USA) and graphs were generated by Prism (version 5, GraphPad Software Inc., CA, USA) and Sigma Plot (Systat Software, Inc., IL, USA). Using general estimating equations (GEE), the influence of operating volume on cough peak flow, pressures and trunk volume changes were examined. The volume changes in the individual compartments of the trunk volume were also explored, as were changes in cough phase duration. Mean values and 95% confidence intervals were derived from the GEE models and the Bonferroni correction applied to the post hoc pairwise comparisons. The standard 5% level was used for statistical significance throughout.
Results
Participants
Trunk movement, volume and flow measurements were recorded in all subjects but oesophageal and gastric pressure changes were un-interpretable for eight subjects during single coughs, due to artefacts from oesophageal contractions. In the subsequent analyses sex, age and BMI were not significant influences.
Single voluntary coughs
Trunk volume change during cough
The change in trunk volume during single voluntary coughs (compressive plus expulsive phases) increased as the operating volume increased i.e. as volume inhaled prior to coughing increased, the volume expelled during cough also increased (P < 0.001) (Fig. 2A)). There were significant differences with each increment in operating volume from 10 to 90% VC (mean ΔVTR (95% CI) expressed as a percentage of vital capacity 3.5% (2.2–4.8) vs. 13.5% (10.9–16.1) vs. 32.1% (28.1–36.1) vs. 50.4% (43.2–57.6), P < 0.001 for all comparisons; Fig. 2A)). The change in volume of the individual compartments also significantly increased with operating volume (pulmonary ribcage (ΔVRCp, P < 0.001), abdominal ribcage (ΔVRCa, P < 0.001) and abdomen (ΔVAb, P < 0.001)) but the relative contribution of each compartment to the total change in trunk volume was very similar at all operating volumes (Fig. 2A)). As operating volumes increased, a greater proportion of the operating volume was expelled during the cough, but only from operating volumes above 30% VC (10%, 30% < 60% < 90%, P < 0.002; Fig. 2B)).
Figure 2. Changes in trunk volume.
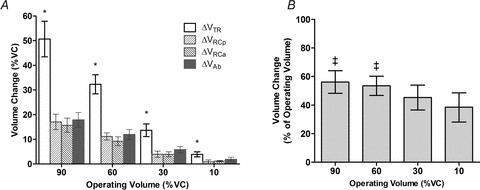
A, changes in trunk volume during single voluntary coughs from increasing operating volume, expressed as a percentage of vital capacity, mean ± 95%CI (n= 16). Volume change is shown for the total trunk ΔVTR and the individual compartments, pulmonary rib cage ΔVRCp, abdominal rib cage ΔVRCa and the abdomen ΔVAb. *Significant differences for all pairwise comparisons P < 0.001 (after Bonferroni correction). B, changes in trunk volume during single voluntary coughs expressed as a proportion of the operating volume (n= 16). ‡Significant increases in the proportion of operating volume expelled above that for 10% of VC.
Flow and pressure during cough
Peak flow also significantly increased with increasing operating volume (P < 0.001) with significant differences with each increment (mean peak flow (95% CI) 1.75 l s−1 (1.54–1.96) vs. 2.76 l s−1 (3.34–3.19) vs. 4.70 l s−1 (4.25–5.15) vs. 6.26 l s−1 (5.44–7.08), P < 0.001 for all comparisons; Fig. 3B)). In contrast, the peak gastric (P= 0.22) and oesophageal (P= 0.057) pressures did not change significantly (Fig. 3C)), nor did trans-diaphragmatic pressure (P= 0.054).
Figure 3. Effect of operating volume on changes in trunk volume, peak flow and peak pressures in the abdomen and chest for single voluntary coughs (A–C) and during peals of voluntary coughs (D–F).
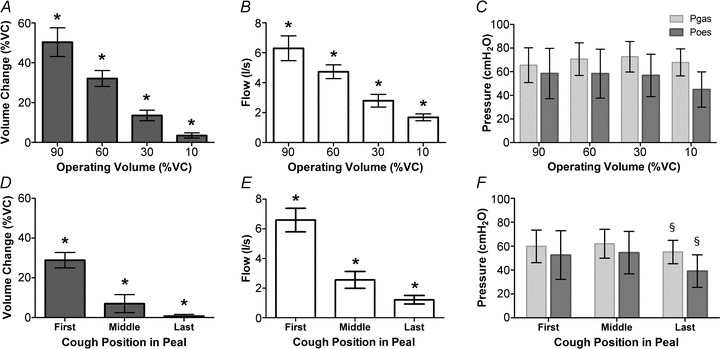
Values are mean ± 95%CI. Note for peals, the x axis displays the coughs in order of decreasing operating volume to allow comparison with single coughs i.e. the first, middle and then last cough. *Significant differences for all pairwise comparisons, P < 0.001 (after Bonferroni correction). §Significant differences for all pairwise comparisons, P≤ 0.001 (after Bonferroni correction). For volume, flow and Pgas measurements, n= 16 whereas for Poesn= 8.
Compressive and expulsive phases of cough
The duration of coughs significantly increased with operating volume (mean (95% CI) cough duration 423 ms (330–515) vs. 668 ms (558–778) vs. 808 ms (673–943) vs. 1019 ms (910–1128), P < 0.001), as a result of lengthening of the expulsive phase (see Fig. 4A)). The compressive phase was significantly longer for coughs from 10% compared with those from 30% of VC (P= 0.007), but otherwise there were no significant differences. The volume displacement during both the compressive and expulsive phases significantly increased with operating volume (both P < 0.001); however, that occurring during the compressive phase (which is only due to gas compression and blood shift) progressively decreased as a proportion of the total change in trunk volume (Fig. 4B)).
Figure 4. Effect of operating volume on the compressive and expulsive phases of voluntary coughs.
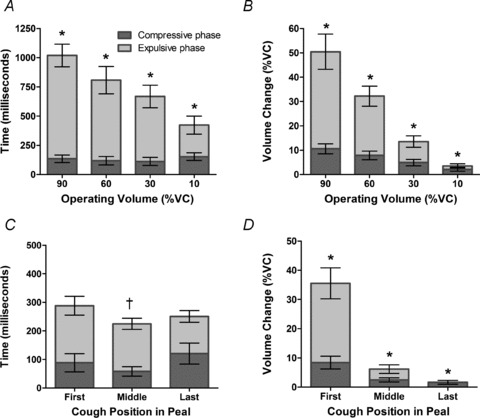
A shows effect on duration in single coughs; *significant differences for all pairwise comparisons, P < 0.001 for total cough duration and expulsive phase duration but not compressive phase duration. C shows effect on duration in peals of coughs; †significant fall in total cough duration. The volume changes during these phases are shown in B for single coughs; *significant differences for all pairwise comparisons, P < 0.001 for volume change during expulsive and compressive phases and peals of coughs (D); *significant differences for all pairwise comparisons, P < 0.001 for volume change during expulsive and compressive phases. All data are mean ± 95%CI (n= 16).
Predictors of peak flow during single voluntary coughs
Using univariate analyses, cough peak flow was significantly predicted by the operating volume (P < 0.001), Poes (P= 0.014) but not Pgas (P= 0.085). However, in a multivariate analysis, only operating volume continued to independently predict cough peak flow (P < 0.001) (Poes (P= 0.16), Pgas (P= 0.13)).
Peals of voluntary coughs
A median of eight coughs occurred per cough peal (range 4–21) and the patterns of peak flow, pressure and volume change during cough peals were very similar to those observed during single coughs as operating volumes decreased (Fig. 3D–F)). Direct statistical comparisons with single coughs were not made beyond the first cough at 90% VC, where volumes were known to be comparable.
Trunk volumes changes during cough peals
During cough peals the changes in trunk volume significantly decreased from first to last cough of the peal, i.e. as the operating volume reduced (mean ΔVTR (95% CI) expressed as a percentage of vital capacity 28.9% (25.0–32.8) vs. 7.0% (2.5–11.6) vs. 0.8% (0.0–1.6), P < 0.001; Fig. 3D)). The volume change for the first cough in each peal (high operating volume) was less than for single coughs from the same operating volume (90% VC), P < 0.001.
Peak flow and pressure during cough peals
Peak flow also significantly decreased from the first to last cough in the peal, as operating volume also decreased (mean peak flow (95% CI) 6.59 l s−1 (5.82–7.36) vs. 2.55 l s−1 (1.99–3.11) vs. 1.21 l s−1 (0.93–1.50), P < 0.001 for all comparisons) and was comparable for the first cough with that for single coughs from 90% VC (Fig. 3E)). The peak gastric and oesophageal pressures were similar for the first and middle coughs of the peals but were significantly reduced in the last coughs (P= 0.001 and P < 0.001, respectively), although the absolute differences were small (Fig. 3F)). Overall the pressures generated during the cough peal were of a similar magnitude to those observed for single voluntary coughs from decreasing operating volume. However, the trans-diaphragmatic pressure was significantly elevated at the end of cough peals at low lung volumes compared to medium or high volumes (mean Pdi 7.3 cmH2O (–9.3 to 23.9) vs. 7.5 cmH2O (–8.1 to 23.0) vs. 16.0 cmH2O (4.1 to 27.9), P= 0.008 for last compared to middle cough).
Compressive and expulsive phases in cough peals
The most striking difference between single coughs and coughs occurring as components of a cough peal is the duration, with the latter being substantially shorter in duration (mean (95% CI) cough duration first 288 ms (233–343) vs. middle 224 ms (197–253) vs. last 251 ms (211–291)). Compared with single coughs, the durations of coughs (and their compressive and expulsive phases) were relatively stable throughout the cough peal as operating volume fell, although there was a small but significant fall from the first to middle cough (Fig. 4C)). As for single coughs, the expulsive phase volume change accounted for the majority of the volume change during coughing, especially at larger operating volumes (Fig. 4D)).
Predictors of peak flow during cough peals
Using univariate analyses, cough peak flow was significantly predicted by the cough order (first, middle or last) i.e. decreasing operating volume (P < 0.001), Poes (P= 0.003) and Pgas (P= 0.002). In a multivariate analysis, operating volume (P < 0.001) and gastric pressure (Pgas, P= 0.01) continued to independently predict cough peak flow, unlike oesophageal pressure (Poes, P= 0.25).
Gas compression and blood shift during cough peals
Since gas compression and blood shift are likely to be most relevant during prolonged coughing it was decided to focus this analysis on the peals of voluntary coughs. An example of the volume tracings of trunk, integrated flow at the mouth and calculated gas compression and blood shift in an individual subject during a voluntary cough peal is shown in Fig. 5A. At the end of the first compressive phase (no expiratory flow), trunk volume decreased by a mean 675 ml (SD ± 219). Of this volume, 325 ml was due to gas compression and the remaining 350 ml due to blood shift. By the end of the peal of coughs, trunk volume had fallen by a mean of 4300 ml; gas compression accounted for just 330 ml (i.e. is similar to the compressive phase) and blood shift 613 ml, the remainder being due to the air expired (Fig. 5B)).
Figure 5. Volume tracings of trunk, integrated flow at the mouth, gas compression and blood shift during a peal of cough in an individual subject (A). Mean volume variation of trunk, integrated flow at the mouth, gas compression and blood shift during peals of cough for all subjects (B).
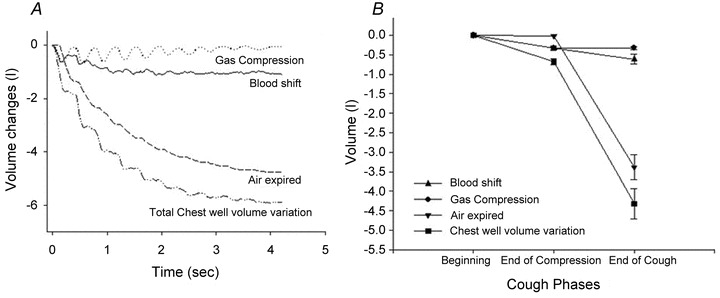
Values are taken at the end of the first compression phase and at the end of cough peal.
Peals of citric acid-induced coughs
The median number of coughs induced by citric acid inhalation was 3 (range 1–10) per peal. For citric acid-induced coughs the initial operating volume was not controlled but could be calculated from the trunk motion during inspiration from the dosimeter. Although subjects were instructed to inhale fully (i.e. to TLC) we observed that most were unable, due to the onset of uncontrollable coughing. The mean initial operating volume achieved for induced coughs was 61.7% (SD ± 19.5%) of vital capacity.
Trunk volume changes during induced cough peals
The change in trunk volume during citric acid-induced cough peals decreased with the operating volume i.e. from the first to last cough of the peal (P < 0.001) (see Fig. 6A)). Note the variability in VTR for the first cough, which is most probably due to variability in starting volume.
Figure 6. Volume changes (A) and peak pressures (B) during citric acid-induced cough peals, for first, middle and last coughs of peal i.e. high to low operating volume.
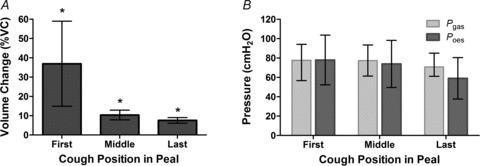
Values are mean ± 95%CI. *Significant differences for all pairwise comparisons of operating volume but pressure measures did not change significantly. For volume and Pgas measurements, n= 16 whereas for Poes, n= 8.
Pressure during induced cough peals
Pressures achieved during citric acid-induced cough peals were similar to those seen during voluntary coughs (see Fig. 6B)).
Discussion
As far as we are aware, this study is the first to specifically examine the influence of operating volume on the volume changes, peak flows and pressures generated during voluntary coughing. We have shown that the volume inspired prior to coughing is an important determinant of both the peak flow achieved and volume expelled, but has little influence on the pressures generated in the chest and abdomen. This holds true for both single voluntary coughs and during the course of voluntary peals of coughing. We have also demonstrated that the duration of single coughs increases with operating volume, mainly due to lengthening of the expulsive phase. In contrast, coughs are much shorter in duration when occurring as part of a peal, and their length varies little as the peal progresses and operating volume falls. Moreover, peals of voluntary coughing were associated with significant blood shift away from the trunk in addition to compression and expulsion of thoracic gas. The patterns of pressure and volume change seen were similar in peals of coughing induced by inhalation of citric acid to those performed voluntarily, although initial operating volume was much lower.
Previous studies have investigated the determinants of cough peak flow but generally only from a fixed operating volume. Lavietes et al. (1998) compared peak oesophageal pressures with peak flows during voluntary single coughs from FRC with varying effort. As in this study, peak oesophageal pressure poorly correlated with cough peak flow. As a consequence, they hypothesised that cough flow was determined by lung recoil and airway resistance rather than the thoracic pressure generated. Our finding that the operating volume, rather than peak pressure in the chest or abdomen, significantly predicted cough peak flow in single coughs supports this notion; at larger operating volumes lung recoil will be high and airway resistance low, maximising flow, whereas at low operating volumes lung recoil is low and air resistance high, reducing flow.
Of note, we found all compartments (pulmonary ribcage, abdominal ribcage and abdomen) contributed equally to the volume changes during single coughs, regardless of the operating volume. This implies co-ordinated muscle activity allowing the trunk to operate as a single compartment during the expulsive phase of cough. To date only one previous study that we are aware of has used OEP in the study of voluntary cough in healthy volunteers, investigating rib cage distortion during coughing after a maximal inspiration (Lanini et al. 2007)). Mild to moderate rib cage distortions were detected but did not exhibit a consistent pattern, with some subjects having no distortion, whilst in others opposing patterns of distortion occurred. Although this would appear to contrast with our findings of equal contributions of the trunk compartments, distortion was only studied in coughs following a maximum inspiration. We did not study such high operating volumes as our subjects complained this was difficult and unpleasant; instead we choose more physiologically appropriate volumes which may have facilitated more co-ordinated muscle action during coughing.
It is notable that we did not observe any effects of sex, age or BMI on OEP parameters in this study. Other investigators have reported that during quiet breathing, female subjects, having a smaller abdominal contribution to tidal breathing (Romei et al. 2010)), respond differently to exercise compared with males (Layton et al. 2011)). However, this may be a consequence of our sample size, as OEP studies finding significant differences between the sexes tend to have double the sample size of our study. Additionally, many of the differences seen in ventilatory kinematics between men and women are due to differences in dimension. As the main aim of our study was to describe the influence of operating volume during coughing, we expressed all volume changes normalised to the subject's vital capacity; hence differences in dimension cannot be appreciated. Further studies though, specifically addressing sex influences, would be of interest.
This study investigated volume changes not only for single voluntary coughs but also peals of coughing, which frequently occur in disease states; for example, in chronic cough patients, coughing typically occurs in peals containing an average of two to three explosive cough sounds (Kelsall et al. 2008)), corresponding to the expulsive phases in this study. Our data suggest that the changes in volume, peak flow and pressure are broadly similar in single coughs from decreasing lung volumes to the dynamic changes during a peal of coughs. Interestingly, the coughs comprising a peal achieved similar effects to single coughs but over a considerably shorter time. This may be more efficient for airway clearance/protection, developing a series of high flows more rapidly than for a series of single coughs, and without intervening inspiratory phases. This different motor pattern may in part explain why the predictors of cough peak flow were changed during cough peals compared with single coughs, with gastric pressure a significant independent predictor in addition to operating volume (represented by cough order).
Although our measures of citric acid-induced coughing were limited, it is interesting that the volume and pressure changes we observed were very similar to those in voluntary peals, although the number of coughs per peal was less. However, the variability of cough parameters was increased, which could reflect the poorly co-ordinated muscle activation previously reported for tartaric acid-induced coughing (Lasserson et al. 2006)) but equally may be due to the variability of the operating volume from which the cough peals were initiated as in our experience the urge to cough frequently limited the inspiration possible prior to coughing.
One study comparing EMG in single voluntary coughs from FRC with pairs of tartaric acid-induced coughs from unknown volumes also suggested that motor pattern was altered in tartaric acid-induced coughs with muscle activation greater in magnitude but shorter in duration (Lasserson et al. 2006)). The authors proposed that the differences arose from the reflex activation compared to voluntary activation of coughing. However, our observations in voluntary peals of cough were consistent with a similar change in cough motor pattern, with shorter cough duration but preserved pressures and peak flows implying reflex activation may not be necessary to evoke this response.
In addition to measuring volume changes during coughing we were also able to calculate blood shift out of the trunk. Coughing is known to be associated with reductions in carotid artery (Desser et al. 1976)) and cerebral blood flow (Mattle et al. 1995; Chao et al. 2007)), hypotension and bradycardia (Benditt et al. 2005; Chao et al. 2007)), and on occasion can result in syncope. Whilst this study cannot shed light on the underlying mechanisms in cough syncope, it does suggest that during a peal of voluntary coughing significant haemodynamic shifts occur. In healthy individuals, more than half a litre of blood was forced out of the trunk, which is likely to be an important contributing factor. Recent studies have also found that even during quiet breathing, 50–75 ml of blood are displaced from the splanchnic bed by descent of the diaphragm and the associated increase in abdominal pressure (Aliverti et al. 2009)). Moreover, repeated expulsive respiratory manoeuvres are capable of producing a circulatory output (Aliverti et al. 2010)), explaining the phenomenon that coughing can maintain consciousness during asystolic cardiac arrest (Criley et al. 1976; Niemann et al. 1980)).
Our study has some limitations. Like many others we have studied voluntary coughing, which may not well represent cough in disease states; however, coughing is known to be under considerable conscious control (Hutchings et al. 1993a,b) and therefore much spontaneous coughing may be initiated voluntarily (Woodcock et al. 2010)). However, we found little difference in the pressures and volume changes attained by voluntary cough peals compared with those induced by reflex responses to citric acid inhalation. Unfortunately we were unable to measure flow during citric acid-induced coughing and so these and the cough phase durations could not be compared. In addition, due to oesophageal contractions, we were only able to obtain oesophageal pressure measurements in half of our subjects, reducing our ability to demonstrate changes in oesophageal pressure. It is possible that these spasms were in part provoked by the cough manoeuvres being performed; patients with chronic cough frequently display oesophageal motility abnormalities on manometry testing (Kastelik et al. 2003)). In addition, many of the subjects included had not performed oesophageal intubation previously and perhaps inexperienced subjects may be a further explanation for this observation. Finally, in this study we assumed that subjects were able to cough with a consistent effort for both single and peals of coughs. Future studies could test the effect of varying cough effort at different operating volumes.
In conclusion, this study describes the effect of operating volume on the mechanical changes during voluntary single and peals of coughs, finding that the operating volume is the most important determinant of cough peak flow in healthy individuals. We have also shown that during peals of coughs similar mechanical effects are achieved in a much shorter duration, suggesting a significant modification of the motor pattern. Future studies investigating cough mechanics in health and respiratory disease should control for the influence of operating volume.
Acknowledgments
We would like to acknowledge the subjects who volunteered for this study and also Dr Sandy Jack and Mr Piero Monaco who helped with the setup work for this study. J.A.S. was funded by a Stepping Stones Award from Manchester University and also an MRC Clinician Scientist Fellowship Award.
Glossary
Abbreviations
- C5
concentration of citric acid inducing 5 coughs
- FRC
functional residual capacity
- GEE
general estimating equation
- LED
light emitting diode
- OEP
opto-electronic plethysmography
- Palv
alveolar pressure
- Poes
oesophageal pressure
- Pgas
gastric pressure
- Pdi
trans-diaphragmatic pressure
- RCp
pulmonary rib cage
- RCa
abdominal rib cage
- SVC
slow vital capacity
- TGV
total gas volume
- TLC
total lung capacity
- VC
vital capacity
- VTR
total volume displaced by the trunk (chest/upper abdomen)
- ΔVCOMP
volume change due to gas compression
- ΔVEXP
volume change due to expired air
- VL
volume of air in the lungs
Author contributions
This study was performed in the physiology laboratory at University Hospital Aintree. J.A.S. contributed to the conception, design and execution of the experiment, analysis and interpretation of the data and writing of the article. M.Q. contributed to the design of the experiment, in particular collection and analysis of the OEP data and writing of the article. K.McG. contributed to the design of the experiment, designed the software for control of cough operating volume, execution of the experiment, interpretation of the data and revision of the article. A.K. contributed to the design, execution of the experiment, interpretation of the data and revision of the article. A.A. contributed to the study design, analysis and interpretation of the data and revision of the article. J.E. contributed to the study conception, design, interpretation of the data and revision of the article. P.M.C. contributed to the study conception, design, interpretation of the data and revision of the article. All authors approved the final version.
Supplementary Material
Supplemental Fig. S1
References
- Aliverti A, Bovio D, Fullin I, Dellaca RL, Lo Mauro A, Pedotti A, Macklem PT. The abdominal circulatory pump. PLoS One. 2009;4:e5550. doi: 10.1371/journal.pone.0005550. [DOI] [PMC free article] [PubMed] [Google Scholar]
- Aliverti A, Dellaca R, Pelosi P, Chiumello D, Pedotti A, Gattinoni L. Optoelectronic plethysmography in intensive care patients. Am J Respir Crit Care Med. 2000;161:1546–1552. doi: 10.1164/ajrccm.161.5.9903024. [DOI] [PubMed] [Google Scholar]
- Aliverti A, Uva B, Laviola M, Bovio D, Lo Mauro A, Tarperi C, et al. Concomitant ventilatory and circulatory functions of the diaphragm and abdominal muscles. J App Physiol. 2010;109:1432–1440. doi: 10.1152/japplphysiol.00576.2010. [DOI] [PubMed] [Google Scholar]
- Arora NS, Gal TJ. Cough dynamics during progressive expiratory muscle weakness in healthy curarized subjects. J Appl Physiol. 1981;51:494–498. doi: 10.1152/jappl.1981.51.2.494. [DOI] [PubMed] [Google Scholar]
- Baydur A, Behrakis PK, Zin WA, Jaeger M, Milic-Emili J. A simple method for assessing the validity of the esophageal balloon technique. Am Rev Respir Dis. 1982;126:788–791. doi: 10.1164/arrd.1982.126.5.788. [DOI] [PubMed] [Google Scholar]
- Benditt DG, Samniah N, Pham S, Sakaguchi S, Lu F, Lurie KG, Ermis C. Effect of cough on heart rate and blood pressure in patients with ‘cough syncope’. Heart Rhythm. 2005;2:807–813. doi: 10.1016/j.hrthm.2005.04.022. [DOI] [PubMed] [Google Scholar]
- Cala SJ, Kenyon CM, Ferrigno G, Carnevali P, Aliverti A, Pedotti A, Macklem PT, Rochester DF. Chest wall and lung volume estimation by optical reflectance motion analysis. J Appl Physiol. 1996;81:2680–2689. doi: 10.1152/jappl.1996.81.6.2680. [DOI] [PubMed] [Google Scholar]
- Chao AC, Lin RT, Liu CK, Wang PY, Hsu HY. Mechanisms of cough syncope as evaluated by valsalva maneuver. Kaohsiung J Med Sci. 2007;23:55–62. doi: 10.1016/S1607-551X(09)70375-4. [DOI] [PMC free article] [PubMed] [Google Scholar]
- Chiumello D, Carlesso E, Aliverti A, Dellaca RL, Pedotti A, Pelosi PP, Gattinoni L. Effects of volume shift on the pressure-volume curve of the respiratory system in ALI/ARDS patients. Minerva Anestesiol. 2007;73:109–118. [PubMed] [Google Scholar]
- Criley JM, Blaufuss AH, Kissel GL. Cough-induced cardiac compression. Self-administered from of cardiopulmonary resuscitation. JAMA. 1976;236:1246–1250. [PubMed] [Google Scholar]
- Desser KB, Harris CL, Benchimol A. Carotid blood velocity during cough studies in man. Stroke. 1976;7:416–418. doi: 10.1161/01.str.7.4.416. [DOI] [PubMed] [Google Scholar]
- Fontana GA, Pantaleo T, Lavorini F, Boddi V, Panuccio P. A noninvasive electromyographic study on threshold and intensity of cough in humans. Eur Respir J. 1997;10:983–989. doi: 10.1183/09031936.97.10050983. [DOI] [PubMed] [Google Scholar]
- Guyton A, Halls J. Textbook of Medical Physiology. WB Saunders Company; 1995. [Google Scholar]
- Hutchings HA, Eccles R, Smith AP, Jawad MS. Voluntary cough suppression as an indication of symptom severity in upper respiratory tract infections. Eur Respir J. 1993a;6:1449–1454. [PubMed] [Google Scholar]
- Hutchings HA, Morris S, Eccles R, Jawad MS. Voluntary suppression of cough induced by inhalation of capsaicin in healthy volunteers. Respir Med. 1993b;87:379–382. doi: 10.1016/0954-6111(93)90052-2. [DOI] [PubMed] [Google Scholar]
- Iandelli I, Aliverti A, Kayser B, Dellaca R, Cala SJ, Duranti R, et al. Determinants of exercise performance in normal men with externally imposed expiratory flow limitation. J Appl Physiol. 2002;92:1943–1952. doi: 10.1152/japplphysiol.00393.2000. [DOI] [PubMed] [Google Scholar]
- Kastelik JA, Redington AE, Aziz I, Buckton GK, Smith CM, Dakkak M, Morice AH. Abnormal oesophageal motility in patients with chronic cough. Thorax. 2003;58:699–702. doi: 10.1136/thorax.58.8.699. [DOI] [PMC free article] [PubMed] [Google Scholar]
- Kelsall A, Decalmer S, Webster D, Brown N, McGuinness K, Woodcock A, Smith J. How to quantify coughing: correlations with quality of life in chronic cough. Eur Respir J. 2008;32:175–179. doi: 10.1183/09031936.00101307. [DOI] [PubMed] [Google Scholar]
- Knudson RJ, Mead J, Knudson DE. Contribution of airway collapse to supramaximal expiratory flows. J Appl Physiol. 1974;36:653–667. doi: 10.1152/jappl.1974.36.6.653. [DOI] [PubMed] [Google Scholar]
- Lanini B, Bianchi R, Binazzi B, Romagnoli I, Pala F, Gigliotti F, Scano G. Chest wall kinematics during cough in healthy subjects. Acta Physiol (Oxf) 2007;190:351–358. doi: 10.1111/j.1748-1716.2007.01701.x. [DOI] [PubMed] [Google Scholar]
- Lasserson D, Mills K, Arunachalam R, Polkey M, Moxham J, Kalra L. Differences in motor activation of voluntary and reflex cough in humans. Thorax. 2006;61:699–705. doi: 10.1136/thx.2005.057901. [DOI] [PMC free article] [PubMed] [Google Scholar]
- Lavietes MH, Smeltzer SC, Cook SD, Modak RM, Smaldone GC. Airway dynamics, oesophageal pressure and cough. Eur Respir J. 1998;11:156–161. doi: 10.1183/09031936.98.11010156. [DOI] [PubMed] [Google Scholar]
- Layton AM, Garber CE, Thomashow BM, Gerardo RE, Emmert-Aronson BO, Armstrong HF, et al. Exercise ventilatory kinematics in endurance trained and untrained men and women. Respir Physiol Neurobiol. 2011;178:223–229. doi: 10.1016/j.resp.2011.06.009. [DOI] [PubMed] [Google Scholar]
- McCool FD( Global physiology and pathophysiology of cough: ACCP evidence-based clinical practice guidelines. Chest. 2006;129:48S–53S. doi: 10.1378/chest.129.1_suppl.48S. [DOI] [PubMed] [Google Scholar]
- Mattle HP, Nirkko AC, Baumgartner RW, Sturzenegger M. Transient cerebral circulatory arrest coincides with fainting in cough syncope. Neurology. 1995;45:498–501. doi: 10.1212/wnl.45.3.498. [DOI] [PubMed] [Google Scholar]
- Miller MR, Hankinson J, Brusasco V, Burgos F, Casaburi R, Coates A, et al. Standardisation of spirometry. Eur Respir J. 2005;26:319–338. doi: 10.1183/09031936.05.00034805. [DOI] [PubMed] [Google Scholar]
- Morice AH, Fontana GA, Belvisi MG, Birring SS, Chung KF, Dicpinigaitis PV, et al. ERS guidelines on the assessment of cough. Eur Respir J. 2007;29:1256–1276. doi: 10.1183/09031936.00101006. [DOI] [PubMed] [Google Scholar]
- Niemann JT, Rosborough J, Hausknecht M, Brown D, Criley JM. Cough-CPR: documentation of systemic perfusion in man and in an experimental model: a ‘window’ to the mechanism of blood flow in external CPR. Crit Care Med. 1980;8:141–146. doi: 10.1097/00003246-198003000-00011. [DOI] [PubMed] [Google Scholar]
- Romei M, Mauro AL, D’Angelo MG, Turconi AC, Bresolin N, Pedotti A, Aliverti A. Effects of gender and posture on thoraco-abdominal kinematics during quiet breathing in healthy adults. Respir Physiol Neurobiol. 2010;172:184–191. doi: 10.1016/j.resp.2010.05.018. [DOI] [PubMed] [Google Scholar]
- Ross BB, Gramiak R, Rahn H. Physical dynamics of the cough mechanism. J Appl Physiol. 1955;8:264–268. doi: 10.1152/jappl.1955.8.3.264. [DOI] [PubMed] [Google Scholar]
- Sharpey-Schafer EP. The mechanism of syncope after coughing. Br Med J. 1953;2:860–863. doi: 10.1136/bmj.2.4841.860. [DOI] [PMC free article] [PubMed] [Google Scholar]
- Woodcock A, Young EC, Smith JA. New insights in cough. Br Med Bull. 2010;96:61–73. doi: 10.1093/bmb/ldq034. [DOI] [PubMed] [Google Scholar]
Associated Data
This section collects any data citations, data availability statements, or supplementary materials included in this article.