

Abstract
Although the Autobiographical Memory Test (AMT) is widely used its psychometric properties have rarely been investigated. This paper utilises data gathered from a 10-item written version of the AMT, completed by 5792 adolescents participating in the Avon Longitudinal Study of Parents and Children, to examine the psychometric properties of the measure. The results show that the scale derived from responses to the AMT operates well over a wide range of scores, consistent with the aim of deriving a continuous measure of over-general memory. There was strong evidence of group differences in terms of gender, low negative mood, and IQ, and these were in agreement when comparing an item response theory (IRT) approach with that based on a sum score. One advantage of the IRT model is the ability to assess and consequently allow for differential item functioning. This additional analysis showed evidence of response bias for both gender and mood, resulting in attenuation in the mean differences in AMT across these groups. Implications of the findings for the use of the AMT measure in different samples are discussed.
Keywords: Avon Longitudinal Study of Parents and Children, ALSPAC, Autobiographical Memory Test, AMT, Graded response model, Differential item functioning, Mood congruence
Autobiographical memory refers to memory for events in our personal past. The ability to recollect events at will and to develop a detailed and well-structured narrative of past experience develops gradually throughout childhood (e.g., Nelson & Fivush, 2004) with the ability to construct a coherent life story not developing until adolescence (Habermas & Bluck, 2000). Where autobiographical memory functions effectively it supports our ability to learn from prior experience and to form a sense of self that is coherent over time (Conway & Pleydell-Pearce, 2000). However in some psychological disorders autobiographical memory is disrupted, with biases evident in encoding and retrieval processes (Williams, Watts, MacLeod, & Matthews, 1997). Additionally a large number of studies have indicated that depressed patients, as well as those with a history of trauma, show over-general autobiographical memory (OGM; for review see Williams et al., 2007), a tendency to recall memories in a way that lacks event-specific detail. For example, when presented with a cue word and asked to retrieve a specific memory, participants displaying OGM typically fail to describe an event that would have occurred on a particular day, at a particular time and place, and instead respond with more generic information, often describing a category of events, rather than one particular occasion. For example to the cue word happy a specific response might be “the welcome home party for my sister after she came back from her year abroad,” whereas an over-general response might be “I always enjoy going to parties”.
In clinical populations OGM appears to be relatively independent of current levels of depressed mood (Wessel, Meeren, Peeters, Arntz, & Merckelbach, 2001) showing little change following remission of depressive symptoms (Brittlebank, Scott, Williams, & Ferrier, 1993) with evidence that it is often (Mackinger, Pachinger, Leibetseder, & Fartacek, 2000; Spinhoven et al., 2006), although not always (Kuyken & Dalgleish, 1995), impaired in people with a history of depression who are currently well. This has led to the suggestion that the tendency to retrieve autobiographical memories in an over-general rather than specific way may represent a relatively stable, trait-like factor, rather than simply an epiphenomenon of current mood state. The idea of an OGM trait was challenged by Dalgleish et al. (2003) who argued that OGM might be better understood as a form of task error. Using a reversed version of the Autobiographical Memory Test (AMT) they showed that depressed patients could be induced to be relatively more specific than healthy controls under conditions where the target for retrieval was a general memory. However the finding of Dalgleish et al. may be a consequence of stable and instruction-insensitive over-general retrieval in depressed patients viewed in the context of more flexible retrieval by healthy volunteers who were able to be more responsive to task instructions. Indeed some evidence in favour of the idea of an OGM trait comes from studies that have demonstrated individual differences in degree of OGM retrieval in non-clinical groups. In these groups OGM correlates with the use of repression and avoidance as coping strategies (Hermans, Defranc, Raes, Williams, & Eelen, 2005; Raes, Hermans, Williams, & Eelen, 2006), and with the degree of subjective distress experienced in response to naturally occurring negative events (Gibbs & Rude, 2004; van Minnen, Wessel, Verhaak, & Smeenk, 2005). These findings suggest that in population samples individual differences in OGM may relate in a meaningful way to risk of affective disturbance, and that there may be some value in working from the assumption that OGM represents a trait-like characteristic, even if its expression is somewhat sensitive to external factors.
PSYCHOMETRIC PROPERTIES OF THE AMT
If it is assumed that there are relatively stable individual differences in retrieval style, such that some people will tend to retrieve memories in a more general way than others, then it is essential to have a robust means of assessing these tendencies. The tendency towards OGM can be conceptualised in statistical terms as reflecting an underlying latent trait or factor, i.e., an unmeasured characteristic that can be (imperfectly) assessed by means of a set of correlated observed items. Most studies of OGM have utilised the AMT (Williams & Broadbent, 1986) to assess retrieval style, a cued recall paradigm based on early paradigms (Crovitz & Schiffman, 1974; Galton, 1879; Robinson, 1976) in which participants are presented with a series of words (including cues of mixed positive and negative valence, e.g., happy, lonely) and asked to describe a specific event of which each word reminds them. However, there is no single version of the AMT in use and since relatively little is known about its psychometric properties there is little to guide new researchers selecting cue words. While most studies utilise between 10 and 20 cue words, matched for word frequency, the particular words selected vary and thus where findings are inconsistent across studies it is unclear to what extent this may be attributable to idiosyncrasies of the particular cue word set (Dalgleish et al., 2003; Robinson, 1980; Rubin, 1980).
To begin to address the issue Griffith et al. (2009) conducted an item response theory (IRT) analysis of AMT data collected from three large samples comprising high school and university students, exploring the psychometrics of the AMT in more detail. IRT analysis can provide information on whether cue words vary in difficulty (e.g., whether some are “easier” than others) and in general produce a greater frequency of specific response, such as highly imageable cues (Williams, Healey, & Ellis, 1999). It can also provide information on cue word discrimination—the capacity of each cue to provide information about the underlying tendency towards specific versus over-general retrieval—the OGM latent trait. Using this approach Griffith et al. (2009) confirmed that in the samples studied the AMT appeared to measure a single unidimensional latent trait, but that individual cues differed from one another in both their difficulty and discrimination.
Recent research (Debeer, Hermans, & Raes, 2009; Raes, Hermans, Williams, & Eelen, 2007) has suggested that while standard AMT instructions, which explicitly ask participants to retrieve specific memories, may be most informative when the aim is to quantify level of OGM in clinical groups (who are likely to be low on the latent trait of memory specificity), such instructions may be relatively insensitive to variations in memory specificity in non-clinical groups. To explore this possibility Griffith et al. (2009) compared data drawn from two versions of the AMT, one in which detailed instructions were given and one in which more minimal instructions were used. Their results confirmed that while item responses to standard AMT instructions were most able to discriminate between people low in memory specificity, minimal instructions were most able to discriminate between people around the mean level on the latent trait. Depending on the ultimate use of the derived scale, a goal of these IRT models is often a scale that operates well across the range of AMT where most respondents fall. Hence the target population, and consequently the expected distribution of AMT scores, is an important consideration when determining not only the cues used, but also the manner in which the questions are posed.
One way to take this work forward is to use IRT as a basis for exploring differential item functioning (DIF), the possibility that the response to particular items on a measure, in this case the AMT, varies systematically as a function of some characteristic of the person or people completing them. In the presence of DIF, estimated differences in AMT between groups of individuals defined on the basis of this characteristic would be misleading—for example an apparent difference in AMT score might be due to a different interpretation or understanding of the task instructions or item, due to IQ differences or perhaps the first language of the respondent, rather than a real difference in autobiographical memory over-generality.
Since AMT cues are usually valenced (having positive or negative emotional connotations) one likely source of DIF is the mood state of the person completing the task. Individuals experiencing low mood may relate to the task differently from those who are in more positive mood, for example because cue words seem more familiar or appear to be more self-relevant. Additionally mood-related DIF might arise because of the phenomenon of mood congruent recall—the general facilitation of recall of negative memories relative to positive memories in participants who are low in mood (Williams et al., 1997). These impacts are distinct from genuine differences in the latent trait of OGM between those who are low in mood and those who are not. Examining mood-state related DIF would allow for an estimation of the extent to which differences in scores on the AMT between participants experiencing different degrees of low mood are accounted for by biases in responding introduced by mood, rather than by mood-state related differences in the underlying tendency to retrieve OGMs.
In addition to exploring the possible impact of mood state it is important to consider how more basic characteristics such as age and gender influence the item functioning of the AMT. For example cues that are effective in assessing OGM in adult samples or females may be less useful for adolescents, or males. Indeed while some previous studies have linked performance on the AMT to IQ or educational level (Wessel et al., 2001; Wessel, Merckelbach, & Dekkers, 2002) others have failed to find an association (Birch & Davidson, 2007), making it unclear whether IQ is systematically related to AMT performance and if so whether this reflects differences in the underlying latent trait or a response bias. Equally while gender differences on the AMT have not been a significant focus of research, prior research on autobiographical memory retrieval has consistently found that adult women recall more specific episodic material than men, including for gender-neutral topics (e.g., Herlitz, Nilsson, & Backman, 1997; Pillemer, Wink, DiDonato, & Sanborn, 2003). These gender differences are thought to be present from relatively early in life, reflecting at least in part differences between the degrees of elaboration in parents’ reminiscing conversations with daughters and sons (Reese & Fivush, 1993). If there are underlying gender differences in retrieval specificity, it is conceivable that tasks such as the AMT may be more sensitive in assessing underlying memory specificity in one gender than the other. Exploring the extent to which cue words differ in sensitivity or discrimination as a function of gender is therefore important for future research, perhaps particularly in samples where there may be an excess of depressed mood in females, as is often observed.
OVER-GENERAL MEMORY IN EARLY ADOLESCENCE
There are a number of studies which indicate that over-general memory acts as a vulnerability factor, increasing the risk of depression or stress reactions following life events (Gibbs & Rude, 2004; Hauer, Wessel, Engelhard, Peeters, & Dalgleish, 2009; van Minnen et al., 2005). However, in order to firmly establish a causal role for OGM in vulnerability to depression or other psychiatric problems it is essential that OGM be assessed prior to the onset of any significant psychopathology. Studying young adolescents provides such an opportunity since most onsets of psychiatric disorder occur from middle to late adolescence onwards (Kessler et al., 2007; Zisook et al., 2007). The aim of the current paper was to explore the psychometric properties of the AMT, and in particular the extent to which it could be used to extract a measure of an underlying latent trait of OGM, in such an adolescent sample. Additionally because we were able to obtain data from a large number of adolescents, it was possible to examine the influence of mood, IQ and gender both on mean levels of OGM but also in terms of differential item functioning, something that previous studies have not had the capacity to do as a result of the sheer number of responses required to model these effects.
The current paper reports data on approximately 40,000 memories obtained from a cohort of young people participating in the Avon Longitudinal Study of Parents and Children (ALSPAC). The ALSPAC study has collected detailed information on participants and their families from the prenatal period onwards and in total 5792 young people completed a written version of AMT at 13 years of age. We describe the measure, explore its underlying structure, and examine the impact of mood, gender, and IQ, before investigating the existence of differential item functioning. We go on to discuss the implications of this for the design of future AMT studies.
METHOD
Sample
The sample comprised participants from ALSPAC cohort study (Golding, Pembrey, & Jones, 2001). ALSPAC is an ongoing population-based study investigating a wide range of environmental and other influences on the health and development of children. Pregnant women resident in the former Avon Health Authority (Bristol) in southwest England, having an estimated date of delivery between 1 April 1991 and 31 December 1992, were invited to take part, resulting in a “core” cohort of 14,541 pregnancies and 13,973 singletons/twins alive at 12 months of age. Further eligible cases were approached and enrolled when the children were 7 years old; these “non-core” cases will not be used in these analyses due to their lack of baseline (pre-7-year) data.
The primary source of data collection was via self-completion questionnaires administered at least annually to the mother, her partner, and the ALSPAC study child. Since the age of 7 years the whole cohort has been invited to an annual “focus” clinic for a variety of hands-on assessments. More detailed information on the ALSPAC study is available on the website: http://www.alspac.bris.ac.uk. All aspects of the study are reviewed and approved by the ALSPAC Law and Ethics Committee, which is registered as an Institutional Review Board. Approval was also obtained from the Local Research Ethics Committees, which are governed by the Department of Health.
Measures
AMT.
Autobiographical memory was assessed using 10 questions that formed part of a 16-page questionnaire administered to the study children when they were approximately 13 years of age. A total of 95% of respondents were aged between 13 years 1 month and 13 years 3 months. Five positive (excited, happy, lucky, relaxed, relieved) and five negative (bored, failure, hopeless, lonely, sad) cue words, which were judged to be familiar and relevant to young teenagers, were selected from among word sets used in previous studies with adult samples. Positive and negative cue words were matched for their frequency (and thus likely familiarity) in written material available for children (Mann Whitney U = 11.00, Z = – .32) using data from the University of Essex Children's Printed Word Database (Lovejoy, 2003). In studies in clinical populations the autobiographical memory test is usually presented orally under timed conditions. However, when gathering data from large population samples such an approach is extremely costly. In a number of prior studies of larger samples written versions of the task have been successfully employed (Henderson, Hargreaves, Gregory, & Williams, 2002; Hermans et al., 2005; Raes, Hermans, de Dekker, Eelen, & Williams, 2003) and a written version of the task was adopted for the current study.
Instructions were shortened and simplified from those typically used with adults and no time constraint was imposed. Participants were asked to describe real events, and given an example of what this meant, but were not told that they should describe an event occurring on a single day (although the example distinguished between an event occurring on a specific day and a category of events). As discussed in the introduction it has been suggested that instructions that strongly reinforce the need to respond with specific memories may result in a very low frequency of non-specific memories in non-clinical samples (Raes et al., 2007) and that minimal instructions are more sensitive to variations in OGM (Debeer et al., 2009; Griffith et al., 2009). Given that the current data were obtained from a population sample, the less-detailed instructions employed are likely to represent an advantage. The implications of the absence of a time constraint are less certain since a meta-analysis conducted by (Van Vreeswijk & De Wilde, 2004) came to no clear conclusion regarding the effects of time given to respond on level of over-generality. However given that a time constraint could not be imposed systematically it was considered better not to suggest a time restriction in the instructions. Further details on the text coding and its reliability can be found in Appendix A.
Mood symptoms.
The young people completed the 13-item short form of the Moods and Feelings Questionnaire (Angold et al., 1995; Costello & Angold, 1988) during a “focus” clinic held on the ALSPAC premises. The mean age of the group at this visit was 12 years 10 months (IQR: 12 yr 8 m – 12 yr 11 m), i.e., typically 3–4 months prior to the administration of the AMT. The Moods and Feelings questionnaire comprises items measuring negative mood and was completed at a PC as part of a larger battery of questions. Previous work on these data had shown that 1 item (restless) was not well understood in this group (manuscript in preparation); hence the remaining 12 items were utilised for this analysis. The sum-score derived from these twelve items (range 0 to 24) was dichotomised at the median (a score of 3 or higher) to ensure a large number of cases in each group. The recommended cut-off for clinical symptoms is 10+ when using the full 13-item scale, so it is important to note that while the adolescents in the high negative-mood sample report a greater number of mood symptoms they cannot be considered to be depressed or dysphoric.
Verbal IQ.
A short form of the WISC-III (Wechsler, Golombok, & Rust, 1992) was administered during the 8-year focus clinic. Alternate items were used for all subtests with the exception of the coding subtest, which was given in full. More details on this use of the short-form WISC-III can be found in Joinson et al. (2007). Previous research suggests a high level of stability for estimates of verbal IQ derived from the WISC-II, over an average interval of 2.83 years, yielding a test–retest reliability co-efficient of .87 (Canivez & Watkins, 1998). For this analysis we used the verbal IQ subscale, dichotomising at the median level to give two equal-sized groups. Low cut-offs were used for both mood and IQ to allow the opportunity for examining DIF across groups defined by more than one criterion, e.g., for comparing low-mood males with low-mood females. More clinically relevant cut-points would not have given the necessary sample sizes to permit these further analyses.
Statistical methods
We began with a traditional analysis in which a simple sum-score was derived based on the scores for each of the 10 items. Differences in sum-score for three group characteristics—gender, mood symptoms, and IQ—were assessed using t-tests. These analyses were based on (a) the complete case sample, and (b) the larger sample of partially complete data with errors/omissions coded as zero.
This analysis was followed by an Item Response treatment of these data in which a latent trait for AMT was derived. Preliminary analyses using a Mokken Scaling Procedure (van Schuur, 2003) provided evidence that the 10 items formed a homogeneous unidimensional scale (more details available from the first author). Consequently a parametric unidimensional graded response IRT model (Samejima, 1969) using full-information maximum-likelihood with robust standard errors (estimator = MLR) and the logit link function was applied to these data. Trait differences were estimated for gender, mood symptoms, and IQ, and findings compared with those from the traditional analysis described above. Finally, the presence of uniform and non-uniform differential item functioning was examined using MIMIC (Multiple Indicator Multiple Cause) models with the altered data structure as described in (Crane et al., 2007). The impact of this response bias on estimated AMT main effects for gender, mood symptoms, and IQ was then assessed. Models were fitted using Mplus version 5.21 (Muthén & Muthén, 2007) or Stata version 10-MP (StataCorp., 2007). Further information on the IRT model and the DIF assessment can be found in Appendix B.
RESULTS
The 13-year questionnaire was sent to 10,434 of the core study participants and was returned by 6816 (65.3% response rate). Of these respondents, 5792 (85.0%) completed at least part of the AMT section. An AMT response was more common among females: 3297 (89.4%) compared with 2495 (79.8%) males (X2 = 121.8, p <.001). The majority of these analyses will be based on this sample of 5792; however, the mood symptoms data were only available for 4466 (77.1%) of these cases and the IQ data for 4482 (77.3%). There were 2238 respondents who provided mood data in the clinic but for whom we did not obtain AMT responses, and similarly 2903 who provided IQ but no AMT. There was no evidence of an association between mood symptom grouping and providing AMT data: 47.5% of those without AMT data exceeded a symptom score of 3+ compared with 48.4% of those with AMT (X2 = 0.45, p = .502). However, there was evidence of an association between IQ and returning the AMT questions with 50.6% of respondents compared with 34.8% of non-respondents scoring above the median IQ cut-point (X2 = 96.9, p <.001), this equated to a 6.5 IQ points difference on the Total IQ scale.
Incomplete responses
A partial response to the set of 10 questions was common. For instance, of the 5792 who provided any AMT information, only 1276 (22.0%) provided 10 useable text responses, while 4360 (75.3%) answered 5 or more. In total, this group of 5792 young people provided 39,026 text responses, an average of 6.7 responses each. Instructions stated that if a memory could not be recollected for a particular cue word then the participant should just leave the line blank, and in line with Griffith et al. (2009) we will treat these non-responses in the same way as “errors” (which often corresponded to text stating that the child could not remember anything) and create a lowest category of zero for each item corresponding to both i.e., “errors/omissions”.
Descriptive analysis
Table 1 shows the distribution of responses for each of the 10 questions. After the first two words there is no apparent systematic increase in omission as one progresses from cue words appearing early in the questionnaire to those presented later. From inspecting the different patterns of omitted items, it was apparent that only a few patterns were monotonic (i.e., a series of responses followed by non-responses), which suggests that respondents were not just starting with question one and then stopping because they became bored. There was also no clear relationship observed between non-response and either valence or word-frequency (Pearson's correlation between proportion of participants who omitted the word and word-frequency = –0.5298, p = .115). Despite this, some words clearly produced much higher rates of non-response than others, in particular the cues hopeless and failure. It is possible that although these patterns of non-response do not relate directly to word frequency, that these cues refer to emotional states that are less frequently experienced by young teenagers, at least as compared to other cues (e.g., bored). If participants simply have less experience with the emotional states in question (e.g., they are less self-relevant) then it would be expected that these cues would be less likely to elicit memories.
TABLE 1.
Distribution of responses for the 10 AMT questions (n = 5792) listed in order of presentation in the questionnaire
| Item | Valence | Frequency per million* | Omission | Error | Associate | Categoric | Extended | Specific |
|---|---|---|---|---|---|---|---|---|
| Happy | Pos | 419 | 316 (5.5%) | 7 (0.1%) | 150 (2.6%) | 1,011 (17.5%) | 680 (11.7%) | 3628 (62.6%) |
| Bored | Neg | 41 | 772 (13.3%) | 18 (0.3%) | 255 (4.4%) | 1,833 (31.7%) | 464 (8.0%) | 2450 (42.3%) |
| Relieved | Pos | 3 | 1757 (30.3%) | 48 (0.8%) | 67 (1.2%) | 597 (10.3%) | 133 (2.3%) | 3190 (55.1%) |
| Hopeless | Neg | 5 | 3277 (56.6%) | 120 (2.1%) | 232 (4.0%) | 588 (10.2%) | 231 (4.0%) | 1344 (23.2%) |
| Excited | Pos | 84 | 693 (12.0%) | 22 (0.4%) | 130 (2.2%) | 947 (16.4%) | 977 (16.9%) | 3023 (52.2%) |
| Failure | Neg | 3 | 3047 (52.6%) | 90 (1.6%) | 246 (4.3%) | 519 (9.0%) | 71 (1.2%) | 1819 (31.4%) |
| Lonely | Neg | 62 | 2938 (50.7%) | 94 (1.6%) | 268 (4.6%) | 750 (13.0%) | 689 (11.9%) | 1053 (18.2%) |
| Sad | Neg | 238 | 1941 (33.5%) | 45 (0.8%) | 99 (1.7%) | 617 (10.7%) | 1934 (33.4%) | 1156 (20.0%) |
| Lucky | Pos | 108 | 2351 (40.6%) | 53 (0.9%) | 226 (3.9%) | 510 (8.8%) | 135 (2.3%) | 2517 (43.5%) |
| Relaxed | Pos | 3 | 1802 (31.1%) | 24 (0.4%) | 153 (2.6%) | 1,843 (31.8%) | 460 (7.9%) | 1510 (26.1%) |
Positive and negative cue words are matched for their frequency in written material available for children using data from the University of Essex Children's Printed Word Database.
In written versions of the AMT, where space is limited so that descriptions of memories are quite short and clarification is not possible, there is often some ambiguity in distinguishing between extended and specific memories. The distinction between an event lasting for less than 24 hours (specific) and one lasting slightly longer than this (extended) is in any case somewhat arbitrary, particularly when instructions are minimal and thus describing an event of slightly longer duration does not represent a task “error”. Indeed previous work has suggested that extended memories often still refer to unique events whereas categoric memories do not, suggesting that extended memories share similarities with specific memories in terms of the type of event being described (Williams & Dritschel, 1992). For these reasons we decided to combine specific and extended memory responses into a single category for our primary analyses. In order to assess the potential impact of this decision, both our traditional and IRT analysis of gender/mood/IQ main-effects was repeated using the 10 five-category items which preserved the extended/specific distinction.
Table 2 shows the findings based on summing the scores for each of the 10 items. Results are displayed for the complete-case dataset followed by the greater partially complete data with errors/omissions recoded to zero. The mean numbers of associate, categoric, extended, and specific memories are shown across groups defined by gender, mood, and IQ. Estimated differences in AMT sum-score (both with and without the extended/specific) distinction are accompanied by t-test p-values. Table 2 shows a consistent pattern of findings when either combining extended and specific responses or keeping these separate. Some differences appear attenuated (particularly for negative mood) in the smaller complete case sample. In general, AMT scores are higher (indicative of more specific memory recall) for girls, those with high negative mood, and those with higher IQ.
TABLE 2.
Breakdown of the mean number of associate, categoric, extended, and specific memories across groups
| Male | Female | P | Low negative mood | High negative mood | P | Low IQ | High IQ | P | |
|---|---|---|---|---|---|---|---|---|---|
| Complete data (i.e. omissions/errors set to missing) | |||||||||
| N = 472 | N = 804 | N = 394 | N = 560 | N = 469 | N = 499 | ||||
| Associate | 0.81 (0.07) | 0.50 (0.04) | 0.80 (0.08) | 0.42 (0.04) | 0.69 (0.07) | 0.46 (0.05) | |||
| Categoric | 2.77 (0.13) | 2.25 (0.09) | 2.18 (0.13) | 2.48 (0.11) | 2.68 (0.13) | 1.99 (0.10) | |||
| Extended | 1.23 (0.05) | 1.47 (0.05) | 1.40 (0.06) | 1.39 (0.05) | 1.42 (0.06) | 1.41 (0.06) | |||
| Specific | 5.18 (0.13) | 5.78 (0.09) | 5.63 (0.14) | 5.71 (0.11) | 5.20 (0.13) | 6.15 (0.11) | |||
| Total (4grp) | 25.60 (0.19) | 26.76 (0.13) | < .001 | 26.23 (0.20) | 26.67 (0.15) | .065 | 25.93 (0.19) | 27.10 (0.14) | < .001 |
| Total (5grp) | 30.78 (0.31) | 32.54 (0.22) | < .001 | 31.86 (0.32) | 32.38 (0.25) | .196 | 31.14 (0.30) | 33.25 (0.24) | < .001 |
| Partially complete data (i.e. omissions/errors set to zero) | |||||||||
| N = 2495 | N = 3297 | N = 2304 | N = 2162 | N = 2214 | N = 2268 | ||||
| Associate | 0.38 (0.02) | 0.27 (0.01) | 0.33 (0.02) | 0.25 (0.02) | 0.34 (0.02) | 0.24 (0.02) | |||
| Categoric | 1.69 (0.04) | 1.52 (0.03) | 1.46 (0.04) | 1.64 (0.04) | 1.73 (0.04) | 1.34 (0.04) | |||
| Extended | 0.89 (0.02) | 1.07 (0.02) | 0.94 (0.02) | 1.03 (0.02) | 0.98 (0.02) | 1.02 (0.02) | |||
| Specific | 3.38 (0.05) | 4.02 (0.04) | 3.63 (0.05) | 3.97 (0.05) | 3.49 (0.05) | 4.14 (0.05) | |||
| Total (4grp) | 16.57 (0.15) | 18.60 (0.13) | < .001 | 16.95 (0.16) | 18.51 (0.17) | < .001 | 17.20 (0.16) | 18.42 (0.16) | < .001 |
| Total (5grp) | 19.94 (0.19) | 22.62 (0.17) | < .001 | 20.58 (0.20) | 22.48 (0.21) | < .001 | 20.68 (0.21) | 22.56 (0.20) | < .001 |
Unless otherwise stated, figures are means with standard errors in brackets. Total AMT scores are derived for both extended/specific memories considered distinct (5grp) or collapsed into a single group (4grp).
One-dimensional IRT model
Table 3 shows the parameter estimates for the one-dimensional graded-response model fitted to data with extended/specific combined. Figure 1 shows item response functions and item information functions for a selection of items under this model. Table 3 shows that there was a range of item discriminations. At the low end we have happy and bored. Compared with the other items, these two are poorly discriminating and rather easy for this population of 13-year-olds. Figure 1 shows the item response functions and item information functions for happy (bored is similar). The response functions are located far down to the left of the latent trait such that most participants have a high probability of providing an extended/specific response. In addition, the low discrimination for this item leads to a low level of information being provided across much of the range. Due to the low discrimination an extended/specific response to one of these items tells us little about a participant's location on the latent trait. As a consequence one might reconsider the use of these items in a repeated use of this scale on a population of comparable age. In contrast, the majority of the remaining items exhibit a high level of discrimination. Response functions and information functions for lucky and hopeless provide similar peak levels of information but at slightly different locations reflecting the fact that the thresholds for hopeless are situated further up the AMT latent trait (i.e., hopeless is a more difficult item).
TABLE 3.
Item parameters for graded response model on four-level items
| Threshold 1 | Threshold 2 | Threshold 3 | ||
|---|---|---|---|---|
| Discrimination | (Omission/Error | Associate) | (Associate | Categoric) | (Categoric | Extended/Specific) | |
| Happy | 0.74 | –3.04 | –2.61 | –1.17 |
| Bored | 0.91 | –2.08 | –1.71 | 0.01 |
| Relieved | 1.69 | –1.14 | –1.07 | –0.42 |
| Hopeless | 1.82 | 0.51 | 0.76 | 1.47 |
| Excited | 1.31 | –2.45 | –2.20 | –1.00 |
| Failure | 1.77 | 0.24 | 0.49 | 1.07 |
| Lonely | 1.95 | 0.15 | 0.44 | 1.32 |
| Sad | 1.76 | –0.94 | –0.82 | –0.16 |
| Lucky | 1.78 | –0.51 | –0.27 | 0.26 |
| Relaxed | 1.58 | –1.08 | –0.90 | 0.97 |
n = 5792. An item with a high discrimination parameter will discriminate well but only across a small range of trait values (the range over which item information is high). Items with low thresholds parameters are easier than those with higher threshold parameters: a specific response to excited is expected across a wider range of trait values compared with hopeless.
Figure 1.
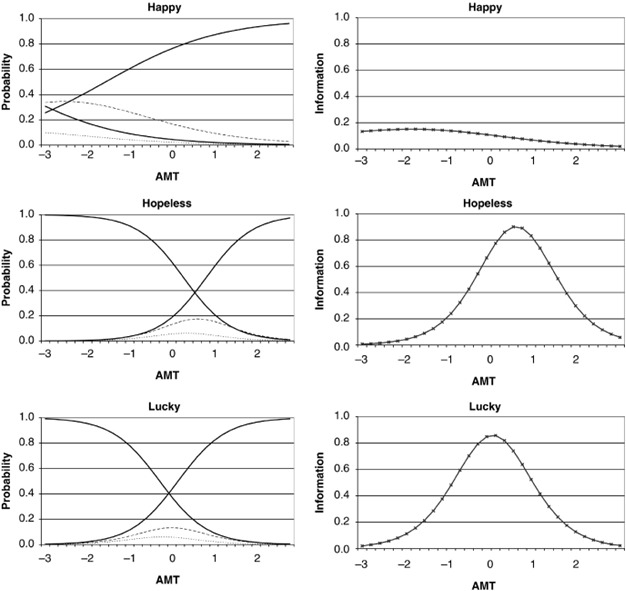
Item response functions and item information functions for three selected items from the one-dimensional graded response model unadjusted for response bias. Left column: response functions: full decreasing line corresponds to item category one (omission/failure), dotted line to item category two (associative), dashed line to category three (categoric) and full increasing line to category four (extended/specific). Right column: information functions – location on trait where scale provides most information (i.e., where an individual's trait level can be estimated most precisely).
Figure 2 shows the information function for the complete 10-item test as well as its reciprocal: the standard error of measurement. The information for the whole test is the sum of the information for the individual items. Where information is high (and the SE of measurement is low) a respondent's true AMT score will be estimated with high precision, hence the figure depicts the range of AMT values over which the scale would be most useful. It can be seen from Figure 2 that the location at which the information is at its peak occurs at a value of approximately zero on the latent trait, i.e., the mean level. The value of the SE of measurement at a trait score of zero was 0.16. For a respondent with an estimated trait score of zero we would be 95% certain that their true score lies in the interval [–1.96*0.16, 1.96*0.16] = [–0.31, 0.31]. Unlike classical test-theory methods, the precision of the estimate is not a constant: the figure shows that the SE of measurement is less than 0.5 across the interval [–1.7 SD, 1.6 SD] and increases rapidly outside this range.
Figure 2.
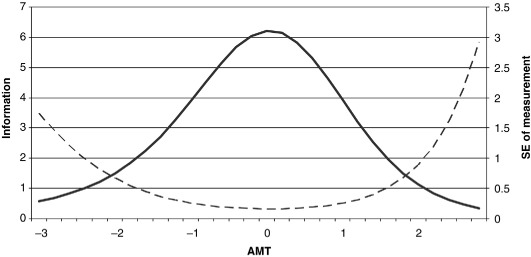
Test information function (solid line) and SE of measurement (dashed line) from the one-dimensional graded response model prior to adjustment for response bias. Standard error of measurement = the precision with which one's level of AMT can be estimated using the current scale. SE of measurement is lowest, and hence estimates are more precise, where the test information function is at its peak.
Group differences in latent AMT
The third column of Table 4 shows estimated differences in the AMT trait prior to the adjustment for any response bias. These results are consistent with those in Table 2. There is strong evidence (p <.001) of moderate differences in mean AMT across gender, mood, and IQ. For instance, on average girls are scoring 0.32 SDs higher on the AMT trait than the boys. Similarly those with high negative mood score 0.22 SDs higher than those with a more positive mood state, and those with high IQ score 0.19 SDs higher than those with lower IQ. These results were very similar when fitting the same model to the five-category ordinal items that preserved the extended/specific split. For instance, estimated gender differences were 0.305 SDs (SE = 0.03), mood differences 0.226 (0.034) and IQ differences 0.205 (0.034).
TABLE 4.
The impact of allowing for DIF on the estimated AMT main effects
| Grouping | N | Estimated differences prior to DIF adjustment | Estimated differences following DIF adjustment | Percentage change |
|---|---|---|---|---|
| Gender | ||||
| Male | 2495 | 0.00 ref | 0.00 ref | |
| Female | 3297 | 0.317 (0.030)p <.001 | 0.232 (0.030)p <.001 | 26.8% |
| Mood | ||||
| Low negative mood | 2304 | 0.00 ref | 0.00 ref | |
| High negative mood | 2162 | 0.221 (0.034)p <.001 | 0.084 (0.037)p = .022 | 62.0% |
| Gender and mood | ||||
| Males: High versus low neg. mood | 814/1146 | 0.170 (0.051) | 0.100 (0.055) | 41.2% |
| Females: High versus low neg. mood | 1158/1348 | 0.209 (0.045)p <.001 | 0.077 (0.051)p <.001 | 63.2% |
| Verbal IQ | ||||
| Low | 2214 | 0.00 ref | 0.00 ref | |
| High | 2268 | 0.189 (0.033)p <.001 | 0.159 (0.034)p <.001 | 15.9% |
Estimated differences are in standard deviations (SD) of trait, such that 0.1: small effect, 0.2: moderate effect, 0.5: large effect. Figures in brackets are standard errors of estimates.
Investigation into the presence of differential item functioning
Following the derivation of the IRT model for AMT and the estimation of group differences for gender/mood/IQ we began to investigate the presence of DIF using the stepwise approach and MIMIC model described in the Appendix. We will refer to DIF between genders as “gender-DIF,” similar for “mood-DIF” and “IQ-DIF”.
Gender.
There was strong evidence of differential item functioning between male and female respondents. The stepwise DIF analysis indicated that in generating a single generic scale that would be comparable across the sexes, it was necessary to adjust for gender-DIF in the following items and in the following order: lonely (uniform DIF, X2 = 50.0), sad (uniform DIF, X2 = 28.6), excited (uniform DIF, X2 = 17.6), failure (uniform DIF, X2 = 13.0), relaxed (non-uniform DIF, X2 = 19.4). Three examples of the DIF observed in this model are shown in Figure 3. For failure the girls’ thresholds were higher than the boys’ and hence the response functions for the girls are slightly further to the right on the latent trait, indicating that, for a boy and a girl at the same point on the trait, the girl would find giving an extended/specific answer to failure more difficult. It was our impression that memories recollected in response to failure fairly frequently related to sporting events, which tend by their nature to be specific, and these might have more commonly been described by boys, perhaps leading to the phenomenon observed. In contrast to the findings for failure, the girls’ response functions for lonely are shifted to the left indicating that girls would find it easier than boys to give a specific response (again conditional on trait levels). Finally, the third graph shows the effects of non-uniform DIF on the boys’ and girls’ response functions for the cue word relaxed. In this example the locations are similar but the slopes are clearly not parallel. The girls’ response functions are steeper, indicating the higher discrimination in this group although the discrimination in either group is far from poor. On the whole, there was not a clear, consistent pattern in terms of the item valence and the variability in model parameters between the boys and girls.
Figure 3.
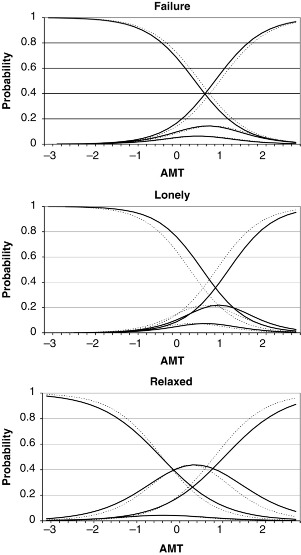
Examples of DIF observed between boys and girl responses. Item response functions for boys (solid lines) and girls (dotted lines). For an item exhibiting no gender-DIF the dotted and solid lines would coincide such that both groups had the same probability of responding in each category at every point along the latent trait. Uniform and non-uniform DIF manifests itself as parallel and non-parallel item response functions, respectively
Mood symptoms.
It was necessary to adjust for mood-DIF with the following items: lonely (uniform DIF, X2 = 58.0), failure (uniform DIF, X2 = 26.6), hopeless (uniform DIF, X2 = 21.4), and sad (uniform DIF, X2 = 12.8). Compared with the gender findings, the pattern here was much clearer. All the items with mood-DIF had negative valence and in all cases the group with higher negative mood had lower item thresholds indicating that this group would find the items easier than an equivalent respondent with a more positive mood.
Verbal IQ.
In comparison to the results above, there was relatively weak evidence for IQ-DIF with two of the items: relieved (uniform DIF, X2 = 12.9) followed by bored (uniform DIF, X2 = 13.6). For both items the thresholds were lower for the group with lower IQ indicating that this group finds these two items easier than the group with higher IQ.
Interplay between mood and gender
It is well known that a difference in the prevalence of mood symptoms between boys and girls emerges as they pass through puberty (Angold, Costello, & Worthman, 1998) and hence we felt it prudent to investigate whether the mood-DIF results described above may differ between male and female respondents. In these final analyses we derived four groups using the two indicators for gender and mood and searched for presence of DIF across these groups using a more complex version of the MIMIC models already described.
As one would expect, the results of this analysis bore some resemblance to the individual gender and mood results already seen. There was evidence for DIF across these four groups for the items lonely (uniform DIF, X2 = 103.4), excited (uniform DIF, X2 = 27.1), failure (uniform DIF, X2 = 46.9), hopeless (uniform DIF, X2 = 35.9), sad (uniform DIF, X2 = 20.4), and relaxed (non-uniform DIF, X2 = 24.2). There was a consistent pattern of differences within each gender in that for participants with high negative mood (compared with low negative mood, conditional on the latent trait) the negative valence items were easier and positive valence item harder. For some items there appeared to be more mood-DIF present in one gender group compared with the other. In particular, for the lonely item, there was more evidence of such a bias in the girls. Such a phenomenon could be tested through additional model constraints. In doing so it emerged that there was moderate evidence of a gender difference in response bias due to mood for lonely (p = .012), however there was no evidence for gender differences in bias with the other items.
The effect of DIF-adjustment on estimated main effects
In the presence of DIF one can obtain biased results when examining differences between groups unless one allows for this DIF in the derivation of the measurement model. For instance one might under- or over-estimate the difference in AMT between males and females if males have a systematic bias in the response to one or more items compared to their female counterparts. The remaining columns of Table 4 shows the impact on the estimated differences in AMT between males/females, respondents of low/high mood and of low/high verbal IQ, on allowing for the presence of DIF across these different groups.
On adjustment for gender-DIF, the main effect of gender on AMT fell by almost 27%, i.e., 27% of the estimated main effect was due to response bias. The majority of the attenuation occurred when adjusting for DIF with the lonely item, during which the effect estimate fell from 0.32 to 0.25, further adjustments were comparatively minor. Following adjustment for DIF there was still strong evidence (p <.001) of a moderate difference in AMT with girls scoring on average 0.23 SD (SE = 0.03) higher on the AMT scale, indicating that consistent with studies of adults (Pillemer et al., 2003), young teenage girls appear to be recall memories that are somewhat more specific than those of boys.
On adjustment for mood-DIF, the estimated main effect of mood on AMT fell by 62%. This time the attenuation was gradual and not dominated by one particular item. The consistent pattern between valence and direction of DIF is likely to be at the heart of this large attenuation. These results indicate that over half of the observed AMT difference is due to item response bias and not due to true differences in the trait. There remained only weak evidence (p = .022) of a small difference with those of higher negative mood scoring 0.08 SD (SE = 0.037) higher on AMT. The results from the analysis examining DIF across gender and mood shows a greater attenuation for girls where 63% of the estimated difference between girls with and without mood symptoms was due to response bias compared with 41% for boys with this difference being driven primarily by the greater mood-DIF for the lonely item present in the girls sample. In other words, the estimated effect of mood on AMT was more biased in the girls.
Finally the effect of DIF on verbal IQ was less marked with an attenuation of 16%. Following adjustment, there was strong evidence (p <.001) of a small-to-moderate difference with those of high verbal IQ scoring 0.16 SD (0.034) higher on the trait.
DISCUSSION
This study utilised data collected on a written version of the AMT distributed to approximately 6000 thirteen-year-olds. The aim was to conduct a psychometric investigation of the measure and in particular to explore evidence of both mean differences and also differential item functioning with respect to gender, IQ and mood. Supporting previous work (Griffith et al., 2009) our results indicated that the data could be reliably coded and yielded a one-dimensional “OGM latent trait,” derived from the ordinal responses to 10 AMT items. The scale derived from these items appears to operate well over a wide range of the underlying trait, consistent with our aim of deriving a continuous measure of OGM. Our analyses also indicated that 2 of the 10 items—happy and bored—which appear to be simple and familiar, provided little useful information as they were poorly discriminating. The fact that these items, which to a naive researcher might seem to be ideally suited to a study of memory specificity in young teenagers, were less able to differentiate well between adolescents high and low in memory specificity illustrates the value of conducting psychometric analyses to guide cue word selection and highlights the utility of the IRT approach over the derivation of a sum-score that would treat all items as equal and give undue weight to those that are in fact poorly discriminating.
Consistent with the suggestions of Raes et al. (2007) and Debeer et al. (2009) as well as the findings of Griffith et al. (2009) the IRT analysis suggested that our minimal instructions were most informative for adolescents falling at around the mean level on the OGM trait. Additionally the standard error of the measurement was low, and hence estimates of the OGM trait were precise across a wide range of the study population. In a population sample where the long-term aim of data collection is to explore developmental trajectories across the spectrum of memory specificity this is encouraging. It also supports the suggestion that researchers should carefully consider the aims of their study and the nature of the population under investigation when deciding on the type of the instructions to give to participants.
Analysis of main effects indicated that in the current sample responses were more over-general in boys than girls, in those low in negative mood, and in those low in IQ. These findings were consistent between the traditional and IRT analyses. Differential item functioning within the IRT model was found to account for at least some of these main effects. In particular the current data identified strong evidence of differential item functioning for both gender and mood symptoms for some of the items. The findings regarding gender were difficult to interpret, with some items appearing to be “easier” for girls and some for boys, and this may reflect particular gender-specific associations for the cue words (as mentioned earlier). In most cases the biases were small/moderate, and there remained a significant main effect of gender on AMT score after accounting for DIF, consistent with previous studies that have identified increased specificity of recollection in older women (e.g., Pillemer et al., 2003).
Findings regarding mood symptoms were more clear-cut. Mood congruency effects produce a general shift in ease of accessibility of negative material (Williams et al., 1997) and the leftward shift in the item response functions for negative words in those above the median in negative mood would be consistent with such an effect. In the absence of a DIF analysis, the observed effect of mood on scores on the AMT might be interpreted as evidence of lower levels of trait OGM in adolescents reporting higher levels of negative mood. In fact a large portion of this effect is the result of a response bias rather than genuine differences in the underlying latent trait and conducting a DIF analysis allows for adjustment for this in the derived trait score if appropriate. In contrast to the effects of mood on Uniform DIF, the analyses did not show any evidence of Non-Uniform DIF for mood. Thus there was little evidence that the items were more able to provide information on the latent OGM trait for those above than below the median in mood symptoms. There is compelling evidence that children and adolescents with clinical levels of affective disturbance show OGM (e.g., Kuy-ken, Howell, & Dalgleish, 2006) but it remains true that even within clinical samples there is often found no correlation between severity of mood and degree of over-general recall.
Why, though, might there be an association between greater specificity and negative mood? The affect regulation hypothesis (Williams, 1996; Williams et al., 2007) states that one reason that people become over-general in their memory is because specific memories may contain events that are highly aversive for them, so they avoid such affect by truncating the search for specific memories. Although prominent in explaining why some people have over-general memories this theory needs to assume that, at some point earlier in development, people have learned an association between high specificity in memory and the exacerbation of affect, thereby motivating a switch to alternative mnemonic strategies (such as truncating search). This aspect of the theory had never received direct experimental support until a study by Raes et al. (2003) who found, in a sample of volunteer students not selected for symptoms of affective problems, that those who were highly specific on an autobiographical memory test showed more affective disturbance after failure on a puzzle task.
Drummond and colleagues (Drummond, Dritschel, Astell, O'Carroll, & Dalgleish, 2006) also have data that speak to this issue, studying samples of 7–11-year-olds. They found that emotion-focusing (as measured by tasks assessing the extent to which children categorised images and themes on the basis of the emotion being expressed in the card) had an important impact on the specificity of memory: Those children who were more likely to categorise the images and stimuli according to emotional categories were more specific in their autobiographical recall. This is consistent with the theory that greater specificity is at first associated with greater affective disturbance, then later gives way to decreased specificity as the search process is truncated if psychopathology develops and deepens. We suggest that this is what we are observing here, in this unselected sample. Despite this, we cannot rule out the possibility that such a bias might emerge were one to derive groups corresponding to those with and without clinically relevant levels of low mood.
Finally it was reassuring to note that, at least in this sample, there was little evidence of differential item functioning on the basis of verbal IQ. Thus the increased levels of OGM observed in those with lower IQ are likely to reflect true differences in the underlying levels of OGM, perhaps related to reduced executive resources, and are not simply a consequence of difficulties interpreting the task that might arise among those lower in verbal IQ affecting the ability of cues to provide information on the underlying trait. One note of caution we should add to this conclusion is regarding the time difference between the IQ and AMT data collection. Over the 5-year period between age 8 and 13 it is likely that IQ will have altered due to the number of developmental changes across this time period. Hence there will be misclassification in a measurement of IQ based on a median split. As we have no reason to suspect such misclassification would be differential, an attenuation of the IQ main effect is a possible result. It is possible that a different pattern of IQ-DIF findings would result from a more proximal IQ measurement.
There are a number of strengths and limitations that must be considered in interpreting the results. Most importantly the data collected in the ALSPAC sample, from almost 6000 adolescents, represent probably the largest study of autobiographical memory specificity yet undertaken and make analyses reported upon here possible. Those data also result in inherent limitations. While the sample is large, time and cost constraints precluded the individual testing of participants and so we have relied on a relatively short questionnaire-derived measure of OGM. Although previous studies have also utilised questionnaire versions of the AMT (Hermans et al., 2005; Raes et al., 2006) it would nevertheless have been preferable to conduct individual testing sessions so that the circumstances of data collection were more similar to those of previous studies of adolescents, or to validate the estimates of OGM derived from the questionnaire measure with estimates derived from face-to-face testing of a small but representative subset of the total sample.
While it is reassuring that there was little evidence of monotonic patterns of drop out or effects of IQ-related DIF, and that the measure appeared maximally sensitive to variations in memory specificity around the median level, there was evidence that those participants who provided AMT data had significantly higher IQ scores than those who did not provide data. This suggests that our sample is somewhat biased and represents a slightly higher-functioning group of 13-year-olds than average. Although this is not unexpected, it is important to take into account in interpreting these and any subsequent analyses derived from the data set.
A feature of the sample, which is both a strength and a limitation, is the fact that it comprised adolescents. The study of OGM in young adolescents, prior to the onset of significant psychopathology, is absolutely vital if we are to understand the origins of OGM and its relationship to vulnerability to depression and other problems. Although the establishment of adult patterns of autobiographical memory retrieval is a developmental process that extends into adolescence (Habermas & Bluck, 2000) the fact that the AMT yielded data from which an underlying trait score could be derived is very promising. Although our findings may not necessarily translate to adult samples, it is the case that the particulars of any differential item functioning study of this sort would be unlikely to translate to other samples directly because, by their nature, they refer to the properties of specific cue words in relation to the characteristics of the specific sample. However the general pattern of results observed is nevertheless important. This study illustrates the value of conducting DIF analysis where possible and highlights the importance of considering the possible effects of response bias on AMT results and their interpretation. They also indicate that significant gender and IQ main effects exist on the AMT. This suggests that studies must be careful to match samples for gender and IQ to prevent spurious between-group differences emerging due to these factors.
It has previously been suggested that positive and negatively valenced cues tap into a single underlying latent trait (Griffith et al., 2009; Van Vreeswijk & De Wilde, 2004) and that where OGM is observed for only positive or only negative cues this is likely to be a function of mood congruency as well as over-generality (Williams et al., 2007). The findings of the current study lend further support to this interpretation of existing data and suggest that there is no justification for analysing positively and negatively valenced cues separately. Rather, cue sets should be selected in order to have properties that enable them to discriminate well between individuals high and low in the latent trait within the range relevant to the population under investigation. In order for researchers to be able to select such cue word sets further research must be conducted for the purposes of obtaining psychometric data. Ideally such research would involve the administration of a version of the AMT that incorporated a much larger selection of cue words, chosen to vary systematically on a number of properties, to a large and representative sample of adults. This would allow for the creation of a cue word corpus from which words could be selected that would be maximally sensitive to variations in memory specificity within the appropriate range on the latent trait, or for the characteristics of the population in question. While this would be a significant undertaking given the continued interest in OGM and its downstream consequences, it is potentially one that would be very worthwhile.
In summary, we have demonstrated that there are number of advantages to deriving a latent trait measure of AMT within an item response theory framework compared with the traditional approach of deriving a sum-score based on the specificity of responses to each item, or counting the number of specific memories retrieved. First we have derived a scale that accounts for both the discrimination and the difficulty of the items administered such that an extended/specific response to the lonely/hopeless items is far more indicative of low OGM compared with such a response to happy/bored. In addition, this approach allows us to adjust our estimated trait for undesirable (though interesting) response biases that may contaminate the results of future analyses.
Acknowledgments
We are extremely grateful to all the families who took part in this study, the midwives for their help in recruiting them, and the whole ALSPAC team, which includes interviewers, computer and laboratory technicians, clerical workers, research scientists, volunteers, managers, receptionists, and nurses. The UK Medical Research Council (Grant ref: 74882) the Wellcome Trust (Grant ref: 076467), and the University of Bristol provide core support for ALSPAC. This publication is the work of the authors and Jon Heron, Catherine Crane, and Mark Williams will serve as guarantors for the contents of this paper. This research was specifically funded by the Wellcome Trust grant 067797/Z/02/A awarded to Professor Mark Williams.
APPENDIX A: CODING PROCEDURE AND RELIABILITY
Coding procedure
Responses to the 10 AMT questions were entered into an access database by an external keying bureau. Two members of the ALSPAC in-house data-preparation team (Jackie Bishop, JB; Genette Ellis, GE) were specifically trained in the coding of the AMT through a full day of instruction and use of a coding manual. The categories used to code responses were: specific (a response that referred to an event which would have occurred on a particular day, at a particular time and place, for example “playing football with my friends last Saturday”), extended (a response that referred to an event which would have occurred over a period of 2 days or more, for example “our school trip to France”), categoric (a response that referred to a category of events, “doing tests in Science”), associate (a semantic associate to the cue word, “school,” “my dad”), and error (statement such as “I can't remember” or statements that were incomprehensible or future-oriented, e.g. “next week I will go to see my granny”). Blank cells—where a child did not write anything at all—were not keyed and did not form part of the text database for coding. Such blanks were combined with errors to form a single group “omissions/errors” for the purpose of statistical analysis. The reliability assessment was only carried out on text that was present and coded (a total of approximately 40,000 items). Memories from a single child were coded together, in the order in which they were presented in the questionnaire.
Following training, an initial sample of 200 memories were taken at random and coded by JB, GE, and CC (an experienced rater) in order to determine initial reliability. These comparisons yielded a mean weighted kappa of .87 and a mean unweighted kappa of .80 (both excellent). Once this initial reliability was established, the final preparations for coding were made and data coding commenced. The coding guidelines used in training were developed further between JB, GE, and CC during the coding process, through email and telephone correspondence and local discussion, in order to ensure consistent coding of potentially ambiguous responses where a particular response of this type occurred frequently. Where the two ALSPAC coders disagreed on items that were double-rated these items were examined and a coding decision was made and recorded for future use. Where possible, coding decisions made during the course of coding the data were then applied to earlier cases through the use of key word searches (for example searching for the key word “Christmas”).
Reliability coefficients
Participant questionnaires were shared out randomly between JB and GE so that each would ultimately code approximately 50% of the responses. Data were coded in sets of 3000 responses each. During and after coding of each set, 10% random samples of the data (i.e., 300 responses from each coder) were taken and coded by the other coder, with weighted and unweighted kappa coefficients calculated to check for reliability. At the beginning, midway, and the end of the coding period, smaller sub-samples were triple coded by JB, GE, and CC. The overall agreement between JB and GE, based on double coding of the 10% sub-sample, was excellent, yielding a weighted kappa of .82 (unweighted kappa .78). The overall kappa for the agreement between GE, JB, and CC, based on 1222 responses, was also good to excellent, yielding a weighted kappa of .79 (unweighted kappa = .74). Once all the data had been coded, a final stratified random sample of 1000 memories was extracted from the data set. These 1000 responses were sampled equally from the five response categories (specific, extended, categoric, associate, error) in order to examine whether the coders were reliable for each type of response. This was to ensure that very high levels of reliability for some classes of response did not mask lower levels of reliability for others. Weighted kappas were good to excellent in each case, with unweighted kappas ranging from .76 for categoric and associate responses, to .77 for specific responses, .81 for extended responses and .93 for errors.
APPENDIX B: EXTENDED STATISTICAL METHODS
Item response models
A one-dimensional graded response model (Samejima, 1969) was fitted to the data. In item response models such as the graded response model, two types of parameter are estimated for each item: the item discrimination and threshold parameter(s) reflecting the item difficulty. These parameters are indirectly related to the form of the item response functions that show how the probability of responding in each item category changes as one moved along the latent trait.
The item discrimination parameter is similar to the item loading in more traditional factor analysis. In factor analysis a variable with a high loading is more strongly correlated with the underlying factor, and hence response to such an item provides more information about the factor than would a response to a variable that loaded less strongly. In the same way an item with a higher discrimination parameter can in some circumstances be thought to be more useful, as it is better at discriminating between respondents than an item with a lower discrimination parameter. However, in item response models there is a trade-off due to the non-linear relationship between response probabilities and trait score. A highly discriminating item will discriminate well but only across a small range of trait values, e.g., an item that discriminates almost perfectly between respondents with trait scores above and below zero will be of little use in a population of participants with trait scores far from this value. The item information function for a near-perfectly discriminating item would have a high peak around the trait level of zero but very low values at other points on the trait. In contrast an item at the same location that discriminates less perfectly between those above/below zero will provide information spread over a wider range of trait scores. It is important to consider the ultimate use of the scale, be it to compare respondents across the whole population or to screen at a particular trait value. In our analysis we are looking for a scale that operates well over the range of the trait where the bulk of the respondents fall, hence our test information function (sum of individual item information functions) should indicate an acceptable level of information across this range.
Item threshold parameters represent points along the latent trait and hence they can also be thought of as location parameters. For each of our four-category items there will be three such thresholds each representing one of the three item cut-points. For instance, take the first cut-point: omission/error versus associate or higher. As one moves up the latent trait towards higher levels of AMT the probability of giving a response that is an associate or better will increase. Were one to plot this probability against AMT, the curve would be sigmoid-shaped rising from a probability of zero at low levels of AMT to a probability of 1 at high levels. The point at which this curve meets the line corresponding to a probability of 0.5 gives the first threshold parameter. If the first threshold occurred at an AMT value of 0 then respondents at this point on the trait would be equally likely to give an omission/error response as they would be to give a response which is an associate or higher. Respondents with AMT < zero would be more likely to attain omission/error, and respondents with AMT > zero would be more likely to attain associate or higher. Items provide most information at their thresholds and hence we require items with a wide range of thresholds in order to spread information across the whole range of the trait. As mentioned above, thresholds parameters also indicate the difficulty of each item. An item with low threshold parameters is easy since a good score (i.e., extended/specific) is likely for most respondents. A more difficult item would have higher thresholds and hence one would need a higher AMT in order to give an extended/specific response.
Differential item functioning
Differential item functioning (DIF) also known as item response bias is a situation in which responses to one or more items differ systematically between two or more groups of individuals after conditioning on the latent trait. Differences in the set of responses between two individuals should only reflect differences in their trait level of AMT (plus random variation). In the case of DIF, an additional covariate such as gender is also related to their item responses such that even were these two respondents to have the same level of AMT, their responses would differ in a systematic (non-random) manner.
In the case of Uniform DIF, only the item thresholds may differ across groups which results in a horizontal shift of the item response functions for one group relative to the other. For instance, given a trait derived from responses to a battery of depressive symptoms, a female respondent at a particular point on the trait may have a higher probability of endorsing an item related to crying compared with a male at that same trait location (i.e., who has the same AMT score). In this situation the female would be said to find this item easier. In the case of non-uniform DIF the item discrimination (capacity to provide useful information on the level of the underlying latent trait) must differ between groups (although thresholds need not). This results in an intersection of the item response functions for the two groups such that one group, e.g., males may find an item easier in some region of the trait, while females find the item easier in another region. Alternatively one might say that an item with non-uniform DIF is more discriminating in one group compared to another.
Procedure for assessment of differential item functioning
As a first step a MIMIC model (Figure A1) was created with a main effect of gender on AMT but allowing for no gender response bias. Two new sets of 10 variables were then derived to indicate the responses separately for boys and girls. For instance, the boys’ response to the first item “happy” was equal to the original response if gender = boy, but set to missing if gender = girl, as used in “CvBL method” (Crane et al., 2007). A new MIMIC model was then derived as shown in Figure A2. Item loadings and thresholds were initially constrained between the male and female versions of each item to ensure that the model described in step one above had been accurately recreated. DIF was then examined in a stepwise manner by relaxing each parameter constraint in turn and examining the effect on the model fit.
Figure A1.
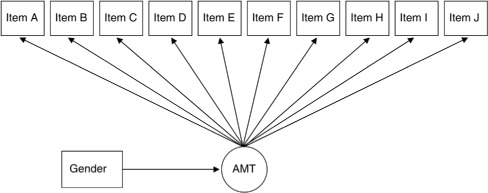
MIMIC model with main effect of gender on AMT.
Figure A2.
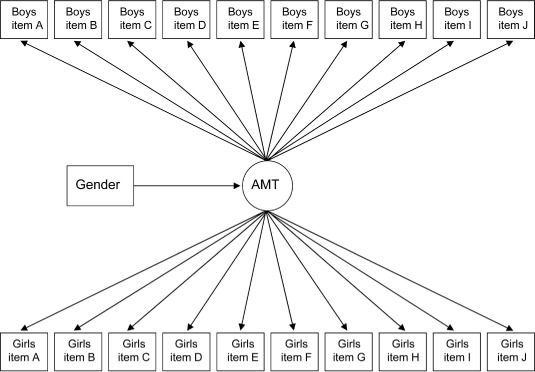
MIMIC approach to assessment of differential item functioning across gender groups.
Presence of uniform DIF was examined first by relaxing the constraints on the item thresholds. The thresholds were not completely relaxed, their separation was preserved, but their location (boys relative to girls) was allowed to vary. This procedure was permitted for each item in turn and the change in likelihood was recorded and converted to a set of chi-square statistics. There are a variety of ways for assessing the significance of any response bias, using odds ratios or adjusted p-values (Crane, van, & Larson, 2004). Here we chose to use a Bonferroni-corrected alpha-value of 0.05/20 = 0.0025 to allow for the multiple testing of uniform DIF and non-uniform DIF for each of the 10 items, which corresponds to an acceptance criterion of 9.14 (or change in likelihood of 4.57). We acknowledge that other decision methods may result in more or less items being regarded as possessing bias. For the item with the largest improvement in model fit, the relaxed thresholds were maintained and the procedure was started again, investigating the presence of uniform DIF for the remaining nine items. This continued until none of the remaining items led to a significant improvement in model fit.
The presence of non-uniform DIF was then examined in a similar stepwise manner by permitting item loadings to vary. The starting model for this stage was the model with adjustments for uniform DIF as described above. Item loadings were relaxed for each item in turn and again the effect on model fit was examined. For items that had not exhibited uniform DIF, item thresholds were relaxed at the same time as the loading incurring a 2 df test with a chi-square cut-point of 11.98. This was repeated until all gender uniform and non-uniform DIF had been adjusted for.
The same steps were carried out for the grouping defined by presence of mood symptoms, and again for IQ.
REFERENCES
- Angold A., Costello E. J., Messer S. C., Pickles A., Winder F., Silver D. Development of a short questionnaire for use in epidemiological studies of depression in children and adolescents. International Journal of Methods in Psychiatric Research. 1995;5:237–249. [Google Scholar]
- Angold A., Costello E. J., Worthman C. M. Puberty and depression: The roles of age, pubertal status and pubertal timing. Psychological Medicine. 1998;28(1):51–61. doi: 10.1017/s003329179700593x. [DOI] [PubMed] [Google Scholar]
- Birch L. S., Davidson K. M. Specificity of autobiographical memory in depressed older adults and its relationship with working memory and IQ. British Journal of Clinical Psychology. 2007;46(2):2–86. doi: 10.1348/014466506X119944. doi: 10.1348/014466506X119944. [DOI] [PubMed] [Google Scholar]
- Brittlebank A. D., Scott J., Williams J. M. G., Ferrier I. N. Autobiographical memory in depression: State or trait marker? British Journal of Psychiatry. 1993;162:118–121. doi: 10.1192/bjp.162.1.118. [DOI] [PubMed] [Google Scholar]
- Canivez G. L., Watkins M. W. Long-term stability of the Weschler Intelligence Scale for Children—Third Edition. Psychological Assessment. 1998;10:285–291. doi: 10.1037/1040-3590.10.3.285. [Google Scholar]
- Conway M. A., Pleydell-Pearce C. W. The construction of autobiographical memories in the self-memory system. Psychological Review. 2000;107(2):261–288. doi: 10.1037/0033-295x.107.2.261. [DOI] [PubMed] [Google Scholar]
- Costello E. J., Angold A. Scales to assess child and adolescent depression: Checklists, screens, and nets. Journal of the American Academy of Child & Adolescent Psychiatry. 1988;27(6):726–737. doi: 10.1097/00004583-198811000-00011. doi: 10.1097/00004583-198811000-00011. [DOI] [PubMed] [Google Scholar]
- Crane P. K., Gibbons L. E., Ocepek-Welikson K., Cook K., Cella D., Narasimhalu K., et al. A comparison of three sets of criteria for determining the presence of differential item functioning using ordinal logistic regression. Quality of Life Research. 2007;16(Suppl-84) doi: 10.1007/s11136-007-9185-5. doi: 10.1007/s11136-007-9185-5. [DOI] [PubMed] [Google Scholar]
- Crane P. K., van B. G., Larson E. B. Test bias in a cognitive test: Differential item functioning in the CASI. Statistics in Medicine. 2004;23(2):241–256. doi: 10.1002/sim.1713. [DOI] [PubMed] [Google Scholar]
- Crovitz H. F., Schiffman H. Frequency of episodic memories as a function of their age. Bulletin of the Psychonomic Society. 1974;4(NB5):517–518. [Google Scholar]
- Dalgleish T., Tchanturia K., Serpell L., Hems S., Yiend J., de Silva P., et al. Self-reported parental abuse relates to autobiographical memory style in patients with eating disorders. Emotion. 2003;3(3):211–222. doi: 10.1037/1528-3542.3.3.211. doi: 10.1037/1528-3542.3.3.211. [DOI] [PubMed] [Google Scholar]
- Debeer E., Hermans D., Raes F. Associations between components of rumination and autobiographical memory specificity as measured by a Minimal Instructions Autobiographical Memory Test. Memory. 2009;17(8):892–903. doi: 10.1080/09658210903376243. doi: 10.1080/0965821090337624. [DOI] [PubMed] [Google Scholar]
- Drummond L. E., Dritschel B., Astell A., O'Carroll R. E., Dalgleish T. Effects of age, dysphoria, and emotion-focusing on autobiographical memory specificity in children. Cognition & Emotion. 2006;20(3–4):488–505. doi: 10.1080/02699930500341342. doi: 10.1080/02699930500341342. [DOI] [PubMed] [Google Scholar]
- Galton F. Psychometric experiments. Brain. 1879;2:148–162. [Google Scholar]
- Gibbs B. R., Rude S. S. Overgeneral autobiographical memory as depression vulnerability. Cognitive Therapy and Research. 2004;28:511–526. doi: 10.1023/B:COTR.0000045561.72997.7c. [Google Scholar]
- Golding J., Pembrey M., Jones R. ALSPAC – the Avon Longitudinal Study of Parents and Children. I. Study methodology. Paediatric and Perinatal Epidemiology. 2001;15(1):74–87. doi: 10.1046/j.1365-3016.2001.00325.x. [DOI] [PubMed] [Google Scholar]
- Griffith J. W., Sumner J. A., Debeer E., Raes F., Hermans D., Mineka S., et al. An item response theory/confirmatory factor analysis of the Autobiographical Memory Test. Memory. 2009;17(6):609–623. doi: 10.1080/09658210902939348. doi: 10.1080/09658210902939348. [DOI] [PMC free article] [PubMed] [Google Scholar]
- Habermas T., Bluck S. Getting a life: the emergence of the life story in adolescence. Psychological Bulletin. 2000;126(5):748–769. doi: 10.1037/0033-2909.126.5.748. doi: 10.1037/0033-2909.126.5.748. [DOI] [PubMed] [Google Scholar]
- Hauer B. J., Wessel I., Engelhard I. M., Peeters L. L., Dalgleish T. Prepartum autobiographical memory specificity predicts post-traumatic stress symptoms following complicated pregnancy. Memory. 2009;17(5):544–556. doi: 10.1080/09658210902953836. doi: 10.1080/09658210902953836. [DOI] [PubMed] [Google Scholar]
- Henderson D., Hargreaves I., Gregory S., Williams J. M. G. Autobiographical memory and emotion in a non-clinical sample of women with and without a reported history of childhood sexual abuse. British Journal of Clinical Psychology. 2002;41(2):2–41. doi: 10.1348/014466502163921. [DOI] [PubMed] [Google Scholar]
- Herlitz A., Nilsson L. G., Backman L. Gender differences in episodic memory. Memory and Cognition. 1997;25(6):801–811. doi: 10.3758/bf03211324. PM:9421566. [DOI] [PubMed] [Google Scholar]
- Hermans D., Defranc A., Raes F., Williams J. M. G., Eelen P. Reduced autobiographical memory specificity as an avoidant coping style. British Journal of Clinical Psychology. 2005;44(4):4–9. doi: 10.1348/014466505X53461. doi: 10.1348/014466505X53461. [DOI] [PubMed] [Google Scholar]
- Joinson C., Heron J., Butler R., von Gontard A., Butler U., Emond A., et al. A United Kingdom population-based study of intellectual capacities in children with and without soiling, daytime wetting, and bed-wetting. Pediatrics. 2007;120(2):e308–e316. doi: 10.1542/peds.2006-2891. doi: 10.1542/peds.2006-2891. [DOI] [PubMed] [Google Scholar]
- Kessler R. C., Angermeyer M., Anthony J. C., De Graaf R., Demyttenaere K., Gasquet I., et al. Lifetime prevalence and age-of-onset distributions of mental disorders in the World Health Organization's World Mental Health Survey Initiative. World Psychiatry. 2007;6(3):168–176. [PMC free article] [PubMed] [Google Scholar]
- Kuyken W., Dalgleish T. Autobiographical memory and depression. British Journal of Clinical Psychology. 1995;34(1):89–92. doi: 10.1111/j.2044-8260.1995.tb01441.x. [DOI] [PubMed] [Google Scholar]
- Kuyken W., Howell R., Dalgleish T. Over-general autobiographical memory in depressed adolescents with, versus without, a reported history of trauma. Journal of Abnormal Psychology. 2006;115(3):387–396. doi: 10.1037/0021-843X.115.3.387. doi: 10.1037/0021-843X.115.3.387. [DOI] [PubMed] [Google Scholar]
- Lovejoy S. Children's Printed Word Database. Manual and documentation version 1.3. Autumn. 2003. 2002. Retrieved from http://www.essex.ac.uk/psychology/cpwd/
- Mackinger H. F., Pachinger M. M., Leibetseder M. M., Fartacek R. R. Autobiographical memories in women remitted from major depression. Journal of Abnormal Psychology. 2000;109(2):331–334. doi: 10.1037/0021-843X.109.2.331. [PubMed] [Google Scholar]
- Muthén L. K., Muthén B. O. Mplus user's guide. Fifth edition. Los Angeles, CA: Muthén & Muthén; 2007. [Google Scholar]
- Nelson K., Fivush R. The emergence of autobiographical memory: A social cultural developmental theory. Psychological Review. 2004;111(2):486–511. doi: 10.1037/0033-295X.111.2.486. doi: 10.1037/0033-295X.111.2.486. [DOI] [PubMed] [Google Scholar]
- Pillemer D. B., Wink P., DiDonato T. E., Sanborn R. L. Gender differences in autobiographical memory styles of older adults. Memory. 2003;11(6):525–532. doi: 10.1080/09658210244000117. [DOI] [PubMed] [Google Scholar]
- Raes F., Hermans D., de Dekker A., Eelen P., Williams J. M. G. Autobiographical memory specificity and affect regulation: An experimental approach. Emotion. 2003;3:201–206. doi: 10.1037/1528-3542.3.2.201. [DOI] [PubMed] [Google Scholar]
- Raes F., Hermans D., Williams J. M. G., Eelen P. Reduced autobiographical memory specificity and affect regulation. Cognition and Emotion. 2006;20:402–429. doi: 10.1080/02699930500341003. doi: 10.1348/014466505X53461. [DOI] [PubMed] [Google Scholar]
- Raes F., Hermans D., Williams J. M. G., Eelen P. A sentence completion procedure as an alternative to the Autobiographical Memory Test for assessing overgeneral memory in non-clinical populations. Memory. 2007;15(5):495–507. doi: 10.1080/09658210701390982. doi: 10.1080/09658210701390982. [DOI] [PMC free article] [PubMed] [Google Scholar]
- Reese E., Fivush R. Parental styles of talking about the past. Developmental Psychology. 1993;29(3):596–606. [Google Scholar]
- Robinson J. A. Sampling autobiographical memory. Cognitive Psychology. 1976;8(4):578–595. ISI:A1976CF96500006. [Google Scholar]
- Robinson J. A. Affect and retrieval of personal memories. Motivation and Emotion. 1980;4:149–174. [Google Scholar]
- Rubin D. C. 51 Properties of 125 words—A unit analysis of verbal-behavior. Journal of Verbal Learning and Verbal Behavior. 1980;19(6):736–755. [Google Scholar]
- Samejima F. Estimation of latent ability using a response pattern of graded scores. Psychometrika Monograph Supplement. 1969;34:100–114. [Google Scholar]
- Spinhoven P., Bockting C. L., Schene A. H., Koeter M. W., Wekking E. M., Williams J. M. G. Autobiographical memory in the euthymic phase of recurrent depression. Journal of Abnormal Psychology. 2006;115(3):590–600. doi: 10.1037/0021-843X.115.3.590. doi: 10.1037/0021-843X.115.3.590. [DOI] [PubMed] [Google Scholar]
- StataCorp. Stata Statistical Software: Release 10. College Station, TX: StataCorp LP; 2007. [Google Scholar]
- van Minnen A., Wessel I., Verhaak C., Smeenk J. The relationship between autobiographical memory specificity and depressed mood following a stressful life event: A prospective study. British Journal of Clinical Psychology. 2005;44(3):3–15. doi: 10.1348/014466505X29648. doi: 10.1348/014466505X29648. [DOI] [PubMed] [Google Scholar]
- van Schuur W. H. Mokken scale analysis: Between the Guttman scale and parametric item response theory. Political Analysis. 2003;11:139–163. [Google Scholar]
- Van Vreeswijk M. F., De Wilde E. J. Autobiographical memory specificity, psychopathology, depressed mood and the use of the Autobiographical Memory Test: A meta-analysis. Behaviour Research & Therapy. 2004;42(6):731–743. doi: 10.1016/S0005-7967(03)00194-3. doi: 10.1016/S0005-7967(03)00194-3. [DOI] [PubMed] [Google Scholar]
- Wechsler D., Golombok S., Rust J. UK manual 3rd ed. Sidcup, UK: The Psychological Corporation; 1992. WISC-III UK: Wechsler Intelligence Scale for Children. [Google Scholar]
- Wessel I., Meeren M., Peeters F., Arntz A., Merckelbach H. Correlates of autobiographical memory specificity: The role of depression, anxiety and childhood trauma. Behaviour Research & Therapy. 2001;39(4):409–421. doi: 10.1016/s0005-7967(00)00011-5. doi:10.1016/S0005-7967(00)00011-5. [DOI] [PubMed] [Google Scholar]
- Wessel I., Merckelbach H., Dekkers T. Autobiographical memory specificity, intrusive memory, and general memory skills in Dutch-Indonesian survivors of the World War II era. Journal of Traumatic Stress. 2002;15(3):227–234. doi: 10.1023/A:1015207428675. doi: 10.1023/A:1015207428675. [DOI] [PubMed] [Google Scholar]
- Williams J. M. G. Depression and the specificity of autobiographical memory. In: Rubin D. C., editor. Remembering our past: Studies in autobiographical memory. Cambridge, UK: Cambridge University Press; 1996. pp. 244–267. [Google Scholar]
- Williams J. M. G., Barnhofer T., Crane C., Hermans D., Raes F., Watkins E., et al. Autobiographical memory specificity and emotional disorder. Psychological Bulletin. 2007;133(1):122–148. doi: 10.1037/0033-2909.133.1.122. doi: 10.1037/0033-2909.133.1.122. [DOI] [PMC free article] [PubMed] [Google Scholar]
- Williams J. M. G., Broadbent K. Autobiographical memory in suicide attempters. Journal of Abnormal Psychology. 1986;95(2):144–149. doi: 10.1037//0021-843x.95.2.144. [DOI] [PubMed] [Google Scholar]
- Williams J. M. G., Dritschel B. Categoric and extended autobiographical memories. In: Conway M. A., Rubin D. C., Spinnler H., Wagenaar W. A., editors. Theoretical perspectives on autobiographical memory. The Netherlands: Kluwer Academic Publishers; 1992. pp. 391–409. [Google Scholar]
- Williams J. M. G., Healey H., Ellis N. C. The effect of imageabiltiy and predictability of cues in autobiographical memory. Quarterly Journal of Experimental Psychology: Section A. 1999;52(3):555–579. doi: 10.1080/713755828. [DOI] [PubMed] [Google Scholar]
- Williams J. M. G., Watts F. N., MacLeod C., Matthews A. Cognitive psychology and emotional disorders. 2nd ed. Chichester, UK: Wiley; 1997. [Google Scholar]
- Zisook S., Lesser I., Stewart J. W., Wisniewski S. R., Balasubramani G. K., Fava M., et al. Effect of age at onset on the course of major depressive disorder. American Journal of Psychiatry. 2007;164(10):1539–1546. doi: 10.1176/appi.ajp.2007.06101757. doi: 10.1176/appi.ajp.2007.06101757. [DOI] [PubMed] [Google Scholar]