Abstract
The diffusion and consumption of substrate from capillaries are basic in human physiology. The general solution for the concentration in a region containing many parallel non-homogeneous capillaries is found. Except in very special cases, capillary supply regions cannot be approximated by Krogh’s cylinder or Voronoi polygonal cylinders.
Keywords: Capillary, Diffusion, Heterogeneity
1. Introduction
The tissue region serviced by a certain capillary is called the capillary supply region. Let us consider the case when the capillaries are long and parallel, such as those in the skeletal muscle. In the classical approach the capillary supply region is approximated by a circular cylinder (Krogh cylinder) with a central capillary. Since the length of the cylinder is about 100 times cylinder diameter, in most cases the longitudinal diffusion of solute (such as oxygen) may be neglected in comparison to radial diffusion. The axisymmetric steady-state diffusion equation is thus
| (1) |
where D is the diffusion coefficient, C’ is the concentration (or partial pressure) of solute and κ is the constant consumption per volume of tissue. The boundary conditions are that on the capillary wall r’ = rc the concentration is Cc and on the tissue cylinder rt there is no flux or the radial derivative of concentration is zero. The solution is the Krogh–Erlang equation [1]:
| (2) |
Here Cc may be a slowly varying function of axial distance. More detailed solutions of the Krogh cylinder (e.g. axial variations) may be found in Middleman [2] and Lightfoot [3] and the reviews of Fletcher [4] and Popel [5].
The Krogh circular tissue cylinder was an approximation to the stacked hexagonal cylinder. The non-circular equilateral triangular, square and hexagonal cylinders were numerically computed by Gonzalez-Fernandez and Atta [6]. It was found that the corners of the polygons are most susceptible to hypoxia (lethal corner). The stacking of regular polygonal cylinders still require both (1) all capillaries are same (flow, substrate diameter) and (2) capillaries are evenly distributed in a regular array. By symmetry, a single Krogh cylinder would represent all. The question we ask is, what if there is unevenness, or heterogeneity in the distribution of capillaries, and/or flow (or solute content) variations in the capillaries?
For multiple capillaries, the area (volume) allotted to each capillary is usually not the same as the capillary supply region. The former is called the capillary domain which is a descriptive measure of capillary spacing [7,8]. The latter is a functional measure of the capillary diffusion region, and would change with changes in perfusion, such as partial occlusion of some capillaries. Capillary domains, best described by Voronoi polygons, coincide with capillary supply regions if the capillaries are of the same strength and even distribution. Some special uneven periodic distributions are also possible (Fig. 1). However, if some capillaries are of different strength, then Voronoi boundary could not be the capillary supply boundary. Consider two adjacent nodes of different strength. The Voronoi boundary is the perpendicular bisector (Fig. 2(a)). But the concentration of the solute is not the same at the midpoint. Consequently the capillary supply boundary must shift toward the weaker node. It may also be curved as in Fig. 2(b).
Fig. 1.
Some special cases of capillary supply boundaries which are also Voronoi boundaries.
Fig. 2.
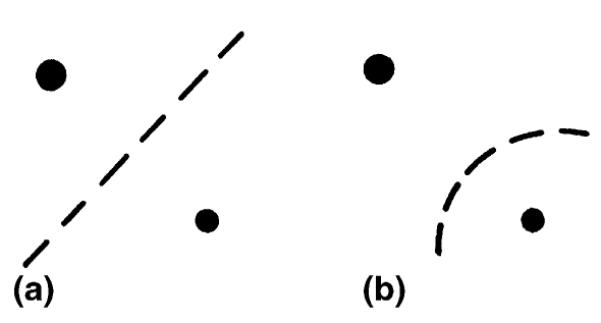
(a) Voronoi boundary, (b) capillary supply boundary. (Size of dot represents source strength.)
Previous work which studied uneven capillaries include Clark et al. [9] who used a method of imaging. However, capillary supply regions were not considered. Hoofd et al. [10] and Hoofd [11] required only the net flux on the boundary be zero. As we shall discuss later, such a solution may be non-unique.
The present paper is a complete analytical study of the capillary supply region.
2. Superposition of many capillaries
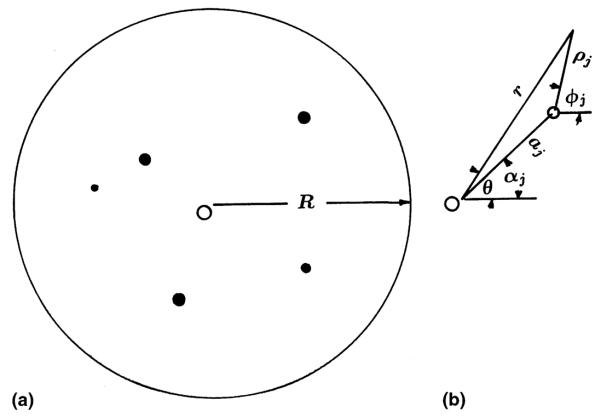
Consider a large circular region of radius R, containing N capillaries of uneven locations and diffusion strength (Fig. 3(a)). We assume no place in the region is anoxic, i.e., everywhere the consumption is κ per volume. Let q’j be the rate of amount of solute (per length of capillary) out of the jth capillary, with radius ρc centered at r’ = aj, θ = αj. The balance of mass flux gives a condition on q’j:
| (3) |
In polar coordinates the governing equation in two dimensions is
| (4) |
The boundary conditions are, on each capillary
| (5) |
where are local cylindrical coordinates centered at each capillary. On the boundary of the region we require no flux
| (6) |
Let all capillaries have the same size. Normalize all lengths by R, the concentration by κR2/D and the flux by πκR2 and drop primes. In terms of normalized parameters the equations are
| (7) |
| (8) |
| (9) |
where is the identical radii of the capillaries. The general solution to Eqs. (7) and (8) is
| (10) |
The first term on the right-hand side of Eq. (10) is the particular solution due to uniform consumption. The second term is a combination of sources from each capillary. The last sum is the homogeneous solution which was treated differently by previous authors. These terms are important since the particular solution r2/4 is coordinate specific, thus by itself not general enough.
Fig. 3.
(a) A general distribution of capillaries in a circular region, (b) The coordinate system. O represents the origin of the polar coordinates.
The relation between , φj and r, θ is (Fig. 3(b))
| (11) |
.
Since ε is small, the concentration on the capillary wall depends on capillary radius ε. From Eq. (10). The coefficients An, Bn, are to be determined by the boundary condition at r = 1. The radial derivative of Eq. (10) is
| (12) |
Eq. (9) becomes
| (13) |
Multiply Eq. (13) by cos(mθ) and integrate from 0 to 2π gives
| (14) |
| (15) |
where
| (16) |
Here ψ = θ - αj and we have used integration formulas from Gradshteyn and Ryzhik [12]. Thus from Eq. (14)
| (17) |
Eq. (15) checks the second part of Eq. (8). Similarly multiply Eq. (13) by sin (mθ) and integrate,
| (18) |
where
| (19) |
Thus
| (20) |
The solution C(r, θ) is thus determined, except for an additive constant A0 which is due to our Neumann type boundary conditions. We set A0 such that C ≥ 0 always.
3. Singularities of C(r, θ)
The singularities in the region are where the slope of C = constant curves have multiple values. The condition is
| (21) |
Then
| (22) |
| (23) |
It is, however, very difficult to solve for v(r, θ) = 0, u(r, θ) = 0. A numerical method is as follows.
For an array of grid points in the region, i.e., given the location (xi, yi) one can find the corresponding polar coordinate (rj, θi). Then at that point write
| (24) |
The confluence of all four types 1,2,3,4 is a singularity where both u and v are zero. The location can be refined by decreasing the spacing of the grid points.
For C(r, θ) we expect two kinds of singularities: the center and the saddle point (Fig. 4(a)).
Fig. 4.

(a) Singularities of the concentration C, (b) corresponding singularities of the flux f.
The study of singularities of C(r, θ) is important because they are related to the singularities of the flux lines (paths of solute flux). Since flux is parallel to the concentration gradient, it is normal to C = const. lines. Thus for flux, a nodal point occurs at the center point of C, and a saddle point occurs at a saddle of C, i.e., the flux singularities are the same location as the concentration singularities, but may be different type (Fig. 4(b)).
4. The flux lines
There is no easy way to draw the flux lines, which span the capillary supply regions. All we know is that the flux lines are perpendicular to the constant C lines. Since Fourier diffusion theorem gives
| (25) |
The flux direction is parallel to ▽C. Thus at each grid location one can draw the direction of q = (v, u) to show the flux direction. This is equivalent to the ‘method of isoclines’.
The flux arrows are helpful in showing the approximate capillary domains. In order to determine exactly the domain boundaries one must use numerical integration. (The function C is not potential, thus in general has no conformal representation.)
The method is as follows. Starting from any point (x0, y0), one evaluates the local direction from velocities {v(r, θ), u(r, θ)} = q and the new point (x1, y1) is computed from
| (26) |
Here ds is a given step size. The process continues for M steps. Starting from any point close to the saddle point the algorithm computes a curve very close to the domain boundary.
In what follows we shall give some examples.
5. Two capillaries of uneven strength
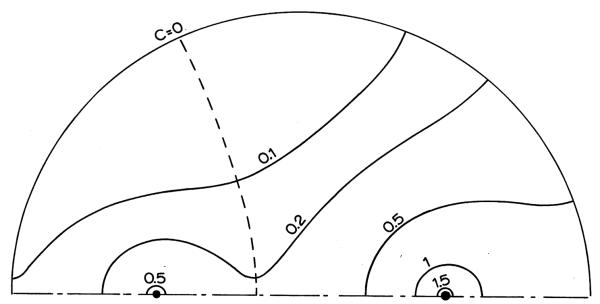
Consider two capillaries of uneven strength in a circular region. Let q1 = 2/3, a1 = 0.5, α1 = 0, q2 = 1/3, a2 = 0.5, α2 = π. Using Eq. (10) we find the minimum on the boundary is at (1, 2.08) and we can set A0 such that C(1, 2.08) = 0. The concentration lines are shown in Fig. 5. Then use Eqs. (22)–(24) to for singularities. Aside from the source points at (0.5, 0) and (0.5, π), and the singularity due to polar coordinates at the origin, we find the singularities are at (1, 0), (1, π), (0.16, π), (1, −2.08), (1, 2.08). Using the flux directions, it is concluded the (0, 1), (1, π), and (0.16, π) are saddles and (1, −2.08), (1, 2.08) are nodes. Guided by Fig. 5, the capillary domains must be separated by a curve connecting (0.16, π) to (1, ±2.08). Starting from a point close to (0.16 π) one can use Eq. (26) to plot the capillary domain boundary, shown as dashed a line in Fig. 5. Note that this boundary is neither straight or equidistance from the source points, thus could not be a Voronoi partition.
Fig. 5.
Concentration curves of two capillaries of unequal strength. Dashed line shows capillary supply boundary.
6. Seven capillaries at random locations
First consider the capillaries are of equal strength. We set qk = 1/7 for k = 1 to 7. The locations are random (generated by a random number generator).
We adjusted A0 (= 0.0054) such the C(1, θ) ≥ 0. This also implies C(r, θ) ≥ 0 since qi are positive.
Fig. 6 shows the constant concentration lines. The capillary supply regions are more difficult to obtain. The method is as follows. First we seek the singular points. Those inside the circular region are centers (the capillary locations) and saddles, including a saddle due to polar coordinates at origin. From an interior saddle, trace the flux curve using Eq. (26). These curves separate capillary supply regions. Fig. 7 shows the capillary supply regions found. Each capillary serves an area of same size (π/7) due to equal source strength. These regions are very different from Krogh circles of Voronoi polygons.
Fig. 6.
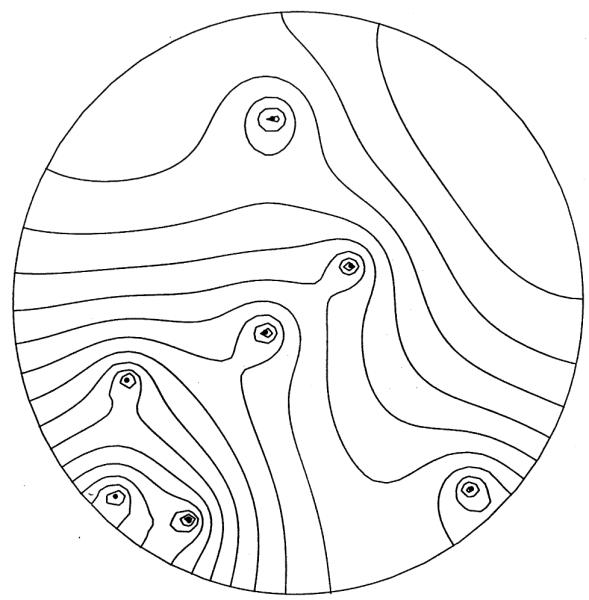
Concentration curves of seven capillaries of equal strength, but unevenly distributed (ΔC = 0.05, C = 0 at a point on upper right boundary).
Fig. 7.
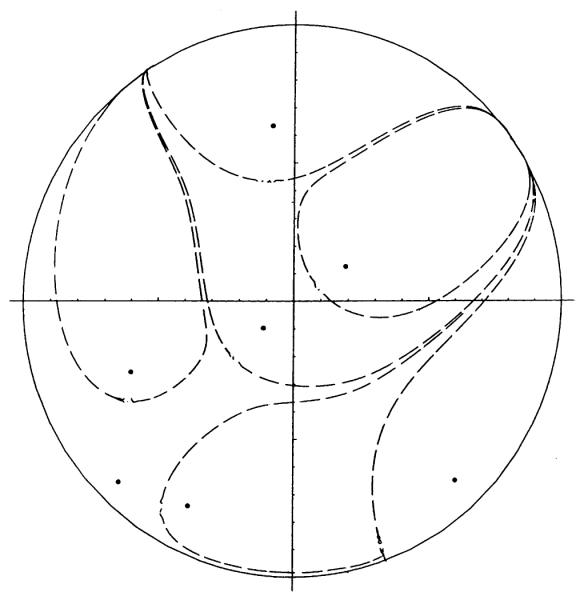
The capillary supply regions corresponding to Fig. 6.
Next consider the case where the capillary strengths are also random. Generate seven random numbers and use their fractional proportion of the total such that . A result for qk is (0.1757, 0.1767, 0.0222, 0.0267, 0.0652, 0.2955, 0.2379). The locations are the same as before. The concentration lines are shown in Fig. 8 and the corresponding capillary supply regions are shown in Fig. 9. Due to constant consumption, the area of each region is proportional to the source strength.
Fig. 8.
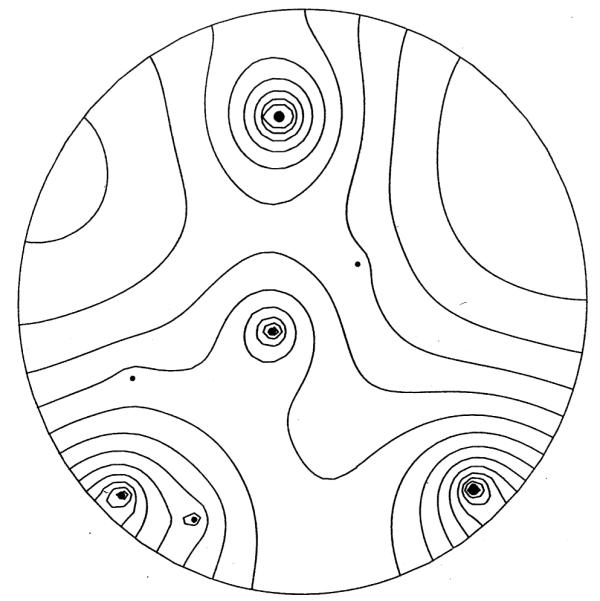
Concentration curves of seven capillaries of unequal strength. (ΔC = 0.05, C = 0 at a point on upper right boundary.)
Fig. 9.
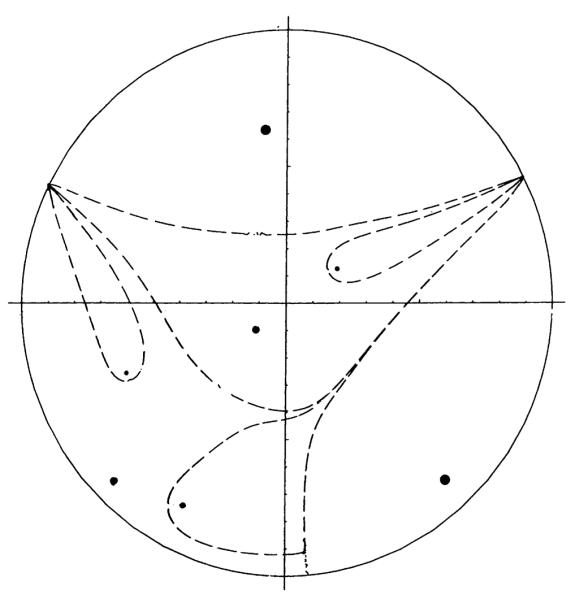
The capillary supply regions corresponding to Fig. 8.
7. Discussions
Except in special cases (e.g., those in Fig. 1) the areas enclosed by each Voronoi polygon are of varied sizes. If Voronoi polygons also represent capillary supply areas, the capillary strengths, which are proportional to each area, would not be the same. From our arguments (see Fig. 2) the capillary supply boundary cannot be a Voronoi bisector as assumed. Hoofd et al. [10] found the capillary supply areas are similar to Voronoi polygons. This is probably because in their simulation somewhat even strength and somewhat even distribution of capillaries are used, unlike the cases illustrated in this paper.
Clark et al. [9] used an image method to compute the concentration inside a circular region. Their results, when computed, are identical to our Eq. (10). Hoofd [11] used a different boundary condition which is not unreasonable and effectively replaced the last term of Eq. (10) by a constant. However, Hoofd’s specific solution, the r2/4 term, is coordinate sensitive. One can artificially shift the origin of the polar coordinates and thus obtain a different solution without changing the geometrical problem. Also, any homogeneous solution can be included into the specific solution. Thus Hoofd’s formulation may be non-unique.
Singularities of a field are essentially centers, saddles, and nodes. Let us consider the family of flux lines which cannot have centers. It is evident the only nodes in the interior of the region are the capillaries sources where the flux lines originate. The boundary of the region is a flux line and thus can only accommodate saddles where the flux lines turn around and nodes (sinks) where the flux lines terminates. The interior can also have saddles which are on the capillary supply boundaries. Since the concentration lines are orthogonal to the flux lines, we find concentration centers at the capillaries and on the boundary of the region, no concentration nodes, and saddless can occur anywhere. Our numerical method also finds the origin is a singularity. This is from the inherent singular nature of the origin of polar coordinates (Jacobian is zero) and should not be considered as a true singularity of the concentration.
8. Conclusions
We have devised a method to compute capillary supply regions due to uneven capillary distribution and diffusional strength. Our analytic solution satisfies all boundary conditions, including the zero flux condition on the organ boundary, at present a circle.
Except for highly homogeneous cases, the capillary supply region shapes differ substantially from the Krogh circle, or Voronoi polygons. Regions are simply connected, but may have complex shape. These shapes are sensitive not only to the location but also the relative diffusion strength of the capillaries. For example, a partial blockage of a certain capillary may not cause local anoxia, the other (all) capillaries compensate by shifting capillary supply regions.
| k | ak | α k |
|---|---|---|
| 1 | 0.9185 | 3.934 |
| 2 | 0.1476 | 3.863 |
| 3 | 0.2280 | 0.586 |
| 4 | 0.6534 | 3.545 |
| 5 | 0.8351 | 4.232 |
| 6 | 0.6394 | 1.695 |
| 7 | 0.8834 | 5.461 |
Acknowledgements
This work is partially supported by NIH Grant RR-01243.
References
- [1].Krogh A. The number and distribution of capillaries in muscles with calculations of the oxygen pressure head necessary for supplying the tissue. J. Physiol. 1919;52:409. doi: 10.1113/jphysiol.1919.sp001839. [DOI] [PMC free article] [PubMed] [Google Scholar]
- [2].Middleman S. Transport Phenomena in the Cardiovascular System. Wiley; New York: 1972. [Google Scholar]
- [3].Lightfoot EN. Transport Phenomena and Living Systems. Wiley; New York: 1974. [Google Scholar]
- [4].Fletcher JE. Mathematical modelling of the microcirculation. Math. Biosci. 1978;38:159. [Google Scholar]
- [5].Popel AS. Theory of oxygen transport to tissue. Crit. Rev. Biomed. Eng. 1989;17:257. [PMC free article] [PubMed] [Google Scholar]
- [6].Gonzalez-Fernandez JM, Atta SE. Concentration of oxygen around capillaries in polygonal regions of supply. Math. Biosci. 1972;13:55. [Google Scholar]
- [7].Hoofd L, Turek Z, Kubat K, Ringnalda BEM, Kazda S. Kreuzer F, et al., editors. Variability of intercapillary distance estimated on histological sections of rat heart. Oxygen Transport to Tissue VII. Adv. Exp. Med. Biol. 1985. p. 239. [DOI] [PubMed]
- [8].Egginton S. Morphometric analysis of tissue capillary supply. In: Boulilier RG, editor. Adv. Comp. Environ. Physiol. vol. 6. Springer; Berlin: 1990. [Google Scholar]
- [9].Clark PA, Kennedy SP, Clark A., Jr. Rakusan K, et al., editors. Buffering of muscle tissue in PO2 levels by the oxygen field from many capillaries. Oxygen Transport to Tissue XI. Adv. Exp. Med. Biol. 1989. p. 165. [DOI] [PubMed]
- [10].Hoofd L, Turek Z, Olders J. Calculation of oxygen pressures and fluxes in a flat plane perpendicular to any capillary distribution. Oxygen Transport to Tissue XI. Adv. Exp. Med. Biol. 1989;248:187. doi: 10.1007/978-1-4684-5643-1_23. [DOI] [PubMed] [Google Scholar]
- [11].Hoofd L. Calculation of oxygen pressures in tissue with anisotropic capillary orientation I. Two-dimensional analytical solution for arbitrary capillary characteristics. Math. Biosci. 1995;129:1. doi: 10.1016/0025-5564(94)00049-6. [DOI] [PubMed] [Google Scholar]
- [12].Gradshteyn IS, Ryzhik IM. Tables of Integrals Series and Products. 5th ed Academic Press; San Diego, CA: 1994. [Google Scholar]


