

Abstract
Molecular mechanisms of salty taste in mammals are not completely understood. We use genetic approaches to study these mechanisms. Previously, we developed a high-throughput procedure to measure NaCl taste thresholds, which involves conditioning mice to avoid LiCl and then examining avoidance of NaCl solutions presented in 48-h 2-bottle preference tests. Using this procedure, we measured NaCl taste thresholds of mice from 13 genealogically divergent inbred stains: 129P3/J, A/J, BALB/cByJ, C3H/HeJ, C57BL/6ByJ, C57BL/6J, CBA/J, CE/J, DBA/2J, FVB/NJ, NZB/BlNJ, PWK/PhJ, and SJL/J. We found substantial strain variation in NaCl taste thresholds: mice from the A/J and 129P3/J strains had high thresholds (were less sensitive), whereas mice from the BALB/cByJ, C57BL/6J, C57BL/6ByJ, CE/J, DBA/2J, NZB/BINJ, and SJL/J had low thresholds (were more sensitive). NaCl taste thresholds measured in this study did not significantly correlate with NaCl preferences or amiloride sensitivity of chorda tympani nerve responses to NaCl determined in the same strains in other studies. To examine whether strain differences in NaCl taste thresholds could have been affected by variation in learning ability or sensitivity to toxic effects of LiCl, we used the same method to measure citric acid taste thresholds in 4 inbred strains with large differences in NaCl taste thresholds but similar acid sensitivity in preference tests (129P3/J, A/J, C57BL/6J, and DBA/2J). Citric acid taste thresholds were similar in these 4 strains. This suggests that our technique measures taste quality–specific thresholds that are likely to represent differences in peripheral taste responsiveness. The strain differences in NaCl taste sensitivity found in this study provide a basis for genetic analysis of this phenotype.
Keywords: conditioned taste aversion, mice, salt, sensitivity, taste
Introduction
Salty taste is recognized as 1 of the 5 basic tastes for mammals, which allows animals to detect an important nutrient, sodium and to maintain sodium homeostasis (McCaughey and Scott 1998; Lindemann 2001). Recent studies discovered mammalian taste receptors for bitter, sweet, umami, and possibly sour taste (reviewed in Chandrashekar et al. 2006; Bachmanov and Beauchamp 2007). However, mechanisms of salty taste reception are less understood. In rats, hamsters, and some strains of mice, activity in the gustatory nerve, chorda tympani, evoked by lingual application of sodium salts is partially blocked by amiloride, a diuretic that inhibits the epithelial sodium channel (ENaC) (reviewed in Halpern 1998). Results of these earlier studies suggested that ENaC may be involved in reception of sodium taste. Recent work with genetically engineered mice has confirmed the importance of ENaC in mediating sodium taste in mice (Bosak et al. 2010; Chandrashekar et al. 2010). However, molecular mechanisms of the amiloride-insensitive component of taste responses to sodium are still not clear, although a splicing variant encoded by the Trpv1 gene has been proposed as a candidate mechanism (Lyall et al. 2004, but see Ruiz et al. 2006; Treesukosol et al. 2007). Little is known about the molecular mechanisms of intracellular transduction and transmission of both amiloride-sensitive and amiloride-insensitive salt taste responses.
We have initiated studies aimed to understand the mechanism of salt taste perception using the genetic approach. Genetic analysis of taste-evoked behavior is an efficient approach to study molecular mechanisms of taste. For example, the genetic mapping studies of sweetener consumption in mice (Phillips et al. 1994; Lush et al. 1995; Bachmanov et al. 1997; Blizard et al. 1999; Bachmanov, Li, Reed, et al. 2001; Li et al. 2001) and bitter taste responses in humans (Reed et al. 1999) and mice (Lush 1991; Capeless et al. 1992; Bachmanov, Li, Li, et al. 2001) facilitated discovery of the T1R and T2R taste receptors (reviewed in Bachmanov and Beauchamp 2007). Genetic analysis of taste responses to salts also has the potential to uncover mechanisms of salty taste reception.
Inbred strains of mice and rats differ in behavioral and neural taste responses to NaCl (reviewed in Boughter and Bachmanov 2007). Several studies have found a wide variation among inbred strains of mice in NaCl intake and preference in long-term (6–96 h) tests (Lush 1991; Beauchamp and Fisher 1993; Bachmanov, Schlager, et al. 1998; Bachmanov, Tordoff, et al. 1998; Kotlus and Blizard 1998; Bachmanov, Beauchamp, et al. 2002; Tordoff et al. 2007). However, NaCl consumption in the long-term tests may be influenced not only by taste but also by postingestive effects of sodium (Rabe and Corbit 1973; Ishiwatari and Bachmanov 2009). The complexity of this phenotype makes it less suitable for understanding the mechanisms of NaCl taste perception. Additionally, the mouse strains differ in amiloride sensitivity of chorda tympani nerve responses to NaCl (Ninomiya et al. 1989, 1996, 1998; Gannon and Contreras 1995; Ohkuri et al. 2006; Shigemura et al. 2008; Cherukuri and McCaughey, unpublished data). However, the invasiveness of electrophysiological experiments makes them difficult to use in genetic studies.
Taste responsiveness to NaCl can also be assessed by measuring taste thresholds. Several different procedures have been developed to measure taste thresholds in nonhuman animals. Electrophysiological recordings of activity in afferent gustatory nerves have been used to determine neural response thresholds defined as the lowest concentration that evokes a signal discernible from a background activity (Pfaffmann and Bare 1950; Beidler 1953; Iwasaki and Sato 1984; Frank and Blizard 1999; Inoue et al. 2001). Behavioral responses of operant conditioned animals have been used to assess detection thresholds defined as the lowest concentration at which a taste solution that can be distinguished from a vehicle (Carr 1952; Koh and Teitelbaum 1961; Slotnick 1982; Geran and Spector 2000; Eylam and Spector 2002, 2003; Ruiz et al. 2006). Because the electrophysiological and operant conditioning approaches are laborious and/or invasive, we developed a high-throughput procedure to assess NaCl taste thresholds, which is suitable for genetic studies (Ishiwatari and Bachmanov 2009). This procedure is based on conditioned taste aversion (CTA) and involves conditioning mice to avoid LiCl and then examining avoidance of NaCl solutions presented in the ascending order of concentrations in 48-h 2-bottle preference tests. The similarity of LiCl and NaCl tastes results in generalization of LiCl aversion to NaCl (Nachman 1963; Baird et al. 2005). The taste thresholds measured using this procedure represent intensity generalization threshold (Tapper and Halpern 1968; Spector and Grill 1988; Clarke et al. 2001) and under optimal conditions may correspond to recognition thresholds (Ishiwatari and Bachmanov 2009). The taste thresholds measured using this technique can detect changes in peripheral taste input (Golden et al. 2011).
In this study, we used this procedure to assess NaCl taste thresholds in 13 inbred strains of mice. These strains were chosen to maximize chances for finding differences in taste sensitivity, based on 3 criteria (Table 1). First, to ensure genetic diversity, we selected strains with unrelated or distant genealogy (Beck et al. 2000). Second, we included strains with different amiloride sensitivity of chorda tympani nerve responses to NaCl (Ninomiya et al. 1989, 1996, 1998; Gannon and Contreras 1995). Third, we included strains that differ in NaCl preferences (Bachmanov, Beauchamp, et al. 2002; Tordoff et al. 2007).
Table 1.
List of inbred strains of mice used in this study and their characteristics
| Strain symbol | Genealogical categorya | 25 mM NaCl preference (%), strain meanb | 75 mM NaCl preference (%), strain meanb | 75 mM NaCl preference (%), strain meanc | Amiloride sensitivityd | NaCl taste threshold (mM), strain mean ± SEMe |
| 129P3/J | Castle's | 67f | 70f | 60 | Noh i | 30 ± 9 |
| A/J | Castle's | 53 | 62 | 56 | Yesj | 30 ± 9 |
| BALB/cByJ | Castle's | 68 | 73 | 69 | Noi k m | 7 ± 2 |
| C3H/HeJ | Castle's | 59 | 46 | 21 | Yesk n | 13 ± 5 |
| C57BL/6ByJ | C57-related | 61g | 62g | 60g | Yesh i j k o | 7 ± 2 |
| C57BL/6J | C57-related | 61 | 62 | 60 | Yesh i j k | 5 ± 2 |
| CBA/J | Castle's | 48 | 43 | 28 | Yesl | 18 ± 6 |
| CE/J | Other | 59 | 70 | 70 | 3 ± 1 | |
| DBA/2J | Castle's | 50 | 56 | 51 | Nok p | 9 ± 6 |
| FVB/NJ | Swiss | 65 | 79 | 75 | 13 ± 6 | |
| NZB/BlNJ | Castle's | 58 | 63 | 63 | Yesl | 5 ± 1 |
| PWK/PhJ | Wild-derived | 57 | 68 | 16 ± 3 | ||
| SJL/J | Swiss | 61 | 67 | 70 | 6 ± 3 |
If different substrains were used in our current study and in a cited study, this is explained in the footnotes. Only 25 and 75 mM NaCl preference scores are shown to illustrate strain variation; preference scores for other concentrations are accessible on the Monell Mouse Taste Phenotyping Project web site (Tordoff and Bachmanov) and the Mouse Phenome Database (http://phenome.jax.org/). SEM, standard error of the mean.
Based on a genealogy chart of inbred strains (Beck et al. 2000).
The preference scores from Tordoff et al. (2007).
The preference scores from Bachmanov, Beauchamp, et al. (2002).
Ability of amiloride to suppress responses to NaCl in the chorda tympani gustatory nerve.
This study.
The data for a related substrain, 129S1/SvImJ.
The data for a related substrain, C57BL/6J.
The data from Gannon and Contreras (1995).
The data from Ninomiya et al. (1996).
The data from (Cherukuri and McCaughey, unpublished data).
The data from Ninomiya et al. (1989).
The data from Ninomiya et al. (1998).
The data for a related substrain, BALB/cCrSlc (Ninomiya et al. 1989; Ninomiya et al. 1996).
The data for a related substrain, C3H/HeSlc (Ninomiya et al. 1989).
The data for related substrains, C57BL/6CrSlc (Ninomiya et al. 1989; Ninomiya et al. 1996), or C57BL/6J (Gannon and Contreras 1995; Cherukuri and McCaughey, unpublished data).
The data for a related substrain, DBA/2CrSlc (Ninomiya et al. 1989).
Because we found significant strain differences in NaCl taste thresholds, we next needed to determine whether this strain variation could be due to factors not related to taste (such as strain differences in sensitivity to toxic effects of LiCl or in learning ability). To accomplish this, we used a similar procedure to measure citric acid taste thresholds in 4 selected inbred strains with large differences in NaCl taste thresholds.
Materials and methods
All protocols involving animals were approved by the Institutional Animal Care and Use Committee at the Monell Center before the experiments.
Subjects
Male mice from 13 inbred strains were used in experiments. Mice from the following 12 inbred strains were purchased from The Jackson Laboratory (Bar Harbor): 129P3/J, A/J, BALB/cByJ, C3H/HeJ, C57BL/6ByJ, C57BL/6J, CBA/J, CE/J, DBA/2J, FVB/NJ, NZB/BlNJ, and SJL/J. Mice from the PWK/PhJ strain were bred at the Monell Chemical Senses Center from progenitors purchased from The Jackson Laboratory. In the NaCl taste threshold experiment, we used mice from all 13 strains. In the citric acid taste threshold experiment, we used separate groups of mice from 4 inbred strains: 129P3/J, A/J, C57BL/6J, and DBA/2J. In both experiments, group sizes were originally 10 mice for each strain but became 5–10 mice due to missing data and elimination of outliers. In total, we used 170 mice divided into 17 groups: 130 mice for NaCl thresholds and 40 mice for citric acid thresholds. All mice were 7–8 weeks old at the start of testing. During acclimation and testing periods, they were housed in individual cages in a temperature-controlled room at 23 °C on a 12:12 h light:dark cycle and had free access to water and the Teklad Rodent Diet 8604 (Harlan Teklad), which includes 0.29% sodium.
Apparatus and taste solutions
Construction of drinking tubes and cage lids has been described previously (Bachmanov, Reed, et al. 2002) and is given in detail on the Monell Mouse Taste Phenotyping Project web site (http://www.monell.org/MMTPP/). Taste solutions were prepared in deionized water. All chemicals were purchased from Sigma-Aldrich Inc.
Procedure
Intake measurements were made every 24 h by reading fluid volume to the nearest 0.1 mL. Prior to conditioning, mice were given deionized water in 2 drinking tubes for at least 5 days for acclimation to experimental settings. Baseline water intakes were measured during the last 2 days of the acclimation period, and body weights (BW) were measured at the end of acclimation period (with one exception: because of an error with initial data collection in CE/J mice, their water intake measurements were made immediately after the NaCl taste threshold test and their BW were measured at the end of water intake measurements).
Taste thresholds for NaCl and citric acid were measured using a procedure optimized in our previous study (Ishiwatari and Bachmanov 2009), which involved 2-bottle preference tests with NaCl or citric acid. In these tests, one tube contained a taste solution and the other tube contained deionized water; each solution concentration was tested for 48 h with positions of the water and solution tubes reversed after 24 h.
Experiment 1: NaCl taste thresholds
One hundred and fifty millimolar LiCl was used as a conditioned stimulus (CS). Mice were exposed to 150 mM LiCl in both tubes as the only source of fluid for 24 h twice (Table 2). The two 24-h 150 mM LiCl exposures were separated by 24 h presentation of deionized water in both tubes After conditioning, mice were presented with both tubes containing deionized water for 48 h and after that with one tube containing a NaCl solution and the other tube containing deionized water. NaCl solutions were tested in the ascending order of concentrations (0, 0.25, 0.5, 1, 2, 4, 8, 16, 32, 64, and 150 mM).
Table 2.
Schedules of NaCl and citric acid taste threshold experiments
| Stage | NaCl threshold | Citric acid threshold | ||
| Day | Solution | Day | Solution | |
| Conditioning | 1 | 150 mM LiCl | 1 | 150 mM LiCl + 10 mM citric acid |
| Recovery | 2 | Water | 2 | Water |
| Conditioning | 3 | 150 mM LiCl | 3 | 150 mM LiCl + 10 mM citric acid |
| Preference testing | 4–26 | 0–150 mM NaCl and water | 4–22 | 0–30 mM Citric acid and water |
Experiment 2: Citric acid taste thresholds
Mice were conditioned and tested using a procedure similar to the NaCl taste threshold test (Table 2), but with different solutions for conditioning and testing. For conditioning, mice were given a solution containing 150 mM LiCl and 10 mM citric acid. After conditioning, mice were tested with a series of citric acid solutions (0, 0.01, 0.03, 0.1, 0.3, 1, 3, 10, and 30 mM) presented in the ascending order of concentrations.
Data analysis
We analyzed daily baseline water intake (2-day averages) and daily CS (150 mM LiCl alone or its mixture with 10 mM citric acid) intake during each of the two 24-h conditioning sessions. The fluid intakes often differ among mouse strains and correlate with their body weights (Bachmanov, Reed, et al. 2002). To account for differences in intake attributed to variation in body size, we expressed baseline water and CS intakes per 30 g of body weight, which is the approximate weight of an adult mouse. We also expressed the dose of the CS as gram LiCl per kg of body weight. Statistical analyses were conducted for the fluid intake values corrected for body weight. Preference scores were calculated as the ratio of the average 2-day solution intake to the average 2-day total fluid (solution + water) intake, in percent.
To ensure that all mice included in analyses of preference scores and taste thresholds were properly conditioned and retained CTA by the end of testing, we analyzed preference scores for test stimuli with taste intensity equivalent to the CS (150 mM NaCl or 10 mM citric acid for the NaCl or citric acid taste threshold tests, respectively) to detect outliers. These analyses were done with pooled groups of mice including all strains used in each experiment (130 mice for NaCl thresholds and 40 mice for citric acid thresholds). Most mice strongly avoided these solutions. Because distributions of preference scores for these solutions significantly deviated from the normal distribution (P < 0.01, Kolmogorov–Smirnov test), the preference scores were logit-transformed, and the mean and standard deviation values were calculated using the transformed values. Mice with the logit-transformed preference scores exceeding the mean plus 3 times of standard deviations were considered as outliers, and their preference scores for the whole concentrations series were excluded from further analysis. Additionally, if the preference score for 150 mM NaCl or 10 mM citric acid was not available due to data loss, preference scores for the whole concentrations series of this mouse were also excluded from analysis (because we reasoned that in this case, we could not assess effectiveness of conditioning and CTA retention). As a result, we excluded the data of 8 of 130 mice (6 outliers with 150 mM NaCl preference scores 15% and higher [3 129P3/J, 1 A/J, 1 BALB/cByJ, and 1 CBA/J] and 2 with data loss for 150 mM NaCl [2 129P3/J]) for the NaCl taste threshold test and the data of 4 of 40 mice (2 outliers with 10 mM citric acid preference scores 22% and higher [1 129P3/J and 1 DBA/2J] and 2 with data loss for 10 mM citric acid [1 A/J and 1 DBA/2J]) for the citric acid taste threshold test. We used body weight, baseline water intake, and CS intake data of all mice, regardless of whether they were outliers for the response to CS or not.
The taste threshold was considered as a stimulus concentration at which a sigmoidal concentration–response regression curve intersects the 25% level of preference scores. To calculate taste thresholds, the NaCl or citric acid preference scores of each mouse for all tested concentrations except 0 mM were fit using the function:
f (x) = 50/(1 + exp(b(log(x)−log(c)))).
Within the function, x is the stimulus concentration, b is the slope, and c is the stimulus concentration at half performance (25% preference score), which was considered the taste threshold concentration (Ishiwatari and Bachmanov 2009). The maximum performance was set to 50% preference score as complete indifference, and minimum performance was set to 0% preference score as complete avoidance. The 25% threshold level was chosen as a midpoint between complete indifference and avoidance, which approximates the 50% level of correct responses often used in psychophysics as a threshold value (Spector 2003; Bufe et al. 2005). Statistical analyses were conducted using taste thresholds of individual mice. For plotting preference score graphs for each strain, we performed regression curve fit analysis using the same function but including the data for all mice from this strain.
Normality of distributions of variables within each strain was analyzed using the Kolmogorov–Smirnov test, and in most cases, no significant deviations from normality were detected (P > 0.05). Strain differences in body weights and taste thresholds were analyzed by one-way analysis of variance (ANOVA). Based on the sums of squares (SS) obtained in the one-way ANOVA, we calculated heritability of NaCl taste thresholds as the ratio
(Belknap 1998; Bachmanov, Reed, et al. 2002). Baseline water intakes (2-day averages) and CS intakes during the first and second exposures were analyzed by two-way repeated measures ANOVA with strain as a between-group factor and stimulus as a within-group factor (with 3 gradations: for water and first and second CS exposures). Preference scores in 2-bottle tests for all concentrations (including 0 mM for water presented in both drinking tubes) were analyzed by two-way repeated measures ANOVA with strain as a between-group factor and concentration as a within-group factor. ANOVAs were followed by Newman–Keuls post hoc tests. A P value < 0.05 was used as the level of statistical significance. All data are presented as mean ± standard errors of the mean.
Results
Experiment 1: NaCl taste thresholds
Water and CS consumption
The baseline water intakes before conditioning and the intakes of 150 mM LiCl during conditioning are shown in Table 3. The fluid intakes expressed per unit of body weight were significantly affected by strain (F 12, 117 = 36.52, P < 0.001), stimulus (F 2, 234 = 5880.6, P < 0.001), and an interaction between strain and stimulus (F 24, 234 = 18.53, P < 0.001). Intakes of 150 mM LiCl solution during each exposure were significantly lower than the baseline water intakes. In most of the strains, the 150 mM LiCl solution intakes were significantly lower during the second exposure than during the first exposure (in the remaining strains, they also tended to be lower). Lower intakes of 150 mM LiCl solutions compared with water and a decrease in LiCl consumption from the first to the second exposure are indicative of a negative postingestive effect following self-administration of LiCl; this demonstrates successful aversive conditioning after the first exposure in all tested strains, as we observed previously with similarly tested outbred mice (Ishiwatari and Bachmanov 2009). The mean doses of LiCl consumed during the first 24-h exposure to CS for each strain were 0.1–0.8 g/kg BW. These doses were comparable to the doses commonly used for conditioning by LiCl injection (e.g., 0.23 g/kg BW in Ishiwatari and Bachmanov 2009).
Table 3.
Body weight, daily baseline water intake, and CS (150 mM LiCl) intake in the NaCl taste threshold experiment (means ± standard error of the mean)
| Strain | Body weight | Baseline water intake | CS intake | ||||||
| First exposure | Second exposure | ||||||||
| (g) | (mL) | (mL/30 g BW) | (mL) | (mL/30 g BW) | (g LiCl/kg BW) | (mL) | (mL/30 g BW) | (g LiCl/kg BW) | |
| 129P3/J | 21.3 ± 0.5b | 4.0 ± 0.1 | 5.7 ± 0.2a | 1.0 ± 0.1 | 1.4 ± 0.1ab# | 0.3 ± 0.03 | 0.4 ± 0.1 | 0.5 ± 0.1a#& | 0.1 ± 0.03 |
| A/J | 21.5 ± 0.5b | 5.2 ± 0.2 | 7.4 ± 0.4c | 1.5 ± 0.1 | 2.1 ± 0.2ab# | 0.4 ± 0.05 | 0.6 ± 0.1 | 0.8 ± 0.1ab#& | 0.2 ± 0.03 |
| BALB/cByJ | 24.3 ± 0.4c | 5.8 ± 0.2 | 7.2 ± 0.2c | 1.2 ± 0.1 | 1.5 ± 0.2ab# | 0.3 ± 0.05 | 0.6 ± 0.1 | 0.8 ± 0.1ab#& | 0.2 ± 0.02 |
| C3H/HeJ | 22.5 ± 0.5bc | 4.8 ± 0.1 | 6.5 ± 0.2b | 0.5 ± 0.05 | 0.7 ± 0.1ab# | 0.1 ± 0.01 | 0.1 ± 0.02 | 0.1 ± 0.02a# | 0.01 ± 0.005 |
| C57BL/6ByJ | 21.3 ± 0.5b | 5.3 ± 0.2 | 7.5 ± 0.2c | 1.3 ± 0.1 | 1.9 ± 0.1ab# | 0.4 ± 0.03 | 0.6 ± 0.1 | 0.9 ± 0.1ab#& | 0.2 ± 0.03 |
| C57BL/6J | 20.7 ± 0.4b | 4.8 ± 0.1 | 7.0 ± 0.2c | 1.6 ± 0.1 | 2.4 ± 0.1b# | 0.5 ± 0.02 | 1.0 ± 0.1 | 1.5 ± 0.1ab#& | 0.3 ± 0.03 |
| CBA/J | 24.4 ± 0.4c | 5.0 ± 0.2 | 6.2 ± 0.2b | 0.9 ± 0.1 | 1.1 ± 0.1ab# | 0.2 ± 0.02 | 0.1 ± 0.03 | 0.1 ± 0.04a#& | 0.03 ± 0.01 |
| CE/J | 26.0 ± 0.5d | 6.5 ± 0.2 | 7.6 ± 0.3c | 0.5 ± 0.04 | 0.6 ± 0.05a# | 0.1 ± 0.01 | 0.1 ± 0.03 | 0.1 ± 0.03a# | 0.02 ± 0.01 |
| DBA/2J | 21.4 ± 0.7b | 5.2 ± 0.3 | 7.3 ± 0.4c | 1.2 ± 0.1 | 1.6 ± 0.2ab# | 0.3 ± 0.04 | 0.2 ± 0.04 | 0.3 ± 0.1a#& | 0.1 ± 0.01 |
| FVB/NJ | 24.0 ± 0.6c | 5.1 ± 0.1 | 6.4 ± 0.1b | 0.9 ± 0.1 | 1.1 ± 0.1ab# | 0.2 ± 0.02 | 0.2 ± 0.1 | 0.3 ± 0.1a#& | 0.1 ± 0.02 |
| NZB/BINJ | 24.3 ± 0.4c | 6.1 ± 0.2 | 7.6 ± 0.2c | 3.0 ± 0.2 | 3.7 ± 0.2c# | 0.8 ± 0.05 | 1.7 ± 0.2 | 2.1 ± 0.2b#& | 0.4 ± 0.05 |
| PWK/PhJ | 14.5 ± 0.3a | 5.2 ± 0.1 | 10.7 ± 0.3d | 1.0 ± 0.1 | 2.0 ± 0.2ab# | 0.4 ± 0.05 | 0.4 ± 0.1 | 0.8 ± 0.1ab#& | 0.2 ± 0.02 |
| SJL/J | 21.5 ± 0.3b | 5.8 ± 0.3 | 8.1 ± 0.3c | 0.9 ± 0.1 | 1.2 ± 0.2ab# | 0.2 ± 0.04 | 0.5 ± 0.04 | 0.6 ± 0.05ab# | 0.1 ± 0.01 |
N = 10 for each strain. Water intakes are 2-day averages. There were significant strain differences for body weights (one-way ANOVA, F 12, 117 = 34.04, P < 0.001). The mean strain NaCl taste thresholds did not significantly correlate with LiCl consumption (CS intakes: r = −0.08 for the first exposure and r = −0.24 for the second exposure; LiCl doses: r = −0.09 for the first exposure and r = −0.22 for the second exposure; P > 0.05; N = 13). The absence of significant correlations indicates that strain differences in NaCl taste thresholds do not depend on variation in amount of consumed LiCl. a,b,c,dGroup means within a column that do not share any common superscripted letters significantly differ (P < 0.05, Newman–Keuls tests), whereas those labeled with at least one letter in common do not. Post hoc analyses of baseline water and LiCl intakes corrected for body weight (P < 0.05, Newman–Keuls tests): #the CS intake is significantly different from the baseline water intake, &the CS intakes during the first and second exposures are significantly different.
NaCl preference scores
The preference scores of conditioned mice from each inbred strain for different concentrations of NaCl are shown in Figure 1. All mice included in analyses strongly avoided 150 mM NaCl: individual preference scores did not exceed 12%. Because 150 mM NaCl was tested at the end of the test series and because it is perceptually similar to the CS, 150 mM LiCl, this demonstrates that all mice included in the analysis retained CTA throughout the test series. The two-way repeated measures ANOVA revealed significant effects of strain (F 12, 109 = 6.13, P < 0.001) and NaCl concentration (F 10, 1090 = 208.95, P < 0.001), as well as significant interaction between effects of strain and NaCl concentration (F 120, 1090 = 1.85, P < 0.001). The strain × concentration interaction indicates that there are strain differences for concentrations at which mice display NaCl avoidance and suggest that the tested inbred strains differ in NaCl taste sensitivity. This was analyzed directly, using taste threshold values (see the next section).
Figure 1.

NaCl preference scores of conditioned mice from 13 inbred strains in 48-h 2-bottle tests (means ± standard error of the mean). N = 10 for all strains, with the exception of A/J, BALB/cByJ, CBA/J (N = 9), and 129P3/J (N = 5). The regression curves were produced using data from all mice of each strain as a group (see details in Materials and methods). Dotted horizontal lines show 25% preference score and indicate taste thresholds as a concentration at which the regression curve intersects this line.
NaCl taste thresholds
The mean NaCl taste threshold for all mice (N = 122) used in this study was 12 ± 1 mM, which is comparable to the NaCl taste threshold of the outbred CD-1 strain (7 ± 3 mM; N = 9) obtained in our previous study (Ishiwatari and Bachmanov 2009) using a similar method. Thresholds were significantly affected by strain (F 12, 109 = 3.26, P < 0.001; one-way ANOVA). The strain means ranged from 3 to 30 mM and were continuously distributed (Figure 2, Table 1). Two strains (A/J and 129P3/J) had significantly higher taste thresholds than 7 other strains (CE/J, NZB/BlNJ, C57BL/6J, SJL/J, C57BL/6ByJ, BALB/cByJ, and DBA/2J). The C3H/HeJ, CBA/J, FVB/NJ, and PWK/PhJ strains had intermediate thresholds and did not differ significantly from the strains with high and low thresholds. The estimate of heritability for NaCl taste thresholds was 0.27.
Figure 2.

NaCl taste thresholds of 13 inbred strains (means ± standard error of the mean). Numbers of mice are the same as in Figure 1. Vertical bars on left side show strains that do not differ significantly from each other in the Newman–Keuls post hoc tests.
Correlation between NaCl taste thresholds and other taste responses to NaCl
We analyzed correlations of the strain means of NaCl taste thresholds determined in this study with published NaCl preference scores of mice without conditioning and with amiloride sensitivity of response to NaCl in the chorda tympani nerve for these or closely related strains (Table 4). The NaCl taste thresholds tended to negatively correlate with amiloride sensitivity and NaCl preferences, but none of the correlations were statistically significant (P > 0.2).
Table 4.
Correlations of NaCl taste thresholds with NaCl preferences and amiloride sensitivity of responses to NaCl in the chorda tympani nerve
| Index | NaCl concentration (mM) | Correlation coefficient (r) |
| NaCl preferencea (N = 12) | 75 | −0.26 |
| 150 | −0.16 | |
| 300 | −0.20 | |
| 450 | −0.38 | |
| NaCl preferenceb (N = 13) | 25 | −0.24 |
| 75 | 0.01 | |
| 225 | −0.10 | |
| Amiloride sensitivityc (N = 9) | −0.13 |
The data from related substrains were used as described in Table 1. Pearson product–moment correlations were calculated using strain means. Amiloride sensitivity was converted to 1 or 0 for presence or absence of the amiloride-sensitive component of chorda tympani responses to NaCl, respectively. Average NaCl taste thresholds were also calculated using strain means for amiloride-sensitive (13 ± 3 mM; N = 6) and amiloride-insensitive (16 ± 7 mM; N = 3) strains; the difference was not significant (P = 0.7; t-test). The numbers of strains used for each analysis are shown in parentheses. None of the correlations was statistically significant (P > 0.2).
The preference scores from Bachmanov, Beauchamp, et al. (2002).
The preference scores from Tordoff et al. (2007).
See Table 1 for the source of data.
Experiment 2. Citric acid taste thresholds
To examine whether the strain differences in NaCl taste thresholds found in Experiment 1 could be due to factors not specifically related to taste, we used a similar procedure to measure citric acid taste thresholds. From the 13 inbred strains tested for NaCl thresholds, we selected 4 strains: 2 with low NaCl thresholds (C57BL/6J and DBA/2J) and 2 with high NaCl thresholds (129P3/J and A/J). These 4 strains had similar acid preferences in 2-bottle tests of naive (nonconditioned) mice (Bachmanov et al. 2000) and were used here to measure citric acid taste threshold. We hypothesized that if the strain differences in NaCl taste thresholds we observed were influenced by learning ability, sensitivity to toxic effects of LiCl, or other nontaste-specific factors, then these same factors would also influence acid taste thresholds, and as a result, we would observe a correlation between NaCl and acid taste thresholds. However, if strain differences in NaCl taste thresholds depend on sodium-specific taste responsiveness, then acid taste thresholds would not correlate with NaCl taste thresholds. In Experiment 2, we used new groups of naive mice (not used previously in Experiment 1).
Water and CS consumption
The baseline water intakes before conditioning and the intakes of the solution containing 150 mM LiCl and 10 mM citric acid during conditioning are shown in Table 5.The results were similar to the results of Experiment 1. The fluid intakes expressed per unit of body weight were significantly affected by strain (F 3, 36 = 14.11, P < 0.001), stimulus (F 2, 72 = 2024.9, P < 0.001), and an interaction between strain and stimulus (F 6, 72 = 6.11, P < 0.001). Intakes of 150 mM LiCl + 10 mM citric acid solution during each exposure were significantly lower than the baseline water intakes. The 150 mM LiCl + 10 mM citric acid solution intakes were significantly lower during the second exposure than during the first exposure only in C57BL/6J mice, although they also tended to be lower in mice from the other 3 strains. The mean doses of LiCl consumed during first 24-h exposure to CS for each strain were 0.2–0.4 g/kg BW.
Table 5.
Body weight, daily baseline water intake, and CS (150 mM LiCl + 10 mM citric acid) intake in the citric acid taste threshold experiment (means ± standard error of the mean)
| Strain | Body weight | Baseline water intake | CS intake | ||||||
| First exposure | Second exposure | ||||||||
| (g) | (mL) | (mL/30 g BW) | (mL) | (mL/30 g BW) | (g LiCl/kg BW) | (mL) | (mL/30 g BW) | (g LiCl/kg BW) | |
| 129P3/J | 21.7 ± 0.4a | 4.5 ± 0.1 | 6.2 ± 0.1a | 0.6 ± 0.1 | 0.8 ± 0.1a# | 0.2 ± 0.01 | 0.4 ± 0.02 | 0.6 ± 0.03a# | 0.1 ± 0.01 |
| A/J | 21.9 ± 0.5a | 4.5 ± 0.2 | 6.2 ± 0.2a | 0.6 ± 0.1 | 0.8 ± 0.1a# | 0.2 ± 0.03 | 0.4 ± 0.04 | 0.6 ± 0.1a# | 0.1 ± 0.01 |
| C57BL/6J | 20.1 ± 0.3a | 5.3 ± 0.2 | 7.9 ± 0.3c | 1.2 ± 0.1 | 1.7 ± 0.2b# | 0.4 ± 0.03 | 0.6 ± 0.1 | 0.9 ± 0.1a#& | 0.2 ± 0.02 |
| DBA/2J | 19.6 ± 0.7a | 4.7± 0.2 | 7.3 ± 0.4b | 0.7 ± 0.1 | 1.0 ± 0.1a# | 0.2 ± 0.03 | 0.3 ± 0.04 | 0.5 ± 0.1a# | 0.1 ± 0.01 |
N = 10 for each strain. Water intakes are 2-day averages. There were significant strain differences for body weights (one-way ANOVA, F 3, 36 = 3.57, P < 0.05), but none of the strains differed in post hoc tests. a,b,cGroup means within a column that do not share any common superscripted letters significantly differ (P < 0.05, Newman–Keuls tests), whereas those labeled with at least one letter in common do not. Post hoc analyses of baseline water and LiCl intakes corrected for body weight (P < 0.05, Newman–Keuls tests): #the CS intake is significantly different from the baseline water intake, &the CS intakes during the 1st and 2nd exposures are significantly different.
Citric acid preference scores
The preference scores of conditioned mice from each strain for different concentrations of citric acid are shown in Figure 3. All mice included in analyses strongly avoided 10 mM citric acid: individual preference scores did not exceed 9%. This demonstrates that all mice included in the analysis retained CTA throughout the test series. The two-way repeated measures ANOVA revealed significant effect of citric acid concentration (F 8, 256 =162.27, P < 0.001), but effect of strain (F 3, 32 = 2.34, P = 0.09) and interaction between effects of strain and citric acid concentration (F 24, 256 = 1.17, P = 0.27) were not significant. These results suggest that these 4 strains do not differ in citric acid taste sensitivity. This was analyzed directly, using taste threshold values (see the next section).
Figure 3.
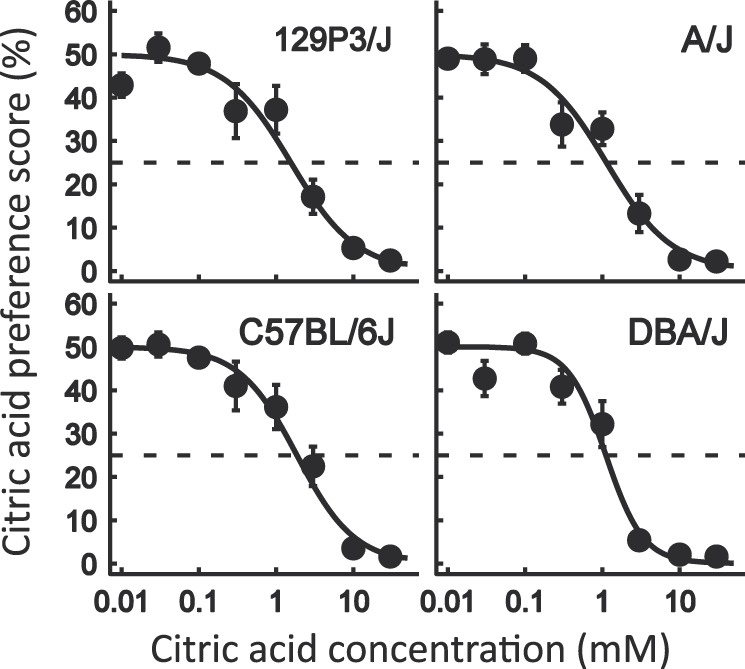
Citric acid preference scores of 4 inbred strains in 48-h 2-bottle tests (means ± standard error of the mean). N = 10 (C57BL/6J), N = 9 (129P3/J and A/J), and N = 8 (DBA/2J). The explanations are the same as in Figure 1.
Citric acid taste thresholds
The mean citric acid taste threshold for all mice (N = 36) used in this study was 2 ± 0.2 mM, which is comparable to the citric acid taste threshold of the outbred CD-1 strain (2 ± 0.4 mM; N = 8) obtained in our previous study (Ishiwatari and Bachmanov 2009) using a similar method. The strain means did not differ significantly among the tested 4 strains (F 3, 32 = 1.59, P = 0.21; effect of strain; one-way ANOVA) and ranged from 1 to 3 mM (Figure 4). Thus, there was no relationship between NaCl thresholds and citric acid thresholds in these 4 strains of mice, indicating that strain differences in NaCl thresholds were due to factors specific for the taste of NaCl. The similarity of the citric acid taste thresholds among these 4 strains is consistent with the results of preference tests with citric acid in naive (nonconditioned) mice from these strains (Bachmanov et al. 2000).
Figure 4.

Citric acid taste thresholds of 4 inbred strains (means ± standard error of the mean). Numbers of mice are the same as in Figure 3. There were no significant differences among strains.
Comparison of citric acid preference scores and taste thresholds in naive and conditioned mice
To demonstrate that citric acid taste thresholds obtained in Experiment 2 reflect recognition thresholds rather than animal's natural unconditioned avoidance of acid, we have compared conditioned 129P3/J, A/J, C57BL/6J, and DBA/2J mice used in this study and naive mice from the same 4 strains from our previous study (Bachmanov et al. 2000). Analysis of preference scores for 0.01, 0.1, 1, 10, and 30 mM (tested in both studies) showed significant (P < 0.05, ANOVA) effects of concentration, treatment (conditioned < naive), and treatment × concentration interaction (conditioned mice had lower preference scores than naive mice at 1 and 10 mM but not at other citric acid concentrations, P < 0.05, post hoc tests). None of the effects involving strain was significant. Citric acid taste thresholds were lower in conditioned mice than in naive mice (2 ± 0.3 and 5 ± 0.5 mM, respectively, P = 0.00004, ANOVA), but they did not differ among strains. These data show that exposure to a mixture of citric acid and LiCl decreases citric acid avoidance thresholds, and therefore, the thresholds of the conditioned mice represent recognition thresholds.
Discussion
In this study, we assessed NaCl taste thresholds of 13 different inbred strains of mice, which were selected to maximize the difference in taste sensitivity. The strain choice was based on 3 criteria: genealogical diversity, NaCl preference, and amiloride sensitivity of chorda tympani nerve response to NaCl (Table 1). Only 2 previous studies reported the inbred strain comparisons of NaCl taste thresholds. One study used neural response threshold measured by electrophysiological recording from mouse chorda tympani nerve (Frank and Blizard 1999). The other study used detection threshold measured with an operant conditioning technique (Eylam and Spector 2003). Both studies compared only 2 strains, C57BL/6J and DBA/2J. Additionally, one study reported the comparisons between wild type (C57BL/6J) mice and TRPV1 knockout mice using an operant conditioning technique (Ruiz et al. 2006). Therefore, our study is the first comprehensive inbred strain survey of NaCl taste thresholds.
We measured the taste thresholds for NaCl and citric acid using a technique developed in our previous study (Ishiwatari and Bachmanov 2009). This technique uses CTA and subsequent 48-h 2-bottle preference tests and measures intensity generalization thresholds, which under optimal conditions reflect recognition thresholds (see details in Ishiwatari and Bachmanov 2009).
We have found large strain variation in NaCl taste thresholds, which ranged from 3 to 30 mM. NaCl taste thresholds we obtained were comparable with those in corresponding strains previously reported by Frank and Blizard (1999) and Ruiz et al. (2006), despite different methods used. In our study, the NaCl taste thresholds of C57BL/6J and DBA/2J mice were 5 ± 2 and 9 ± 6 mM, respectively. In the study of Frank and Blizard (1999), the thresholds of tonic responses to NaCl in the chorda tympani nerve measured in C57BL/6J and DBA/2J mice were 3 mM. In the study of Ruiz et al. (2006), the NaCl detection threshold measured using the operant conditioning technique in C57BL/6J mice was 3 mM. However, another group (Eylam and Spector 2002, 2003), which also used an operant conditioning technique, reported higher NaCl detection threshold in these inbred strains (57–65 mM in C57BL/6J and 98 mM in DBA/2J). (It should be noted that the comparison of taste thresholds obtained in different studies is not always appropriate due to differences in experimental methods and statistical analyses; Spector 2003). Importantly, no significant differences between C57BL/6J and DBA/2J mice were found in all 3 studies that compared NaCl taste thresholds in these strains.
Genealogical relatedness had only a limited predictive value for similarities and differences in NaCl taste thresholds. On one hand, 2 closely related substrains, C57BL/6J and C57BL/6ByJ, had similar NaCl taste thresholds (5 ± 2 and 7 ± 2 mM, respectively). On the other hand, some genealogically related strains were phenotypically divergent (e.g., Castle's strains had thresholds ranging from 5 to 30 mM), and some genealogically distant strains were phenotypically similar (e.g., C57BL/6ByJ, SJL/J and BALB/cByJ). This pattern of strain differences suggests that variation in NaCl taste sensitivity depends on the contribution of multiple genetic loci, which were fixed at different times during generation of inbred strains.
There were no significant correlations between the NaCl taste thresholds observed in this study and the previously reported NaCl preferences or the amiloride sensitivity of the chorda tympani nerve responses to NaCl in the same strains, although the correlations were mostly negative (Table 4). The lack of strong correlations between NaCl taste thresholds and NaCl preferences in nonconditioned mice is probably explained by different mechanisms contributing to variation in each phenotype. NaCl preferences in the long-term tests may be influenced not only by taste perception but also by postingestive effects of sodium (Rabe and Corbit 1973; Ishiwatari and Bachmanov 2009). On the contrary, NaCl taste thresholds are not influenced by postingestive mechanisms and more directly reflect variation in NaCl taste perception. Most likely, strain differences in behavioral NaCl taste thresholds reflect genetic variation in perceived intensity of salt taste. Although NaCl and LiCl have similar perceived taste quality (discussed in Ishiwatari and Bachmanov 2009), we cannot exclude a possibility that mouse strains differ in how qualitatively similar NaCl and LiCl taste to them. If such differences exist, they could influence NaCl taste thresholds measured in our study. Regardless of whether strain differences in the behavioral NaCl taste thresholds depend on variation in perceived taste intensity or taste quality, these differences provide a foundation for genetic analyses of salt taste. Chorda tympani transection dramatically increased NaCl taste thresholds measured using our technique (Golden et al. 2011), which demonstrates that it can detect changes in taste mechanisms that occur in the oral cavity. Therefore, this method should be able to detect changes not only due to nerve transection but also due to allelic variants of genes expressed in taste bud cells.
Mouse strains differ in memory, learning ability, and other behaviors (e.g., Crawley et al. 1997; Bothe et al. 2005) and also in sensitivity to toxic effects of LiCl (e.g., Smith 1978; El-Kassem and Singh 1983; Risinger and Cunningham 2000). All these nontaste-related factors potentially may affect mouse performance in the LiCl conditioning-based taste threshold measurement tests. However, it is unlikely that such nontaste-related factors have contributed to the strain differences in NaCl taste thresholds found in this study. If the strain differences in NaCl taste thresholds were attributed to nontaste-specific factors, then equivalent differences would be observed for taste thresholds for other tastants estimated using the same technique. Our experiment with citric acid taste thresholds demonstrates that this is not the case. Four strains used in this experiment had large differences in the NaCl taste thresholds (3–30 mM) but did not differ in taste thresholds for citric acid (1–3 mM). Therefore, mice from all these 4 strains are capable of performing in the LiCl-induced CTA tests to a similar degree. Furthermore, mice from all 13 strains tested significantly reduced their CS intake during the first 24 h of conditioning compared with water intake in the preceding tests, which indicates that mice from all strains developed similarly robust CTA. This illustrates the ability of the oral LiCl self-administration procedure to form CTA regardless of any possible strain differences in sensitivity to toxic effects of LiCl. When animals have access to a LiCl solution, they drink LiCl until they experience symptoms of intoxication strong enough to act as the unconditioned stimulus (US). Thus, depending on individual sensitivity to toxic effects of LiCl, each animal controls the US strength by self-administering a LiCl dose sufficient to develop CTA (Ishiwatari and Bachmanov 2009). All these data suggest that the strain differences in NaCl taste thresholds are due to factors specific for the taste of NaCl.
The central goal of this study was to find strains with contrasting NaCl taste thresholds that could be used for genetic analysis of NaCl taste sensitivity. We have found that several strains are suitable for such analyses. The 129P3/J and A/J strains have high NaCl taste thresholds, whereas the BALB/cByJ, C57BL/6ByJ, C57BL/6J, CE/J, DBA/2J, NZB/BINJ, and SJL/J strains have low NaCl taste thresholds. Any pair of strains with contrasting NaCl taste thresholds could be used as progenitors for genetic experiments, such as linkage analysis (genetic mapping). These strains could be intercrossed to produce segregating hybrid generations (e.g., Bachmanov et al. 1996, 1997; Inoue et al. 2004). Some of these strains are progenitors of recombinant inbred (Taylor 1981) or consomic (chromosomal substitution) (Nadeau et al. 2000) strains. For example, sets of recombinant inbred strains (Taylor 1981) and a set of consomic strains (Singer et al. 2004) that originate from the NaCl-sensitive C57BL/6J and NaCl-insensitive A/J strains are available from The Jackson Laboratory (http://jaxmice.jax.org). NaCl-sensitive C57BL/6J and NaCl-insensitive 129 strains are progenitors of a set or recombinant inbred strains (Taylor 1981) and sets of consomic strains that are under development (Reed et al. 2008; Lin et al. 2011).These segregating crosses, recombinant inbred, and consomic strains will allow us to map and then to identify genes responsible for the strain differences in the NaCl taste thresholds. These studies will help us to understand the mechanisms of NaCl taste.
Funding
This work was supported by Ajinomoto Co., Inc., Firmenich SA, Givaudan SA, and International Flavors and Fragrances Inc. (Y.I. and A.A.B.), and by the National Institutes of Health grant [DC00882 to A.A.B.].
Acknowledgments
The authors thank Drs Gary K. Beauchamp and Stuart A. McCaughey for helpful discussions and comments on the manuscript. We also thank Drs Joseph G. Brand, Paul Breslin, Carol Christensen, Liquan Huang, and John Teeter for helpful discussions, Dr Michael G. Tordoff for providing PWK/PhJ strain of mice, and Kyoko Ishiwatari, Darryl Powel, Mauricio Avigdor, Zakiyyah Smith, and Maria Theodorides for their highly skilled technical assistance. A portion of this work was presented at the Association for Chemoreception Sciences Annual Meeting in Sarasota, Florida in April 2007 (Ishiwatari and Bachmanov 2007). Raw data from this study have been deposited to the Mouse Phenome Database (URL: http://phenome.jax.org/).
References
- Bachmanov AA, Beauchamp GK. Taste receptor genes. Annu Rev Nutr. 2007;27:389–414. doi: 10.1146/annurev.nutr.26.061505.111329. [DOI] [PMC free article] [PubMed] [Google Scholar]
- Bachmanov AA, Beauchamp GK, Tordoff MG. Voluntary consumption of NaCl, KCl, CaCl2, and NH4Cl solutions by 28 mouse strains. Behav Genet. 2002;32:445–457. doi: 10.1023/a:1020832327983. [DOI] [PMC free article] [PubMed] [Google Scholar]
- Bachmanov AA, Li X, Li S, Neira M, Beauchamp GK, Azen EA. High-resolution genetic mapping of the sucrose octaacetate taste aversion (Soa) locus on mouse Chromosome 6. Mamm Genome. 2001;12:695–699. doi: 10.1007/s00335-001-2061-7. [DOI] [PMC free article] [PubMed] [Google Scholar]
- Bachmanov AA, Li X, Reed DR, Ohmen JD, Li S, Chen Z, Tordoff MG, de Jong PJ, Wu C, West DB, et al. Positional cloning of the mouse saccharin preference (Sac) locus. Chem Senses. 2001;26:925–933. doi: 10.1093/chemse/26.7.925. [DOI] [PMC free article] [PubMed] [Google Scholar]
- Bachmanov AA, Reed DR, Beauchamp GK, Tordoff MG. Food intake, water intake, and drinking spout side preference of 28 mouse strains. Behav Genet. 2002;32:435–443. doi: 10.1023/a:1020884312053. [DOI] [PMC free article] [PubMed] [Google Scholar]
- Bachmanov AA, Reed DR, Ninomiya Y, Inoue M, Tordoff MG, Price RA, Beauchamp GK. Sucrose consumption in mice: major influence of two genetic loci affecting peripheral sensory responses. Mamm Genome. 1997;8:545–548. doi: 10.1007/s003359900500. [DOI] [PMC free article] [PubMed] [Google Scholar]
- Bachmanov AA, Reed DR, Tordoff MG, Price RA, Beauchamp GK. Intake of ethanol, sodium chloride, sucrose, citric acid, and quinine hydrochloride solutions by mice: a genetic analysis. Behav Genet. 1996;26:563–573. doi: 10.1007/BF02361229. [DOI] [PMC free article] [PubMed] [Google Scholar]
- Bachmanov AA, Schlager G, Tordoff MG, Beauchamp GK. Consumption of electrolytes and quinine by mouse strains with different blood pressures. Physiol Behav. 1998;64:323–330. doi: 10.1016/s0031-9384(98)00069-9. [DOI] [PMC free article] [PubMed] [Google Scholar]
- Bachmanov AA, Tordoff MG, Beauchamp GK. Voluntary sodium chloride consumption by mice: differences among five inbred strains. Behav Genet. 1998;28:117–124. doi: 10.1023/a:1021471924143. [DOI] [PMC free article] [PubMed] [Google Scholar]
- Bachmanov AA, Tordoff MG, Beauchamp GK. Acid acceptance in 28 mouse strains [Abstract] Chem Senses. 2000;25:600. [Google Scholar]
- Baird JP, St John SJ, Nguyen EA. Temporal and qualitative dynamics of conditioned taste aversion processing: combined generalization testing and licking microstructure analysis. Behav Neurosci. 2005;119:983–1003. doi: 10.1037/0735-7044.119.4.983. [DOI] [PubMed] [Google Scholar]
- Beauchamp GK, Fisher AS. Strain differences in consumption of saline solutions by mice. Physiol Behav. 1993;54:179–184. doi: 10.1016/0031-9384(93)90063-l. [DOI] [PubMed] [Google Scholar]
- Beck JA, Lloyd S, Hafezparast M, Lennon-Pierce M, Eppig JT, Festing MF, Fisher EM. Genealogies of mouse inbred strains. Nat Genet. 2000;24:23–25. doi: 10.1038/71641. [DOI] [PubMed] [Google Scholar]
- Beidler LM. Properties of chemoreceptors of tongue of rat. J Neurophysiol. 1953;16:595–607. doi: 10.1152/jn.1953.16.6.595. [DOI] [PubMed] [Google Scholar]
- Belknap JK. Effect of within-strain sample size on QTL detection and mapping using recombinant inbred mouse strains. Behav Genet. 1998;28:29–38. doi: 10.1023/a:1021404714631. [DOI] [PubMed] [Google Scholar]
- Blizard DA, Kotlus B, Frank ME. Quantitative trait loci associated with short-term intake of sucrose, saccharin and quinine solutions in laboratory mice. Chem Senses. 1999;24:373–385. doi: 10.1093/chemse/24.4.373. [DOI] [PubMed] [Google Scholar]
- Bosak N, Inoue M, Nelson T, Hummler E, Ishiwatari Y, Bachmanov A. Epithelial sodium channel (ENaC) is involved in reception of sodium taste: evidence from mice with a tissue-specific conditional targeted mutation of the ENaCα gene [Abstract] Chem Senses. 2010;35 doi:10.1093/chemse/bjq1071. [Google Scholar]
- Bothe GW, Bolivar VJ, Vedder MJ, Geistfeld JG. Behavioral differences among fourteen inbred mouse strains commonly used as disease models. Comp Med. 2005;55:326–334. [PubMed] [Google Scholar]
- Boughter JD, Jr, Bachmanov AA. Behavioral genetics and taste. BMC Neurosci. 2007;8(Suppl 3):S3. doi: 10.1186/1471-2202-8-S3-S3. [DOI] [PMC free article] [PubMed] [Google Scholar]
- Bufe B, Breslin PA, Kuhn C, Reed DR, Tharp CD, Slack JP, Kim UK, Drayna D, Meyerhof W. The molecular basis of individual differences in phenylthiocarbamide and propylthiouracil bitterness perception. Curr Biol. 2005;15:322–327. doi: 10.1016/j.cub.2005.01.047. [DOI] [PMC free article] [PubMed] [Google Scholar]
- Capeless CG, Whitney G, Azen EA. Chromosome mapping of Soa, a gene influencing gustatory sensitivity to sucrose octaacetate in mice. Behav Genet. 1992;22:655–663. doi: 10.1007/BF01066636. [DOI] [PubMed] [Google Scholar]
- Carr WJ. The effect of adrenalectomy upon the NaCl taste threshold in rat. J Comp Physiol Psychol. 1952;45:377–380. doi: 10.1037/h0056378. [DOI] [PubMed] [Google Scholar]
- Chandrashekar J, Hoon MA, Ryba NJ, Zuker CS. The receptors and cells for mammalian taste. Nature. 2006;444:288–294. doi: 10.1038/nature05401. [DOI] [PubMed] [Google Scholar]
- Chandrashekar J, Kuhn C, Oka Y, Yarmolinsky DA, Hummler E, Ryba NJ, Zuker CS. The cells and peripheral representation of sodium taste in mice. Nature. 2010;464:297–301. doi: 10.1038/nature08783. [DOI] [PMC free article] [PubMed] [Google Scholar]
- Clarke SN, Koh MT, Bernstein IL. NaCl detection thresholds: comparison of Fischer 344 and Wistar rats. Chem Senses. 2001;26:253–257. doi: 10.1093/chemse/26.3.253. [DOI] [PubMed] [Google Scholar]
- Crawley JN, Belknap JK, Collins A, Crabbe JC, Frankel W, Henderson N, Hitzemann RJ, Maxson SC, Miner LL, Silva AJ, et al. Behavioral phenotypes of inbred mouse strains: implications and recommendations for molecular studies. Psychopharmacology (Berl) 1997;132:107–124. doi: 10.1007/s002130050327. [DOI] [PubMed] [Google Scholar]
- El-Kassem M, Singh SM. Genetic basis for lithium toxicity and its relationship with tissue distribution: a diallel cross analysis of six strains of mice. Can J Genet Cytol. 1983;25:122–128. doi: 10.1139/g83-024. [DOI] [PubMed] [Google Scholar]
- Eylam S, Spector AC. The effect of amiloride on operantly conditioned performance in an NaCl taste detection task and NaCl preference in C57BL/6J mice. Behav Neurosci. 2002;116:149–159. [PubMed] [Google Scholar]
- Eylam S, Spector AC. Oral amiloride treatment decreases taste sensitivity to sodium salts in C57BL/6J and DBA/2J mice. Chem Senses. 2003;28:447–458. doi: 10.1093/chemse/28.5.447. [DOI] [PubMed] [Google Scholar]
- Frank ME, Blizard DA. Chorda tympani responses in two inbred strains of mice with different taste preferences. Physiol Behav. 1999;67:287–297. doi: 10.1016/s0031-9384(99)00071-2. [DOI] [PubMed] [Google Scholar]
- Gannon K, Contreras RJ. Sodium intake linked to amiloride-sensitive gustatory transduction in C57BL/6J and 129/J mice. Physiol Behav. 1995;57:231–239. doi: 10.1016/0031-9384(94)00279-e. [DOI] [PubMed] [Google Scholar]
- Geran LC, Spector AC. Amiloride increases sodium chloride taste detection threshold in rats. Behav Neurosci. 2000;114:623–634. doi: 10.1037/0735-7044.114.3.623. [DOI] [PubMed] [Google Scholar]
- Golden GJ, Ishiwatari Y, Theodorides ML, Bachmanov AA. Effect of chorda tympani nerve transection on salt taste perception in mice. Chem Senses. 2011;36:811–819. doi: 10.1093/chemse/bjr056. [DOI] [PMC free article] [PubMed] [Google Scholar]
- Halpern BP. Amiloride and vertebrate gustatory responses to NaCl. Neurosci Biobehav Rev. 1998;23:5–47. doi: 10.1016/s0149-7634(97)00063-8. [DOI] [PubMed] [Google Scholar]
- Inoue M, McCaughey SA, Bachmanov AA, Beauchamp GK. Whole nerve chorda tympani responses to sweeteners in C57BL/6ByJ and 129P3/J mice. Chem Senses. 2001;26:915–923. doi: 10.1093/chemse/26.7.915. [DOI] [PMC free article] [PubMed] [Google Scholar]
- Inoue M, Reed DR, Li X, Tordoff MG, Beauchamp GK, Bachmanov AA. Allelic variation of the Tas1r3 taste receptor gene selectively affects behavioral and neural taste responses to sweeteners in the F2 hybrids between C57BL/6ByJ and 129P3/J mice. J Neurosci. 2004;24:2296–2303. doi: 10.1523/JNEUROSCI.4439-03.2004. [DOI] [PMC free article] [PubMed] [Google Scholar]
- Ishiwatari Y, Bachmanov AA. Chem Senses. 32:A26. 2007. NaCl taste thresholds in 13 inbred mouse strains [Abstract] [DOI] [PMC free article] [PubMed] [Google Scholar]
- Ishiwatari Y, Bachmanov AA. A high-throughput method to measure NaCl and acid taste thresholds in mice. Chem Senses. 2009;34:277–293. doi: 10.1093/chemse/bjp001. [DOI] [PMC free article] [PubMed] [Google Scholar]
- Iwasaki K, Sato M. Neural and behavioral responses to taste stimuli in the mouse. Physiol Behav. 1984;32:803–807. doi: 10.1016/0031-9384(84)90198-7. [DOI] [PubMed] [Google Scholar]
- Koh SD, Teitelbaum P. Absolute behavioral taste thresholds in the rat. J Comp Physiol Psychol. 1961;54:223–229. doi: 10.1037/h0048474. [DOI] [PubMed] [Google Scholar]
- Kotlus BS, Blizard DA. Measuring gustatory variation in mice: a short-term fluid-intake test. Physiol Behav. 1998;64:37–47. doi: 10.1016/s0031-9384(98)00016-x. [DOI] [PubMed] [Google Scholar]
- Li X, Inoue M, Reed DR, Huque T, Puchalski RB, Tordoff MG, Ninomiya Y, Beauchamp GK, Bachmanov AA. High-resolution genetic mapping of the saccharin preference locus (Sac) and the putative sweet taste receptor (T1R1) gene (Gpr70) to mouse distal Chromosome 4. Mamm Genome. 2001;12:13–16. doi: 10.1007/s003350010236. [DOI] [PMC free article] [PubMed] [Google Scholar]
- Lin C, Bosak NP, Nelson TM, Theodorides ML, Smith ZH, Kirkey M, Avigdor M, Gantick B, Khoshnevisan A, Lysenko A, et al. Mouse Genetics Conference; 2011 Jun 21–25; Washington, DC. Washington (DC): Genetics Society of America. 52 p. 2011. Construction of reciprocal chromosome substitution strains from 129P3/J and C57BL/6ByJ mice [Abstract] [Google Scholar]
- Lindemann B. Receptors and transduction in taste. Nature. 2001;413:219–225. doi: 10.1038/35093032. [DOI] [PubMed] [Google Scholar]
- Lush IE. The genetics of bitterness, sweetness, and saltiness in strains of mice. In: Wysocki CJ, Kare MR, editors. Genetics of perception and communication. New York: Marcel Dekker; 1991. pp. 227–241. [Google Scholar]
- Lush IE, Hornigold N, King P, Stoye JP. The genetics of tasting in mice. VII. Glycine revisited, and the chromosomal location of Sac and Soa. Genet Res. 1995;66:167–174. doi: 10.1017/s0016672300034510. [DOI] [PubMed] [Google Scholar]
- Lyall V, Heck GL, Vinnikova AK, Ghosh S, Phan TH, Alam RI, Russell OF, Malik SA, Bigbee JW, DeSimone JA. The mammalian amiloride-insensitive non-specific salt taste receptor is a vanilloid receptor-1 variant. J Physiol. 2004;558:147–159. doi: 10.1113/jphysiol.2004.065656. [DOI] [PMC free article] [PubMed] [Google Scholar]
- McCaughey SA, Scott TR. The taste of sodium. Neurosci Biobehav Rev. 1998;22:663–676. doi: 10.1016/s0149-7634(97)00067-5. [DOI] [PubMed] [Google Scholar]
- Nachman M. Learned aversion to the taste of lithium chloride and generalization to other salts. J Comp Physiol Psychol. 1963;56:343–349. doi: 10.1037/h0046484. [DOI] [PubMed] [Google Scholar]
- Nadeau JH, Singer JB, Matin A, Lander ES. Analysing complex genetic traits with chromosome substitution strains. Nat Genet. 2000;24:221–225. doi: 10.1038/73427. [DOI] [PubMed] [Google Scholar]
- Ninomiya Y, Bachmanov AA, Yatabe A, Beauchamp GK. NaCl-preferring NZB/BlNJ mice and NaCl-avoiding CBA/J mice have similar amiloride inhibition of chorda tympani responses to NaCl. Chem Senses. 1998;23:411–415. doi: 10.1093/chemse/23.4.411. [DOI] [PMC free article] [PubMed] [Google Scholar]
- Ninomiya Y, Fukami Y, Yamazaki K, Beauchamp GK. Amiloride inhibition of chorda tympani responses to NaCl and its temperature dependency in mice. Brain Res. 1996;708:153–158. doi: 10.1016/0006-8993(95)01218-4. [DOI] [PubMed] [Google Scholar]
- Ninomiya Y, Sako N, Funakoshi M. Strain differences in amiloride inhibition of NaCl responses in mice, Mus musculus. J Comp Physiol [A] 1989;166:1–5. doi: 10.1007/BF00190204. [DOI] [PubMed] [Google Scholar]
- Ohkuri T, Yasumatsu K, Shigemura N, Yoshida R, Ninomiya Y. Amiloride inhibition on NaCl responses of the chorda tympani nerve in two 129 substrains of mice, 129P3/J and 129X1/SvJ. Chem Senses. 2006;31:565–572. doi: 10.1093/chemse/bjj061. [DOI] [PubMed] [Google Scholar]
- Pfaffmann C, Bare JK. Gustatory nerve discharges in normal and adrenalectomized rats. J Comp Physiol Psychol. 1950;43:320–324. doi: 10.1037/h0059248. [DOI] [PubMed] [Google Scholar]
- Phillips TJ, Crabbe JC, Metten P, Belknap JK. Localization of genes affecting alcohol drinking in mice. Alcohol Clin Exp Res. 1994;18:931–941. doi: 10.1111/j.1530-0277.1994.tb00062.x. [DOI] [PubMed] [Google Scholar]
- Rabe EF, Corbit JD. Postingestional control of sodium chloride solution drinking in the rat. J Comp Physiol Psychol. 1973;84:268–274. doi: 10.1037/h0035277. [DOI] [PubMed] [Google Scholar]
- Reed DR, McDaniel AH, Avigdor M, Bachmanov AA. QTL for body composition on chromosome 7 detected using a chromosome substitution mouse strain. Obesity (Silver Spring) 2008;16:483–487. doi: 10.1038/oby.2007.26. [DOI] [PMC free article] [PubMed] [Google Scholar]
- Reed DR, Nanthakumar E, North M, Bell C, Bartoshuk LM, Price RA. Localization of a gene for bitter-taste perception to human chromosome 5p15. Am J Hum Genet. 1999;64:1478–1480. doi: 10.1086/302367. [DOI] [PMC free article] [PubMed] [Google Scholar]
- Risinger FO, Cunningham CL. DBA/2J mice develop stronger lithium chloride-induced conditioned taste and place aversions than C57BL/6J mice. Pharmacol Biochem Behav. 2000;67:17–24. doi: 10.1016/s0091-3057(00)00310-5. [DOI] [PubMed] [Google Scholar]
- Ruiz C, Gutknecht S, Delay E, Kinnamon S. Detection of NaCl and KCl in TRPV1 knockout mice. Chem Senses. 2006;31:813–820. doi: 10.1093/chemse/bjl024. [DOI] [PubMed] [Google Scholar]
- Shigemura N, Ohkuri T, Sadamitsu C, Yasumatsu K, Yoshida R, Beauchamp GK, Bachmanov AA, Ninomiya Y. Amiloride-sensitive NaCl taste responses are associated with genetic variation of ENaC alpha-subunit in mice. Am J Physiol Regul Integr Comp Physiol. 2008;294:R66–R75. doi: 10.1152/ajpregu.00420.2007. [DOI] [PMC free article] [PubMed] [Google Scholar]
- Singer JB, Hill AE, Burrage LC, Olszens KR, Song J, Justice M, O'Brien WE, Conti DV, Witte JS, Lander ES, et al. Genetic dissection of complex traits with chromosome substitution strains of mice. Science. 2004;304:445–448. doi: 10.1126/science.1093139. [DOI] [PubMed] [Google Scholar]
- Slotnick BM. Sodium chloride detection threshold in the rat determined using a simple operant taste discrimination task. Physiol Behav. 1982;28:707–710. doi: 10.1016/0031-9384(82)90055-5. [DOI] [PubMed] [Google Scholar]
- Smith DF. Lithium chloride toxicity and pharmacodynamics in inbred mice. Acta Pharmacol Toxicol (Copenh) 1978;43:51–54. doi: 10.1111/j.1600-0773.1978.tb02231.x. [DOI] [PubMed] [Google Scholar]
- Spector AC. Psychophysical evaluation of taste function in nonhuman mammals. In: Doty RL, editor. Handbook of olfaction and gustation. New York: Marcel Dekker, Inc; 2003. pp. 861–879. [Google Scholar]
- Spector AC, Grill HJ. Differences in the taste quality of maltose and sucrose in rats: issues involving the generalization of conditioned taste aversions. Chem Senses. 1988;13:95–113. [Google Scholar]
- Tapper DN, Halpern BP. Taste stimuli: a behavioral categorization. Science. 1968;161:708–710. doi: 10.1126/science.161.3842.708. [DOI] [PubMed] [Google Scholar]
- Taylor BA. Recombinant Inbred Strains. In: Green MC, editor. Genetic variants and strains of the laboratory mouse. New York: Gustav Fisher Verlag; 1981. pp. 397–407. [Google Scholar]
- Tordoff MG, Bachmanov AA. Monell Mouse Taste Phenotyping Project [Internet] Philadelphia (PA): Monell Chemical Senses Center.; 2011. Available from: http://www.monell.org/MMTPP/ [Google Scholar]
- Tordoff MG, Bachmanov AA, Reed DR. Forty mouse strain survey of water and sodium intake. Physiol Behav. 2007;91:620–631. doi: 10.1016/j.physbeh.2007.03.025. [DOI] [PMC free article] [PubMed] [Google Scholar]
- Treesukosol Y, Lyall V, Heck GL, DeSimone JA, Spector AC. A psychophysical and electrophysiological analysis of salt taste in Trpv1 null mice. Am J Physiol Regul Integr Comp Physiol. 2007;292:R1799–R1809. doi: 10.1152/ajpregu.00587.2006. [DOI] [PubMed] [Google Scholar]