SUMMARY
The ability of the insect cercal system to detect approaching predators has been studied extensively in the laboratory and in the field. Some previous studies have assessed the extent to which sensory noise affects the operational characteristics of the cercal system, but these studies have only been carried out in laboratory settings using white noise stimuli of unrealistic nature. Using a piston mimicking the natural airflow of an approaching predator, we recorded the neural activity through the abdominal connectives from the terminal abdominal ganglion of freely moving wood crickets (Nemobius sylvestris) in a semi-field situation. A cluster analysis of spike amplitudes revealed six clusters, or ‘units’, corresponding to six different subsets of cercal interneurons. No spontaneous activity was recorded for the units of larger amplitude, reinforcing the idea they correspond to the largest giant interneurons. Many of the cercal units are already activated by background noise, sometimes only weakly, and the approach of a predator is signaled by an increase in their activity, in particular for the larger-amplitude units. A scaling law predicts that the cumulative number of spikes is a function of the velocity of the flow perceived at the rear of the cricket, including a multiplicative factor that increases linearly with piston velocity. We discuss the implications of this finding in terms of how the cricket might infer the imminence and nature of a predatory attack.
KEY WORDS: semi-field experiment, escape behavior, giant interneuron, terminal abdominal ganglion, TAG, electrophysiology, Nemobius sylvestris
INTRODUCTION
Background noise is always present in natural environments, and this noise is usually viewed as detrimental to signal detection. Many sources of air movement are present in the natural environment of crickets. Atmospheric air current, singing by males, displacements of other crickets and insects, as well as self-movement (including the movements of the cerci themselves) all produce airflows that are most likely sensed by the animal (Edwards and Palka, 1974; Kämper and Dambach, 1981). All these air currents can furthermore be modulated by the structural properties of the environment. Despite the presence of this very complex and variable background noise, behavioral studies have shown that crickets are able to detect and recognize extremely weak air movements generated by an attacking predator (Dangles et al., 2007). Crickets perceive air movements using hundreds of filiform mechanosensory hairs located on the cerci. Axons from these mechanosensory receptors project into the terminal abdominal ganglion (TAG) and connect to local and projecting interneurons. The projecting interneurons leave the TAG via the pair of abdominal connectives and connect to neurons in higher centers, which mediate escape and other behaviors (Edwards and Palka, 1974; Camhi, 1984; Ritzmann, 1984; Insausti et al., 2011). The axons of some projecting cercal interneurons are very large relative to other projecting axons in the abdominal connectives, allowing a quick transmission of the information and thus a quick escape response. The ability of the cercal system to detect approaching predators under noisy conditions has not been studied extensively at the neuronal level, and the few studies that have been published were based on measurements obtained exclusively in the laboratory using white noise stimuli (Plummer and Camhi, 1981; Levin and Miller, 1996; Clague et al., 1997). However, as shown recently in another electrophysiological study, the responses of the cercal interneurons to white-noise stimuli, which were used in many previous studies, are qualitatively and quantitatively different than responses elicited by air currents crafted to resemble those generated by natural predators (Mulder-Rosi et al., 2010). Hence, interpretation of those earlier studies on the effects of noise on interneuron responsiveness and on the response to predator attack may be problematic, and a neuroethologically relevant study of the perception of an approaching predator would require the use of realistic stimuli. Furthermore, experiments conducted in the field under more naturalistic noise conditions could shed light on the true operation of the cercal system.
Over the last few years, the wood cricket Nemobius sylvestris (Bosc 1792) has been the subject of studies focusing on its ecology (Dangles et al., 2006a), its escape behavior (Dupuy et al., 2011), the neuroanatomy of the cercal sensory system (Insausti et al., 2008; Insausti et al., 2011), the anatomy of cerci (Dangles et al., 2005), mathematical modeling of the movement of mechanoreceptive hairs (Magal et al., 2006) and air movements around hairs on cerci (Steinmann et al., 2006). Nemobius sylvestris crickets live in the litter of forests, an easily accessible environment for field experiments. The main predator of this cricket species in the region where these studies were carried out is the wolf spider Pardosa sp. (Dangles et al., 2006a). The aerodynamics of the running spider have been described (Casas et al., 2008) and can be reproduced using a mechanical device (Dangles et al., 2006b). The specific aim of the present study was to study the responsiveness of cricket cercal interneurons to naturalistic stimuli in the presence of ambient environmental noise. We analysed the spiking activity elicited in response to object movements in the field, measured electrophysiologically in the connectives from the TAG to higher centres.
MATERIALS AND METHODS
Insects
Juveniles of N. sylvestris belonging to instars 7 to 9 [posterior femur size superior to 3.85 mm (Campan, 1965)] were used. Crickets were captured in the forest in the surroundings of the city of Tours (47°23′N, 0°41′E), France, during the summer of 2007 and maintained in plastic boxes (53×30×35 cm) at room temperature (between 17 and 25°C) under natural light:dark cycles. Water and food (dry cat food) were provided ad libitum, supplemented from time to time with fresh fruits. Only crickets with intact cerci were used.
Insect preparation
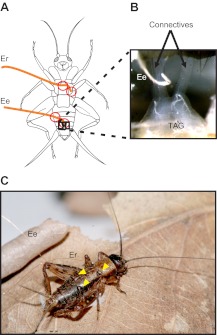
A cricket was placed under a CO2-loaded atmosphere for 30 s. To allow insertion of fine wire electrodes, the cricket was then fixed on a glass strip, ventral side up (Fig. 1), using a low-melting-temperature dental wax. Only the leg tips and a small area of the abdomen were fixed, to allow subsequent release of the cricket without injuries after the placement of electrodes. The cuticle was opened at the level of the seventh sternite. The fatty tissue was removed to expose the connectives between the fourth and fifth (terminal) abdominal ganglia. Silver wire electrodes (25 μm diameter), insulated except at the endings, were used to record spikes through one of the two paired connectives. One end of the recording electrode was bent to form a hook and placed around one connective, using a micromanipulator (Ee in Fig. 1A,B). The access window in the cuticle was then covered with a piece of Parafilm® fixed with dental wax. The wax was also used to fix the electrode to the Parafilm® and the cuticle at its point of entry into the abdomen (Fig. 1A, red circles). The reference electrode (Er in Fig. 1A) was introduced in a small aperture made in the thorax between middle and hind legs. A drop of dental wax was used to fix the electrode at its point of entry into the body and to close the aperture (Fig. 1A, red circles). A second point of fixation was done for both wires on the ventral side of the abdomen some millimeters away from the first points of fixation (Fig. 1A, red circles). The electrodes were then fixed to the dorsal side of the abdomen by one or two drops of wax on the first segment of the abdomen for the reference electrode and in the middle of the abdomen for the recording electrode (Fig. 1C, yellow arrowheads).
Fig. 1.
Insect preparation. (A) Two electrodes are placed in the insect body, one to serve as a reference (Er) and the other for nerve recording (Ee). Electrodes were fixed to the body at several points with dental wax (red circles). (B) The hook-shaped Ee electrode was placed and bent around one connective just anterior to the terminal abdominal ganglion (TAG). (C) Both electrodes were fixed with the dental wax to the dorsal side of the thorax and the abdomen (yellow arrowheads), allowing the cricket to move freely.
Piston stimulation
Crickets were stimulated using a piston (LAL35 actuator/LACI controller, Cedrat Technologies, Meylan, France) that has been used and tested in previous studies (Dangles et al., 2006b; Dangles et al., 2007; Dupuy et al., 2011). The piston's displacement was precisely controlled using macro commands via hyperterminal software and the RS 232 port of a laptop. Three different piston velocities were used to stimulate the cricket (16, 26 and 37 cm s–1), corresponding to velocities within the range recorded for spider attacks (Dangles et al., 2006b). An extension cable (8 mm diameter) was added to the piston to enable precise manual positioning, 4 to 5 mm from the cricket, and orientation (oriented to the rear of the insect) of the effective stimulus source with respect to the animal for each trial. The piston displayed some deceleration before reaching its full extension, and showed some oscillatory behavior at the termination of its movement. All of our analyses were restricted to data occurring before the onset of the piston deceleration, so that any spikes elicited by these fluctuations were eliminated. The velocity versus time profiles of air currents generated by the moving piston have been measured precisely, over a wide range of piston velocities, using particle image velocimetry (PIV) by our team, and are reported elsewhere (Dangles et al., 2006b). The measurements have been repeated over the years and have been found to be quite stable and consistent. We used those calibrations to determine the air current velocities generated in the experiments reported here.
Recording setup
The recording electrode was connected through a pre-amplifier (×10) to an amplifier integrated with an A/D converter (×10 IDAC02, Intelligent Data Acquisition Controller, Syntech, The Netherlands). All amplification was done in AC mode. Data were collected using commercially available software (Autospike, Syntech).
Experiments were filmed using a CMOS RDT/16 high-speed video camera using an f2.8/28–75 mm lens, producing a field of view of 8×8 cm around the cricket (DRS Data & Imaging Systems, Oakland, NJ, USA). Recordings were made at 800 frames s–1 at a resolution of 1024×624 pixels. Video data were acquired using MiDAS 2 software (Xcitex, Cambridge, MA, USA). A pre-triggered recording mode was used, which allowed recording between 110 and 875 ms before stimulation. High-speed video recordings revealed the occurrence of a consistent delay of approximately 15 ms between the triggering pulse and the beginning of the piston displacement. This delay was taken into account in the analysis of the data.
Data recording
Control recordings were conducted in the laboratory using five crickets. The crickets were kept fixed to the glass strip in order to reduce air movements that could stimulate the cerci. In these conditions, background activity through the abdominal connectives was recorded in the absence of any stimulation.
Experiments were conducted outside the laboratory, with the preparations exposed to ambient air turbulence. The cricket and piston were positioned on an artificial substrate made of a sheet of paper (210×297 mm), to facilitate video recording. In these semi-field conditions, 11 freely moving crickets were used. We video-recorded the experiments in order to monitor the exact trajectories of the piston and the movements of the crickets. Each cricket was stimulated two to four times with each one of the three different piston velocities used in a random sequence (16, 26 and 37 cm s–1).
Data analysis
The analysis of the electrophysiological spike train data was carried out using the MIEN software package (Model Interaction Environment for Neuroscience, Bozeman, MT, USA, freely available at http://mien.msu.montana.edu/) supplemented with MATLAB® routines. As the first step in the analysis, we eliminated low-frequency baseline fluctuations from the electrophysiological recordings using the band-pass filters 500–10,000, 1000–10,000 and 1500–10,000 Hz, in sequence. A sinusoidal electrical radiative noise created by the actuation of the piston was then removed by subtracting a sinusoidal function having the same amplitude, phase and frequency (2 kHz) as the noise. A threshold just above the noise was then chosen for extraction of axonal spikes. To compensate for the relatively low sampling rate (20,833 Hz), the spike minimum value was estimated using interpolation methods. The interpolation was linear for the minimum slope, operating on the first derivative. It was also linear, but operating on the second derivative, for the maximal slope. Both are estimated by center difference.
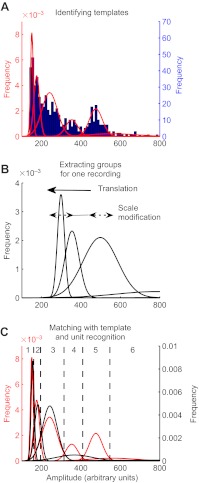
The distribution of amplitudes of background and stimulus-elicited spikes from a single preparation is shown in Fig. 2A, with the smallest amplitude units to the left and the larger amplitude units to the right. The distribution is very non-uniform, and spans a range corresponding to a factor of five in amplitude. Note that the amplitude scale is in arbitrary units: the recorded absolute amplitude of the spikes in a single preparation depended on several technical factors related to the coupling impedance between the electrode and the nerve.
Fig. 2.
Histograms of the spikes recorded extracellularly from one animal, at the connective between the fourth and the fifth (terminal) ganglia. The x-axes are spike amplitudes in arbitrary units, and the y-axes are the number of spikes recorded at that amplitude. (A) Distribution of recorded spike amplitudes (blue histogram), overlaid with six Gaussian functions calculated from the Gaussian mixture model algorithm (red curves). (B) Scale and translation transformations used to match this set of six calculated Gaussian functions (red in A) to another set of four Gaussian functions extracted from recordings obtained from a different animal (black curves). (C) The same six thresholds or ‘cut points’ (dotted lines) were used to analyze all recordings on the basis of the model template.
Visual inspection of the distribution shows several clusters. A statistical cluster analysis was performed on minimum distributions using MIXMOD 2.1.1 (Biernacki et al., 2006) with the ‘Bayesian information criterion’ parameter used as the criterion for the goodness of fit. Across all data sets used for our data analysis, a maximum of six clusters were obtained (and used as the template), with an average of three to four for a typical recording (Fig. 2). It is known that there are more than six air-current-sensitive projecting interneurons in each connective, and that subsets of the projecting axons have similar diameters (Insausti et al., 2008). For example, there is a set of two interneurons (identified as 10-2 and 10-3) that have indistinguishable diameters, and would therefore be expected to have indistinguishable action potentials as recorded by extracellular electrodes. Thus, we conclude that the observed clusters correspond to six different subsets of cercal interneurons, each subset of which has similar axon diameters within the subset. For the remainder of this report, we therefore refer to these six clusters as ‘unit groups’. Unequivocal identification of the specific identified interneurons belonging to each of the different amplitude groups was not possible in this study; however, for our purposes, that information was not necessary.
Curves representing the clusters extracted from all preparations were compared and scaled to the template through translation and scaling operations (Fig. 2B). Recordings that didn't show a good match to the template were discarded (supplementary material Table S1). The translation and scaling factors were calculated using the values of the mean of the Gaussian curves given by MIXMOD for both recordings. If A1 and A2 are the means of the first and second Gaussian curve of the red lines (Fig. 2A) and B1 and B2 are the means of the first and second Gaussian curve of the black lines (Fig. 2B), the definitions are: scale=(A2–A1)/(B2–B1) and translation= (B1×scale)–A1.
Translations and scale modifications were applied to values of voltage recorded as:
| (1) |
The same thresholds were used for all recordings. For all subsequent analysis, the spikes were sorted into amplitude groups based on a division of the distributions into six clusters, as shown in Fig. 2C. Cluster 6 corresponds to the spikes of largest amplitude, and cluster 1 corresponds to spikes of smallest amplitudes.
If a cricket moved during the onset of piston movement, the associated data were discarded from the data set to make the analysis and interpretation more accurate. However, it is relevant to have freely moving crickets as it indicates that the animals were in conditions as close as possible to natural conditions. After the data analysis and avoiding multiple recordings for the same individual, a subset of 18 recordings was kept (eight recordings for 16 cm s–1, five for 26 cm s–1 and five for 37 cm s–1) (see supplementary material Table S1).
The precise moment where the piston starts decelerating was extracted from the videos. For further analyses, only spikes occurring before these moments were taken into account. The number of spikes occurring during the 1 s period before the piston was moving, in the laboratory and in the field, were compared using the Wilcoxon rank sum test.
RESULTS
The crickets did not show a strong escape response when stimulated by the piston. Only some leg movements or small turns were observed with a few crickets (8% of the recordings).
Spontaneous activity
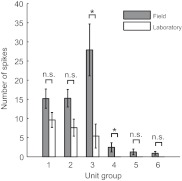
The spiking activity through the abdominal connective was recorded in the field and in the laboratory, in the absence of stimulation, to investigate the effects of the natural ambient air currents present in the field (Fig. 3). To estimate the average spontaneous activity in the absence of stimuli, we took one sample from each of the 11 animals (at random if more than one was available) and averaged across animals. The background noise was low in the laboratory, and we can assume that the activity recorded in this condition corresponds primarily to spontaneous activity. Spontaneous spikes were only observed for unit groups 1, 2 and 3. No spontaneous activity was recorded for units groups 4 through 6. The activity of all six unit groups was higher in the field than in the laboratory, and this difference was statistically significant for unit groups 3 and 4, suggesting that the neurons responded to ambient air currents present in the field. Responses to background noise in the field varied from unit to unit. Only spikes from unit groups 4 to 6 were used in the following analyses, as they most likely correspond to the largest diameter neurons. Indeed these neurons have the fastest transmission to higher centers and should be the ones involved in the first reaction of the cricket.
Fig. 3.
Histogram of the number of spikes (±s.e.m.) for the six different unit groups identified during 1 s in the absence of any stimulus (i.e. no piston movement) recorded in the field (gray bars) and in the laboratory (white bars). Statistics correspond to Wilcoxon rank sum tests (*P<0.05; n.s., not significant).
Neural activity evoked by an approaching piston
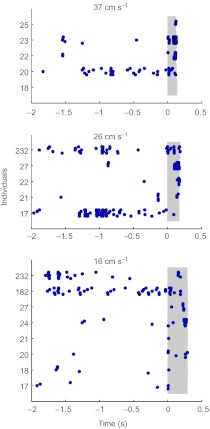
The three panels in Fig. 4 show raster plots of the spikes generated by neurons in unit groups 4, 5 and 6 (i.e. the three groups with the largest amplitude units) as a function of time, during a 3 s window bracketing the piston movement, for three different piston velocities (i.e. 16, 26 and 37 cm s–1). Each graphic includes the 2 s period preceding initiation of piston movement, and a period starting (at time zero) when piston movement is initiated. The duration of piston movement is shaded in gray. Note that the total excursion of the piston was different for each recording as the piston started decelerating at a different time for each recording. Despite inter-individual variability, the number of spikes shows an increase during piston movement. The spiking activity before the onset of piston movement corresponds to the activity induced by natural ambient air currents, as observed in the previous analysis (Fig. 3).
Fig. 4.
Raster plot of spikes from unit groups 4, 5 and 6 as a function of time. Gray bars represent the time during which the piston moved, starting at t=0 s. For the piston moving at 37 cm s–1, N=5; for the piston moving at 26 cm s–1, N=5; and for the piston moving at 16 cm s–1, N=8. For each individual, some vertical jitter was applied to avoid overlap of points.
From movement to flow velocity
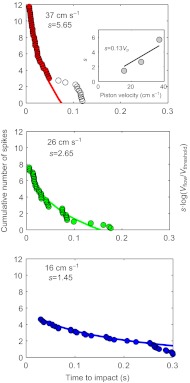
Earlier studies have shown that the piston-evoked airflow velocity at a cercus at any point in time depends upon two factors: the speed of the piston and the distance of the piston from the cercus at that time point. To relate the observed piston-induced spiking activity to the flow velocity produced by the approaching piston, we computed the spiking responses of unit groups 4, 5 and 6 as functions of the distance and time between the piston and cricket. The results are shown in Fig. 5.
Fig. 5.
Responses of units in groups 4, 5 and 6 during piston movement for three piston velocities. The graphs represent the cumulative distribution of spikes as a function of time to virtual impact. The time=0 points correspond to the spikes generated at the instant when the piston would have hit the cercus. The lines are the predicted cumulative distribution of spikes computed using the flow velocity at the rear of the animal multiplied by a factor s, which is a linear function of the piston velocity (the scaling relationship is shown in the inset). For 37 cm s–1, s=5.65 and R2=0.98; for 26 cm s–1, s=2.65 and R2=0.96; and for 16 cm s–1, s=1.45 and R2=0.99.
The data points represent the cumulative number of spikes generated as a function of the time between the initiation of piston movement and the time to piston ‘virtual contact’ with the cerci, i.e. the time at which the piston would have contacted the cercus if movement would have continued. Video-camera-based measurements of the distance d and the piston velocity Vp enabled us to calculate this virtual time to contact t, using the simple relationship t=d/Vp. Note that the neural response is expressed as the total cumulative number of spikes generated by all three unit groups for all individuals, starting from the onset of the piston movement and running until the beginning of its deceleration. At higher piston speeds, there were more spikes for the same time interval. This is expected, because the piston moved through a larger distance per unit time for successively higher velocities: for the same amount of time before impact, the piston is much further from the cricket at high velocities than at low velocities. Hence, the spiking occurs within a shorter time window at high velocities.
Visual inspection of the three data sets plotted (Fig. 5) shows that most of the data points in each set fall along a well-defined curve. We assume that the flow produced is the potential flow produced by a sphere of equivalent diameter and that the legs do not produce any high frequency signals with large amplitude, and we neglect the effect of the ground. These assumptions were found to be valid in a study conducted by other authors (Kant and Humphrey, 2009), which uses previous data from our piston. Starting with these very simple assumptions, we derived a function that fits the observed data trends extremely well, as described below. The function fitted to each data set is plotted in each panel in the corresponding color. We note that for the highest piston velocity (i.e. top panel, red curve), the spikes that occurred earlier than 50 ms before virtual impact (plotted with open circles) deviate substantially from the curve defined by the remainder of the data points. We chose not to use those early data points for fitting the red curve. This is because the air currents corresponding to these spikes corresponded to extremely low air current velocities, and the precise timing of these spikes was most likely perturbed by noise.
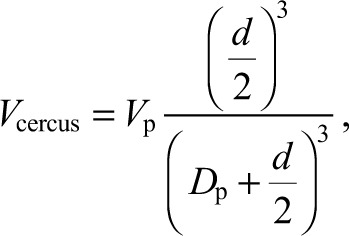
The function for the plotted curves was derived as follows. First, we postulated that the cumulative spike count would have some dependency on the velocity of the airflow at the cerci as a function of time. The function describing the relationship between the velocity of the piston tip and the air velocity at the cercus is (all velocities in cm s–1):
 |
(2) |
where Vcercus is the air velocity at the cercus, Vp is the velocity of the piston, Dp is the distance of the piston head from the cercus and d is the diameter of the piston (Kant and Humphrey, 2009), 8 mm for our experiments, which has been shown to correspond well with a typical predatory spider.
Starting with this equation, we determined that an excellent fit to the observed data could be obtained by the following equation:
 |
(3) |
where Vthreshold corresponds to the threshold air current velocity, below which the system cannot respond reliably. For this system, Vthreshold was set at 0.003 cm s–1 on the basis of previously published data (Shimozawa and Kanou, 1984). Thus, the only unconstrained variable in this equation is the scalar quantity s.
For each of the three data sets, we calculated the value for s that gave the best fit of the curve for cumulative spikes (i.e. Ncumul_spikes) to the data points. The three values for s that gave the best fits to the data (i.e. the colored lines superimposed on each data set in Fig. 5) are plotted in the insert of the top panel in Fig. 5. Note that the three s-values fall along a simple linear function of piston velocity:
| (4) |
Note, then, that Eqns 2, 3 and 4 can be combined and rearranged to yield the following equation:
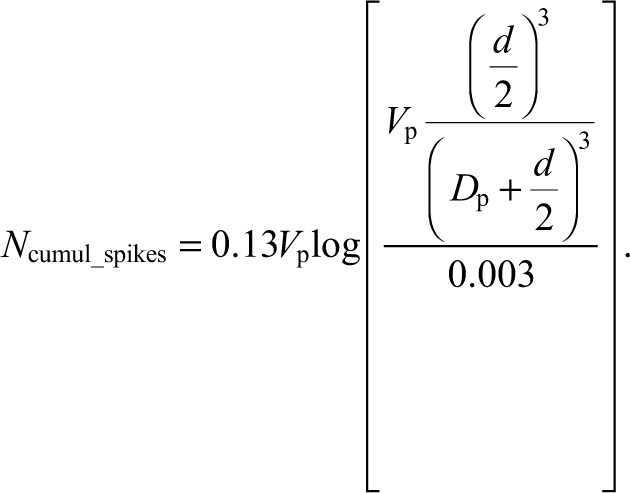 |
(5) |
The possible significance of this relationship is discussed below.
DISCUSSION
The specific aim of this work was to characterize the spiking activity through the connectives from the TAG to higher nervous centres elicited in response to object movements that mimicked natural predators in the presence of natural ambient noise. We demonstrate that many projecting interneurons in the cercal sensory system are activated by the stimuli we used. We also describe a scaling law between the cumulative number of spikes and the velocities of both the approaching object and the airflow at the cricket rear with potential behavioral significance.
Linking electrophysiology to functional morphology
It was not possible to match each unit to a particular interneuron. Nevertheless, we can reasonably assume that the relative amplitudes of the different units correspond to their relative axon diameters, i.e. a signal of large amplitude corresponds to a large axon. Unit group 1 would then correspond to the smaller neurons and unit group 6 to the largest ones. In fact, the spikes from the neuron or neurons in unit group 6 were the largest spikes that were observed in the recordings. No spontaneous activity was recorded for the larger amplitude units (4, 5 and 6), reinforcing the idea they correspond to the largest giant interneurons. Indeed, previous authors also did not record spontaneous activity for such neurons (Murphey et al., 1977). According to the anatomical description of the cercal system of this species there are nine so-called ‘giant interneurons’, with one or two having the largest diameter axons and a few others having smaller but similar diameters (Insausti et al., 2008). We do not know whether the largest amplitude units we recorded correspond precisely to the interneurons identified as the lateral giant interneuron and medial giant interneuron in other species, nor do we know whether the giant interneurons in the species studied here fire spontaneously. The answers to these questions would require intracellular recordings. Thus, it appears that our behaviorally realistic stimuli elicited responses from a group of cercal interneurons that spanned the entire range of axon diameters.
Nervous activity in semi-field conditions and response to natural ambient air currents
The activity recorded in the laboratory while the cerci were not actively stimulated corresponds to their spontaneous background activity to very low ambient noise. Under semi-field conditions, the increased level of baseline spiking activity (i.e. in the absence of piston-generated stimulation) reflects the extreme sensitivity of the cercal system; most of the background spiking can be attributed to the natural level of ambient air current noise, rather than to the intrinsic noisiness of the neurons themselves. These results demonstrate the extent to which the detection of the low-amplitude air current signatures of approaching predators is confounded by the ambient air currents present in the natural environment: many of the cercal units are already activated by background noise, and the approach of a predator is signaled by an increase in their activity. To our knowledge, this is the first demonstration of responses to natural ambient noise by the giant interneurons. Moreover, this is the first demonstration in the field, with natural ambient air current background, of the electrophysiological low signal-to-noise discrimination ability, which was also shown in the laboratory in cockroaches by Plummer and Camhi (Plummer and Camhi, 1981).
Very few crickets responded to our stimulus with an escape reaction. There are at least two possible reasons for this lack of response. First, behavioral experiments (Dangles et al., 2007; Dupuy et al., 2011) have shown that a non-negligible proportion of crickets were escaping only after being touched by the piston [ranging from 67 to 81%, depending on the instar (Dangles et al., 2007)]. In our experiments, we avoided touching the cricket with the piston to prevent damage to the preparation. Thus, even though there is evidence that the nervous system has registered a response to a piston movement, there is not necessarily a motor response to that stimulus. Second, the surgical procedures associated with implanting the electrodes may have reduced the behavioral responsiveness of the animal to these stimuli, even though we took care to determine that the crickets were able to walk and jump after those procedures.
The preparations used in most of the published studies on the cercal system consist of removing all the legs, the wings and often the head (Kanou and Shimozawa, 1984; Miller et al., 1991; Kanou, 1996; Clague et al., 1997; Yono and Shimozawa, 2008). Some groups go even further to obtain good signals. Mulder-Rosi et al. (Mulder-Rosi et al., 2010), for example, had only the two cerci and the ganglia-chain intact, but the digestive, reproductive and fat tissues were all removed. As we have discussed in another paper (Dupuy et al., 2011), the stimuli amplitude in those papers are often several orders of magnitude higher than the natural signal. Thus, our preparation, in which the cricket is operated but is otherwise able to move in a somewhat constricted manner, is a real achievement.
Computing the airflow velocity
The ability of crickets to escape from rapidly approaching predators implies that the cercal system must, in some sense or at some level, detect or ‘compute’ some parameter(s) related to the speed and dynamics of complex air current stimuli. Previous studies have shown that the spiking frequency of some giant cercal interneurons increases with increasing air current velocity (Kanou and Shimozawa, 1984; Miller et al., 1991; Chiba et al., 1992; Jacobs, 1995), and that other cercal giant interneurons require a moving ‘front’ of air displacement sweeping over the cerci in order to be activated (Mulder-Rosi et al., 2010). One study on cockroaches has shown the importance of air current acceleration in discriminating behaviorally relevant stimuli from background noise (e.g. Plummer and Camhi, 1981). Those authors also suggested that the acceleration could be processed by the nervous system either at the level of mechano-electrical transduction or at some higher level. Our results suggest a possible mechanism through which the nervous system may extract information about air current acceleration.
The displacements of the piston in our experiments simulate the approach of a predator, and generate airflows that are in general much weaker and have dynamical signatures that are much more realistic than stimuli used in most earlier studies. Specifically, the airflow velocity increases gradually at the level of cerci as the piston comes closer, as is the case for an approaching spider (Dangles et al., 2006b; Casas et al., 2008). This is in direct contrast to the instantaneous, uniform onset of bulk air movements generated with loudspeaker-based stimulators used for most previous studies.
The strong, systematic dependency of the cumulative interneuron responses on the velocity, position and diameter of the piston head, as represented by Eqn 5, has not been documented in previous studies using intact crickets. The relationship may be of substantial behavioral significance, in that it could in theory provide a basis for determining the time to contact of an approaching source. This operation would presumably require the existence of a higher-level decoder to integrate the cumulative spikes; such an integrating decoder could enable the animal to discriminate between ‘bulk flow’ air movements and air movements caused by approaching objects, and hence to make a binary decision to initiate an appropriately timed escape response. A population vector model has been proposed in cockroaches for the coding of stimulus direction (Liebenthal et al., 1994; Levi and Camhi, 2000a; Levi and Camhi, 2000b). The existence of such a higher-level integrator seems therefore plausible in our case, but is an assumption that needs to be tested using electrophysiological methods. Furthermore, if the animal had multiple integrating decoders with different time constants, they could serve as a basis for discriminating between stimulus sources with different dynamic characteristics. Specifically, a particular type of predator would be expected to generate a cluster of possible cumulative spike count profiles such as those plotted in Fig. 5. Each different class of predator would be expected to generate a profile cluster that would have a different set of typical values for Vp(t) and d (e.g. consider the differences between a running spider and a lunging frog). Considering the fact that there are three different variables in Eqn 5, effective discrimination might actually require the joint operation of two or more independent integrators for the cumulative spike count, each set with a different intrinsic integration time constant. As well as enabling the animal to determine the distance or time-to-strike of an approaching object, the cumulative cercal system response would theoretically provide enough information to the ensemble of integrators to enable the animal to distinguish between a small object approaching at high speed and a large object approaching at a lower speed. Thus, our results support the long-standing assumption that crickets assess some aspects of the airflow velocity as a measure of the imminence and nature of a predatory attack.
Supplementary Material
ACKNOWLEDGEMENTS
We thank M. A. Wycke for help with the experiments and T. Insausti for help with dissections and for the drawing in Fig. 1.
FOOTNOTES
Supplementary material available online at http://jeb.biologists.org/cgi/content/full/215/14/2382/DC1
FUNDING
This work is part of the research conducted within the Customized Intelligent Life Inspired Arrays (CILIA) project [FP6-IST-016039 to J.S.], funded by the European Community under the Information Society Technologies (IST) Program, Future and Emergent Technologies (FET), Lifelike Perception Systems action. This study was also supported by the National Institutes of Health (NIH) [grant R01 MH-064416 to J.M.]. Deposited in PMC for release after 12 months.
REFERENCES
- Biernacki C., Celeux G., Govaert G., Langrognet F. (2006). Model-based cluster and discriminant analysis with the MIXMOD software. Comput. Stat. Data Anal. 51, 587-600 [Google Scholar]
- Camhi J. M. (1984). A case study in neuroethology: the escape system of the coackroach. In Neuroethology: Nerve Cells and the Natural Behaviour of Animals (ed. Camhi J. M.), pp. 79-105 Sunderland, MA: Sinauer Associates; [Google Scholar]
- Campan R. (1965). Etude du cycle biologique du grillon Nemobius sylvestris dans la region toulousaine. Bull. Soc. Hist. Nat. Toulouse 100, 371-378 [Google Scholar]
- Casas J., Steinmann T., Dangles O. (2008). The aerodynamic signature of running spiders. PLoS ONE 3, e2116 [DOI] [PMC free article] [PubMed] [Google Scholar]
- Chiba A., Kamper G., Murphey R. (1992). Response properties of interneurons of the cricket cercal sensory system are conserved in spite of changes in peripheral receptors during maturation. J. Exp. Biol. 164, 205-226 [Google Scholar]
- Clague H., Theunissen F., Miller J. P. (1997). Effects of adaptation on neural coding by primary sensory interneurons in the cricket cercal system. J. Neurophysiol. 77, 207-220 [DOI] [PubMed] [Google Scholar]
- Dangles O., Magal C., Pierre D., Olivier A., Casas J. (2005). Variation in morphology and performance of predator-sensing system in wild cricket populations. J. Exp. Biol. 208, 461-468 [DOI] [PubMed] [Google Scholar]
- Dangles O., Casas J., Coolen I. (2006a). Textbook cricket goes to the field: the ecological scene of the neuroethological play. J. Exp. Biol. 209, 393-398 [DOI] [PubMed] [Google Scholar]
- Dangles O., Ory N., Steinmann T., Christides J. P., Casas J. (2006b). Spider’s attack versus cricket’s escape: velocity modes determine success. Anim. Behav. 72, 603-610 [Google Scholar]
- Dangles O., Pierre D., Christides J. P., Casas J. (2007). Escape performance decreases during ontogeny in wild crickets. J. Exp. Biol. 210, 3165-3170 [DOI] [PubMed] [Google Scholar]
- Dupuy F., Casas J., Body M., Lazzari C. R. (2011). Danger detection and escape behaviour in wood crickets. J. Insect Physiol. 57, 865-871 [DOI] [PubMed] [Google Scholar]
- Edwards J. S., Palka J. (1974). The cerci and abdominal giant fibres of the house cricket, Acheta domesticus. I. Anatomy and physiology of normal adults. Proc. R. Soc. Lond. B 185, 83-103 [DOI] [PubMed] [Google Scholar]
- Insausti T. C., Lazzari C. R., Casas J. (2008). The terminal abdominal ganglion of the wood cricket Nemobius sylvestris. J. Morphol. 269, 1539-1551 [DOI] [PubMed] [Google Scholar]
- Insausti T. C., Lazzari C. R., Casas J. (2011). The morphology and fine structure of the giant interneurons of the wood cricket Nemobius sylvestris. Tissue Cell 43, 52-65 [DOI] [PubMed] [Google Scholar]
- Jacobs G. A. (1995). Detection and analysis of air currents by crickets. Bioscience 45, 776-785 [Google Scholar]
- Kämper G., Dambach M. (1981). Response of the cercus-to-giant interneuron system in crickets to species-specific song. J. Comp. Physiol. A 141, 311-317 [Google Scholar]
- Kanou M. (1996). Directionality of cricket giant interneurons to escape eliciting unidirectional air-current. Zools. Sci. 13, 35-46 [Google Scholar]
- Kanou M., Shimozawa T. (1984). A threshold analysis of cricket cercal interneurons by an alternating air-current stimulus. J. Comp. Physiol. A 154, 357-365 [Google Scholar]
- Kant R., Humphrey J. A. (2009). Response of cricket and spider motion-sensing hairs to airflow pulsations. J. R. Soc. Interface 6, 1047-1064 [DOI] [PMC free article] [PubMed] [Google Scholar]
- Levi R., Camhi J. M. (2000a). Wind direction coding in the cockroach escape response: winner does not take all. J. Neurosci. 20, 3814-3821 [DOI] [PMC free article] [PubMed] [Google Scholar]
- Levi R., Camhi J. M. (2000b). Population vector coding by the giant interneurons of the cockroach. J. Neurosci. 20, 3822-3829 [DOI] [PMC free article] [PubMed] [Google Scholar]
- Levin J. E., Miller J. P. (1996). Broadband neural encoding in the cricket cercal sensory system enhanced by stochastic resonance. Nature 380, 165-168 [DOI] [PubMed] [Google Scholar]
- Liebenthal E., Uhlmann O., Camhi J. M. (1994). Critical parameters of the spike trains in a cell assembly: coding of turn direction by the giant interneurons of the cockroach. J. Comp. Physiol. A 174, 281-296 [DOI] [PubMed] [Google Scholar]
- Magal C., Dangles O., Caparroy P., Casas J. (2006). Hair canopy of cricket sensory system tuned to predator signals. J. Theor. Biol. 241, 459-466 [DOI] [PubMed] [Google Scholar]
- Miller J. P., Jacobs G. A., Theunissen F. E. (1991). Representation of sensory information in the cricket cercal sensory system. I. Response properties of the primary interneurons. J. Neurophysiol. 66, 1680-1689 [DOI] [PubMed] [Google Scholar]
- Mulder-Rosi J., Cummins G. I., Miller J. P. (2010). The cricket cercal system implements delay-line processing. J. Neurophysiol. 103, 1823-1832 [DOI] [PMC free article] [PubMed] [Google Scholar]
- Murphey R. K., Palka J., Hustert R. (1977). The circus-to-giant interneuron system of crickets. II. Response characteristics of two giant interneurons. J. Comp. Physiol. A 119, 285-300 [Google Scholar]
- Plummer M. R., Camhi J. M. (1981). Discrimination of sensory signals from noise in the escape system of the cockroach: The role of wind acceleration. J. Comp. Physiol. A 142, 347-357 [Google Scholar]
- Ritzmann R. E. (1984). The cockroach escape response. In Neural Mechanisms of Startle Behavior (ed. Eaton R. C.), pp. 93-131 New York: Plenum Press; [Google Scholar]
- Shimozawa T., Kanou M. (1984). Varieties of filiform hairs: range fractionation by sensory afferents and cercal interneurons of a cricket. J. Comp. Physiol. A 155, 485-493 [Google Scholar]
- Steinmann T., Casas J., Krijnen G., Dangles O. (2006). Air-flow sensitive hairs: boundary layers in oscillatory flows around arthropod appendages. J. Exp. Biol. 209, 4398-4408 [DOI] [PubMed] [Google Scholar]
- Yono O., Shimozawa T. (2008). Synchronous firing by specific pairs of cercal giant interneurons in crickets encodes wind direction. Biosystems 93, 218-225 [DOI] [PubMed] [Google Scholar]
Associated Data
This section collects any data citations, data availability statements, or supplementary materials included in this article.


