SUMMARY
The northern elephant seal pup (Mirounga angustirostris) undergoes a 2–3 month post-weaning fast, during which it depends primarily on the oxidation of fatty acids to meet its energetic demands. The concentration of non-esterified fatty acids (NEFAs) increases and is associated with the development of insulin resistance in late-fasted pups. Furthermore, plasma NEFA concentrations respond differentially to an intravenous glucose tolerance test (ivGTT) depending on fasting duration, suggesting that the effects of glucose on lipid metabolism are altered. However, elucidation of the lipolytic mechanisms including lipase activity during prolonged fasting in mammals is scarce. To assess the impact of fasting and glucose on the regulation of lipid metabolism, adipose tissue and plasma samples were collected before and after ivGTTs performed on early (2 weeks, N=5) and late (6–8 weeks; N=8) fasted pups. Glucose administration increased plasma triglycerides and NEFA concentrations in late-fasted seals, but not plasma glycerol. Fasting decreased basal adipose lipase activity by 50%. Fasting also increased plasma lipase activity twofold and decreased the expressions of CD36, FAS, FATP1 and PEPCK-C by 22–43% in adipose tissue. Plasma acylcarnitine profiling indicated that late-fasted seals display higher incomplete LCFA β-oxidation. Results suggest that long-term fasting induces shifts in the regulation of lipolysis and lipid metabolism associated with the onset of insulin resistance in northern elephant seal pups. Delineation of the mechanisms responsible for this shift in regulation during fasting can contribute to a more thorough understanding of the changes in lipid metabolism associated with dyslipidemia and insulin resistance in mammals.
KEY WORDS: lipid metabolism, adipose tissue, insulin resistance, fasting, carnitine
INTRODUCTION
As the primary site of triglyceride storage, adipose tissue plays an important role in regulating the availability of lipids during prolonged fasting. Adipose-derived lipoprotein lipase (LPL) contributes to the regulation of circulating non-esterified fatty acids (NEFAs) by cleaving NEFAs from plasma triglycerides so that they may be taken up by various tissues (Ong and Kern, 1989; Vannier and Ailhaud, 1989; Knutson, 2000). NEFAs taken up by fatty acid translocase (CD36) or fatty acid transport protein (FATP1) in adipose tissue are either transported into the mitochondria by carnitine palmitoyl transferase I (CPTI) to be oxidized, or are re-esterified with glyceride-glycerol and stored as triglycerides for later use (Reshef et al., 2003; Gertow et al., 2004; Doh et al., 2005; Schwenk et al., 2010). As they are responsive to changes in circulating hormones as well as to changes in nutritional state, intracellular lipases such as hormone-sensitive lipase (HSL) or adipose triglyceride lipase (ATGL) can be activated to readily make NEFA available when an organism's energetic demands increase (Chaves et al., 2011; Reshef et al., 2003; Bertile and Raclot, 2011), such as with fasting. Hormones such as apelin and insulin can inhibit lipolysis by preventing lipase activation within adipocytes. Insulin can also stimulate fatty acid synthase (FAS) to produce fatty acids and phosphoenol pyruvate carboxykinase (PEPCK-C) to generate glyceride-glycerol through glyceroneogenesis in adipose, and thus increase triglyceride stores (Holland and Hardie, 1985; Chen et al., 2010). However, fasting decreases the concentrations of both insulin and apelin in circulation (Choi et al., 2010; Yue et al., 2010; Viscarra et al., 2011b; Viscarra et al., 2011a; Yue et al., 2011). Therefore, mammals enduring prolonged food deprivation must possess well-regulated intracellular mechanisms to properly manage lipid metabolism to prevent premature depletion of their energy stores.
After birth, northern elephant seal pups nurse for approximately 4 weeks, over which time they nearly triple in mass, attaining approximately 50% body fat because of the high lipid content of their mother's milk (Ortiz et al., 1978; Riedman and Ortiz, 1978; Ortiz et al., 1984; Ortiz et al., 2003). Immediately after the fourth week, pups are weaned and they commence a 2–3 month fast, during which they synthesize large quantities of pigments for muscle and blood, remodel bone and dentition, and develop the diving abilities necessary to forage at sea (Reiter et al., 1978; Patterson-Buckendahl et al., 1994). During the post-weaning fast, the oxidation of NEFA contributes to as much as 95% of the pups' metabolic rate (Ortiz et al., 1978; Castellini et al., 1987; Adams and Costa, 1993), suggesting that adipose tissue must be able to provide the necessary substrates to maintain the pups' energetic demands, allowing them to sustain metabolism while sparing protein and amino acid stores (i.e. lean tissue). Although data exist on the effects of fasting on circulating components of lipid metabolism in elephant seals (Costa and Ortiz, 1982; Castellini et al., 1987; Adams and Costa, 1993; Ortiz et al., 2001; Houser et al., 2007; Tift et al., 2011), the contributions of the molecular and cellular mechanisms to the regulation of lipid metabolism in seals and extended fasting mammals, in general, remain elusive.
Therefore, the goals of this study were to identify and assess the molecular and cellular mechanisms evolved by elephant seals that regulate lipid metabolism, allowing these mammals to undergo such protracted periods of fasting. Previously, intravenous glucose tolerance tests (ivGTT) demonstrated the manifestation of insulin resistance in late-fasted versus early-fasted seal pups (Viscarra et al., 2011b). In addition to impaired glucose tolerance in late-fasted seals, plasma concentrations of NEFA post-ivGTT were not reduced and in fact were modestly increased. This suggested that in late-fasted animals, post-ivGTT increases in glucose and insulin failed to robustly suppress lipolysis and/or ivGTT elicited a reduced tissue utilization of NEFA compared with that in insulin-sensitive early-fasted seals. These outstanding questions necessitate a more thorough examination of the components of lipid metabolism in plasma and adipose tissue of fasting pups. The increased concentration of plasma NEFAs in late-fasted pups might indicate an increase in rates of lipolysis (Viscarra et al., 2011b), so we tested the hypothesis that fasting increases lipase activity in elephant seal pups.
MATERIALS AND METHODS
All procedures were reviewed and approved by the Institutional Animal Care and Use Committees of both the University of California Merced and Sonoma State University. All work was realized under National Marine Fisheries Service marine mammal permit no. 87-1743.
Glucose administration and sample collection
Details of the glucose administrations and sampling protocol have been published previously (Viscarra et al., 2011b), but are briefly presented here for clarity. Northern elephant seal pups [Mirounga angustirostris (Gill 1866)] constituting two different cohorts at Año Nuevo State Park were studied at two post-weaning periods: early (2–3 weeks post weaning; N=5) and late (6–8 weeks post weaning; N=8). After weighing, pups were sedated with 1 mg kg–1 Telazol (tiletamine/zolazepam HCl, Fort Dodge Labs, Fort Dodge, IA, USA) administered intramuscularly. Once they were immobilized, an 18 gauge, 3.5 inch spinal needle was inserted into the extradural vein. Pre-ivGTT blood samples and adipose biopsies were collected as previously described (Viscarra et al., 2011a; Viscarra et al., 2011b). Following initial sample collections, animals were administered a mass-specific bolus of glucose (0.5 g kg–1) manually via the spinal needle over 2 min. Subsequent blood samples were collected at 5, 10, 15, 20, 30, 45, 60, 90, 120 and 150 min post-ivGTT. Subsequent adipose tissue biopsies were collected at 60 and 150 min post-ivGTT.
Sample preparation
Blood samples were centrifuged for 15 min at 3000 g at 4°C, and the plasma was transferred to cryo-vials, frozen by immersion in liquid nitrogen and immediately stored at –80°C. Adipose tissue was homogenized and the cytosolic and membrane-bound protein fractions separated as previously described (Viscarra et al., 2011b). Total protein content in both cytosolic and membrane fractions was measured by the Bradford assay (Bio-Rad Laboratories, Hercules, CA, USA) and used to normalize the loading of samples into gel wells (Viscarra et al., 2011b; Viscarra et al., 2011a).
Western blot
Twenty-five micrograms of total protein were resolved in 4–15% Tris-HCl sodium dodecyl sulfate (SDS) gradient gels. Proteins smaller than 100 kDa were electroblotted using the Bio-Rad Trans Blot SD semi-dry cell onto 0.45 μm nitrocellulose membranes. Proteins larger than 100 kDa were electroblotted using the Bio-Rad Mini Protean Transfer apparatus onto 0.45 μm nitrocellulose membrane. Membranes were blocked with 3% bovine serum albumin (BSA) in phosphate buffered saline (PBS) containing 0.05% Tween 20 (PBST), and incubated overnight with primary antibodies against ACSVL5 (FATP1), ATGL, CD36, CPTI, CPTII, FAS, HSL and LPL (Santa Cruz Biotechnologies, Santa Cruz, CA, USA), diluted 1:500 to 1:2000. Membranes were washed, incubated with HRP-conjugated secondary antibodies (Santa Cruz Biotechnologies), re-washed and developed using the Immun-Star Western C kit (Bio-Rad Laboratories). Blots were visualized using a Chemi-Doc XRS system (Bio-Rad Laboratories) and quantified using Bio-Rad's Quantity One software. In addition to consistently loading the same amount of total protein per well (25 μg), densitometry values were further normalized by correcting for the densitometry values of β-actin (Viscarra et al., 2011a; Viscarra et al., 2011b).
Plasma analyses
The plasma concentrations of triglycerides (Cayman Chemical, Ann Arbor, MI, USA), glycerol (Cayman Chemical) and NEFAs (Wako Chemicals, Richmond, VA, USA) were measured with commercially available colorimetric kits. Plasma apelin-12 was measured using an enzyme immunoassay kit (Phoenix Peptide, Burlingame, CA, USA) and validated by serially diluting elephant seal plasma, plotting the concentrations against the standard curve and comparing the slopes of each to confirm parallel dilution. All samples were analyzed in duplicate and run in a single assay with intra-assay percent coefficients of variability of <10% for all assays.
Acylcarnitine profiling
Plasma samples were packaged in dry ice and sent to Case Western Reserve University for comprehensive analyses of acylcarnitines, free carnitine and total acylcarnitine. Carnitine concentrations were determined from 100 μl of plasma using HPLC-MS methods as previously described (Minkler et al., 2005; Minkler et al., 2008; Adams et al., 2009). The limit of detection (LOD) for individual acylcarnitines using this method is 20 nmol l–1, with the exception of acetylcarnitine, propionylcarnitine and valproylcarnitine at 100 nmol l–1. Acylcarnitine species with values below the LOD were not included in further analyses.
Lipase activity
The activity of lipases in plasma and adipose tissue was determined by performing a standard enzyme activity assay we developed for this specific purpose. For adipose, 200 mg of tissue were homogenized in 300 μl of lysis buffer [50 mmol l–1 Tris, 10% glycerol, 1% Triton X-100, 1% protease (Sigma-Aldrich, St Louis, MO, USA) and phosphatase (Thermo Fisher Scientific, Waltham, MA, USA) inhibitor cocktail], spun and the supernatant was collected. Lipase activity in plasma was measured directly without any treatment of sample. First, 50 μl aliquots of plasma and adipose tissue homogenates were added in duplicate to two sets of polystyrene tubes that were pre-chilled in an ice bath. Then, 25 μl of 12 mmol l–1 triglycerides (Novartis, San Carlos, CA, USA) were added to all tubes, keeping both sets of tubes in an ice bath (4°C) during the addition of triglycerides. One set of tubes was then incubated in a 37°C water bath for 1 h to generate NEFAs, after which it was returned to the ice bath. The concentration of NEFAs was determined in both sets of tubes (37 and 4°C) as described above. The values obtained for the 4°C samples were subtracted from those incubated at 37°C to correct for any NEFAs present before the addition of triglycerides. The sensitivity of the assay was determined by the least detectable value following serial dilution of a plasma pool and calculated to be 0.003 mmol NEFA ml–1 min–1.
Calculations
To assess the contributions of adipose tissue and plasma lipase activity to the plasma pool of NEFAs, a series of calculations were conducted using the following parameters. Plasma volume (PV; l) was estimated from age (days) as follows: PV=8.32–0.03×age, using approximate ages of the fasting pups (Thorson, 1993). Total adipose tissue mass was calculated as 45% of the total mass (Rea and Costa, 1992). The baseline plasma NEFA pool was calculated by multiplying the time-0 concentration by the PV. The plasma NEFA pool following glucose administration was calculated by multiplying the area under the curve (AUC) of the NEFA concentration following glucose administration by PV and dividing by 150 min (to account for the duration of the post-administration sampling period). Baseline contributions of plasma and adipose lipase activities to the plasma NEFA pool were determined by multiplying the time-0 values of lipase activities by PV or total adipose tissue mass, respectively, and multiplying the resulting value by 150 min (to allow for comparison to the glucose-administration contributions). The contribution of plasma lipase activity to the change in the plasma NEFA pool following glucose administration was calculated by multiplying PV by the AUC of plasma lipase activity from 0 to 150 min. The contribution of adipose lipase activity to the change in the plasma NEFA pool following glucose administration was calculated by multiplying the total adipose tissue mass by the AUC of adipose tissue lipase activity from 0 to 150 min. Percent uptake of NEFA was calculated by dividing the estimated tissue uptake (=lipase contribution–ΔNEFA pool) by the lipase contribution and multiplying by 100%. For baseline percent uptake, it was assumed that ΔNEFA pool was at equilibrium [i.e. tissue uptake (efflux) was equal to lipase-mediated input (influx)].
Statistics
The baseline (or time-0) measurements (plasma or tissue protein content) of the early- and late-fasted groups were used to assess changes in variables as a function of fasting duration. Means (±s.e.m.) were compared by ANOVA using a Fisher's protected least significant difference (PLSD) post hoc test. Repeated-measures ANOVA was used to determine changes in parameters following glucose administration. Mean (±s.e.m.) AUC was calculated for apelin and lipase activities to determine integrated changes resulting from the early and late glucose administration. Adipose target protein content was normalized by expressing it as percent change versus the early fast mean value, and compared by ANOVA to determine changes in response to the glucose administration. Changes were considered significantly different at P<0.05. Statistical analyses were performed with StatView® software (SAS Institute, Cary, NC, USA).
RESULTS
Effects of fasting on body mass and lipid metabolites
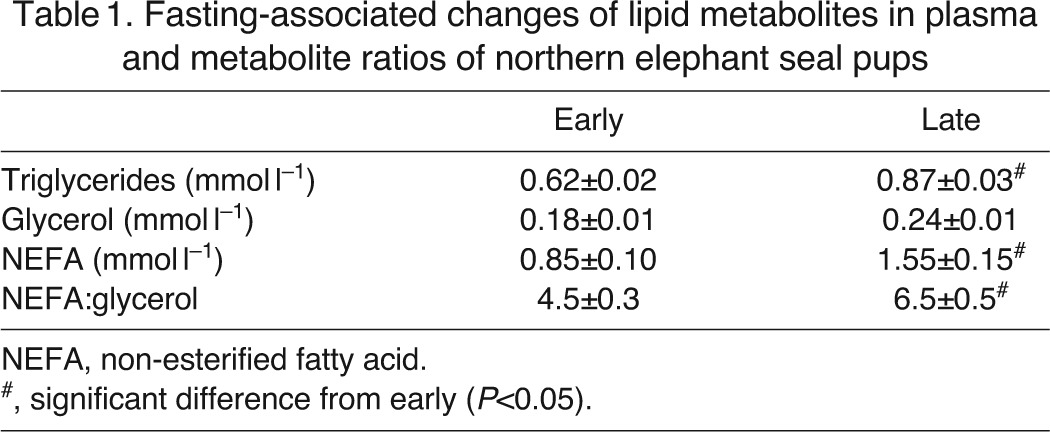
Mean body mass of pups sampled late in the fast was 25% lower than that of pups sampled early in the fast (122±5 versus 92±6 kg). The concentration of plasma triglycerides increased by approximately 39% with fasting (P<0.05; Table 1). The concentration of glycerol did not change as a result of fasting. Fasting was associated with an 82% increase in mean plasma NEFA concentration (P<0.05; Table 1). Fasting increased the ratio of NEFA to glycerol by 44% (P<0.05; Table 1).
Table 1.
Fasting-associated changes of lipid metabolites in plasma and metabolite ratios of northern elephant seal pups
Effects of glucose administration on lipid metabolites
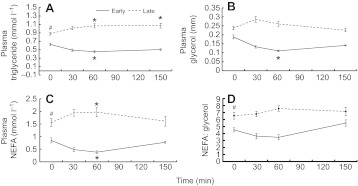
In early-fasted pups, mean plasma triglyceride concentrations decreased by 27% (P<0.05) with glucose administration before returning to pre-ivGTT levels at 150 min, whereas concentrations increased by 22% (P<0.05) in late-fasted pups and remained elevated throughout the measurement period (Fig. 1A). In early-fasted pups, mean plasma glycerol concentrations decreased by 38% (P<0.05) as a result of the glucose administration before returning to basal levels at 150 min (Fig. 1B). Plasma glycerol concentration did not change as a result of the GTT late in the fast (Fig. 1B). Glucose administration decreased mean plasma NEFA by 55% in early-fasted pups (P<0.05) and increased mean plasma NEFA by 27% in late-fasted pups (P<0.05; Fig. 1C). In both periods, mean plasma NEFAs returned to baseline at 150 min (Fig. 1C). The ratio of NEFA to glycerol did not change as a result of the glucose administration during either sampling period (Fig. 1D).
Fig. 1.
Mean (±s.e.m.) (A) plasma triglyceride, (B) plasma glycerol and (C) plasma non-esterified fatty acid (NEFA) concentrations and (D) NEFA:glycerol ratio in plasma of early (2 weeks; N=5) and late (6–8 weeks; N=8) fasted elephant seal pups during the course of the glucose tolerance test. #, significant difference from early (P<0.05); *, significant difference from time 0 (P<0.05).
Lipase activities
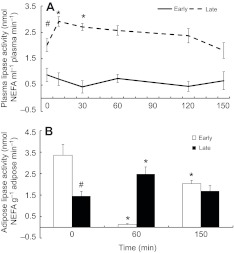
Fasting increased mean plasma lipase activity twofold (0.8±0.2 versus 2.0±0.2 nmol NEFA ml–1 plasma min–1 in early versus late-fasted pups, respectively; P<0.05; Fig. 2A). Mean plasma lipase activity increased by 50% (P<0.05) as a result of the glucose administration in late-fasted animals and returned to basal levels by 150 min; however, the change in lipase activity following the ivGTT was not significant in early fasted animals (Fig. 2A). Mean adipose lipase activity decreased by 50% with fasting (3.4±0.5 versus 1.4±0.2 nmol NEFA g–1 adipose tissue min–1; P<0.05; Fig. 2B). Mean adipose lipase activity levels were suppressed by 99% (P<0.05) as a result of the ivGTT in early-fasted seals and remained 60% lower (P<0.05) than baseline at 150 min (Fig. 2B). Mean adipose lipase activity increased nearly twofold as a result of the ivGTT in late-fasted seals, and returned to baseline at 150 min (Fig. 2B).
Fig. 2.
Mean (±s.e.m.) (A) plasma lipase activity and (B) adipose lipase activity in early (2 weeks; N=5) and late (6–8 weeks; N=8) fasted elephant seal pups during the course of the glucose tolerance test. #, significant difference from early (P<0.05); *, significant difference from time 0 (P<0.05).
Fasting increased the estimated total plasma NEFA pool at baseline and following glucose administration (P<0.05; Table 2). Fasting increased the estimated baseline contribution of plasma lipases to the content of NEFA in circulation twofold, while decreasing that of adipose tissue by 66% (both P<0.05; Table 2). Fasting also increased the estimated ivGTT-induced contribution of plasma lipases nearly fourfold (P<0.05), but not that of adipose lipases (Table 2). The contribution of adipose lipases to the circulating NEFA pool was higher than that of plasma lipases at baseline and following glucose administration early and late in the fast (P<0.05; Table 2). Fasting decreased (P<0.05) the estimated percent NEFA tissue uptake following ivGTT by 26%. Because only a single time point was available to calculate the baseline uptake, it was assumed that baseline lipase contributions were equal to tissue uptake and so the percent contribution was 100% during both periods.
Table 2.
Estimated contributions of lipases to the NEFA pool and estimated percent uptake of NEFA in fasting northern elephant seal pups
Plasma acylcarnitines
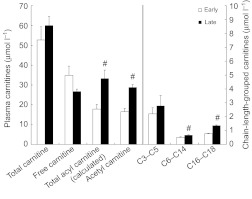
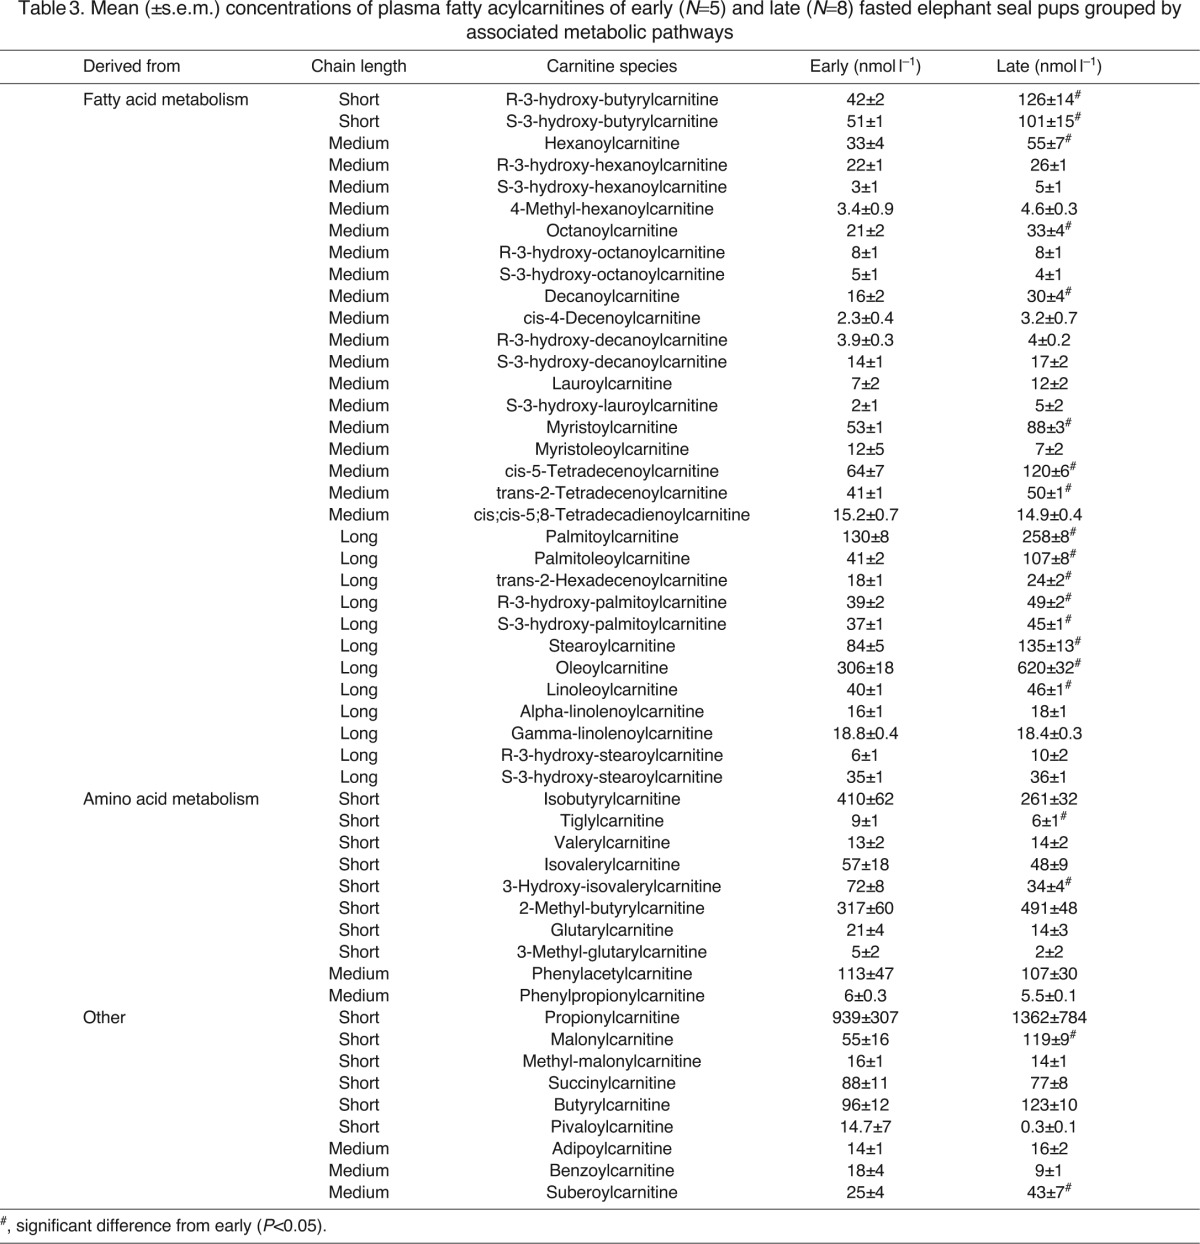
To better understand how long-term fasting and insulin resistance impact the metabolic fates of NEFA in seals, acylcarnitine metabolite profiling was conducted because changes in these molecules typically track alterations in tissue acyl-CoA status (Ramsay and Zammit, 2004). The concentration of total carnitine and free carnitine did not change significantly with fasting; however, the concentration of the calculated total acylcarnitines (Fig. 3) as well as the acyl:free carnitine ratio increased in late-fasted seals (0.51±0.03 versus 1.25±0.18; P<0.05). Acetylcarnitine concentration increased significantly with fasting, and indices of incomplete NEFA β-oxidation (C6–C14 carnitines) were also increased significantly in late-fasted seals. Long-chain acylcarnitine concentrations were also higher in late-fasted animals (Table 3).
Fig. 3.
Mean (±s.e.m.) plasma carnitine concentrations of early (2 weeks; N=5) and late (6–8 weeks; N=8) fasted elephant seal pups. Chain-length-grouped acylcarnitines are presented on a secondary axis for clarity. #, significant change with fasting (P<0.05).
Table 3.
Mean (±s.e.m.) concentrations of plasma fatty acylcarnitines of early (N=5) and late (N=8) fasted elephant seal pups grouped by associated metabolic pathways
Plasma apelin
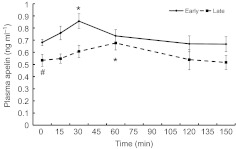
The concentration of baseline plasma apelin decreased by 22% with fasting (0.68±0.02 versus 0.53±0.04 ng ml–1; P<0.05; Fig. 4). In response to glucose administration, mean plasma apelin increased by 25% (P<0.05) at 30 min in the early-fasted pups and by 19% (P<0.05) at 60 min in the late-fasted pups before returning to baseline levels at 120 min in both periods (Fig. 4). Plasma apelin AUC did not change significantly as a result of fasting (118±13 versus 97±11 ng ml–1 min–1).
Fig. 4.
Mean (±s.e.m.) plasma apelin concentration of early (2 weeks; N=5) and late (6–8 weeks; N=8) fasted elephant seal pups during the course of the glucose tolerance test. #, significant difference from early (P<0.05); *, significant difference from time 0 (P<0.05).
Effects of fasting on adipose protein contents
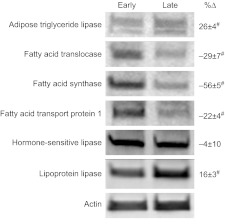
Fasting increased the adipose tissue contents of ATGL (26%) and LPL (16%) and decreased the adipose tissue contents of CD36 (29%), FAS (56%), FATP1 (22%) and PEPCK-C (43%) (all P<0.05; Figs 5, 6). Fasting did not change the content of CPT I, CPT II or HSL (Figs 5, 7).
Fig. 5.
Representative western blots and mean (±s.e.m.) percent changes of proteins measured in adipose tissue of early (2 weeks; N=5) versus late (6–8 weeks; N=8) fasted elephant seal pups. #, significant change with fasting (P<0.05).
Fig. 6.
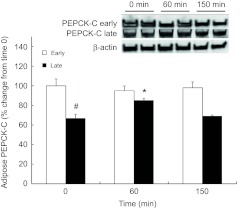
Mean (±s.e.m.) percent change of phosphoenol-pyruvate carboxy kinase protein (PEPCK-C) in adipose tissue of early (2 weeks; N=5) and late (6–8 weeks; N=8) fasted elephant seal pups during the course of the glucose tolerance test and their representative western blots. #, significant difference from early (P<0.05); *, significant difference from time 0 (P<0.05).
Fig. 7.
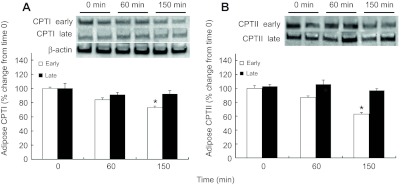
Mean (±s.e.m.) percent change of (A) carnitine palmitoyl transferase I (CPTI) and (B) carnitine palmitoyl transferase II (CPTII) in adipose tissue of early (2 weeks; N=5) and late (6–8 weeks; N=8) fasted elephant seal pups during the course of the glucose tolerance test and their representative western blots. *, significant difference from time 0 (P<0.05).
Effects of glucose administration on adipose protein contents
Although the adipose protein content of PEPCK-C did not change with glucose administration in early-fasted pups, it increased by 18% (P<0.05) at 60 min and returned to pre-ivGTT levels by 150 min in late-fasted pups (Fig. 6). In contrast, the adipose protein contents of CPTI and CPTII did not change with the late ivGTT, but both decreased, by 27 and 36%, respectively, at 150 min with the early ivGTT (P<0.05; Fig. 7A,B). Over the course of the 150 min measurement period of the glucose administrations during both the early and late fasting periods, the adipose protein contents of ATGL, CD36, FAS, FATP1, HSL and LPL did not change.
DISCUSSION
For mammals that undergo prolonged periods of absolute food deprivation, such as the elephant seal, the onset of insulin resistance may be an adaptive biological response to fasting. Reduced peripheral glucose uptake and increased concentration of NEFA in circulation, typically associated with insulin resistance (Golay et al., 1987; Van Epps-Fung et al., 1997; Perseghin et al., 2003; Karpe and Tan, 2005; Leney and Tavaré, 2009), allow greater availability of glucose and ketone bodies to specific tissues that display limited metabolism of lipids (e.g. the central nervous system, red blood cells, etc.), decreasing the need for gluconeogenesis from amino acids. Interestingly, elephant seals maintain rates of glucose production and use more glucose than expected for an animal enduring such a prolonged fast (Champagne et al., 2005). The present study suggests that northern elephant seal pups possess robust mechanisms to regulate circulating lipids, a characteristic that may not be shared by other seals; for example, fasting duration decreases NEFA concentration in grey and hooded seal pups (Iverson et al., 1995; Mellish et al., 1999). These mechanisms may include decreasing the expression of CD36 and FATP1 and increasing the expression of ATGL in adipose tissue. Collectively, these mechanisms may reduce adipose NEFA uptake while promoting regulated triglyceride hydrolysis. This shift in the regulation of adipose lipid stores may explain how the elephant seal pup is able to maintain elevated concentrations of NEFA for such a protracted period in spite of the increasing energetic demands associated with development during their post-weaning fast.
We have previously shown that, based on plasma glucose dynamics, elephant seal pups are sensitive to insulin at the beginning of their fast and develop glucose intolerance after several weeks of fasting (Viscarra et al., 2011b). The lipid profiles exhibited by early-fasted seals in response to an ivGTT support this observation, as they appear to be those of a healthy insulin-sensitive mammal (Horowitz et al., 1997; Campbell et al., 1992): glucose administration increases plasma insulin (Viscarra et al., 2011b) and decreases circulating lipids by decreasing adipose lipase activity (Campbell et al., 1992). In addition to insulin, a glucose-induced increase in plasma apelin likely contributes to the inhibition of adipose lipase activity (Yue et al., 2011). A major finding of the current study was that in contrast to early-fasted pups, ivGTT failed to reduce circulating triglycerides and NEFAs in glucose-intolerant late-fasted pups, and in fact modestly, but significantly, increased concentrations of the latter. The basis for this response remains to be fully elucidated, but could involve a lower ivGTT-induced inhibition of lipolysis and/or differences in tissue NEFA uptake.
The observed decline in adipose expression of the fatty acid transporters CD36 and FATP1 in late-fasted pups could have contributed to reduced uptake of NEFAs into adipocytes (Coburn et al., 2000), and could partially explain the increase in circulating levels. The calculated tissue NEFA uptake during the late glucose challenge agrees with this finding, as it amounted to only 74% of NEFA uptake during the early glucose challenge. This suggests a reduction in NEFA uptake by all tissues in late-fasted seals, as the reduction in uptake would be negligible if only adipose tissue was affected (Furler et al., 2000). Furthermore, the total baseline contribution of lipase activity to plasma NEFA content decreased in late-fasted elephant seal pups. This suggests a decrease in lipolysis like that observed in grey and hooded seal pups after a few days of fasting. However, the decrease in lipolysis in grey and hooded seal pups was accompanied by an expected decrease in plasma NEFA (Iverson et al., 1995; Mellish et al., 1999), not an increase as seen in elephant seal pups. It is possible that other seals may not experience similar reductions in NEFA uptake with fasting duration as that seen in elephant seal pups. This also hints at differential regulation of plasma NEFA between different seal species, which may involve changes in protein expression and some threshold limit for fasting duration.
The increase in total acylcarnitine concentration in plasma as well as that of the acyl:free carnitine ratio demonstrates increased accumulation of fatty acylcarnitines in plasma of late-fasted seals, and provides evidence for a higher degree of incomplete β-oxidation in late-fasted insulin-resistant pups. The current detailed acylcarnitine profiling concurs with a prior study in fasting elephant seal pups that described only free and total acylated carnitine in which it was reported that the plasma acyl:free carnitine ratio rose toward the end of the fasting period, suggestive of a temporal change in the dynamics of mitochondrial β-oxidation during fasting in this species (Adams et al., 1992). The concentrations of acylcarnitines in plasma parallel the accumulation of acyl-CoAs at the tissue level (Ramsay and Zammit, 2004), and so the changes and patterns observed in acylcarnitines are representative of the changes in tissue acyl-CoA pools. For instance, increased plasma long-chain fatty acylcarnitines were seen in late-fasted seals concurrent with higher NEFA concentrations and long-chain acyl-CoA generation. In addition, the higher 3-hydroxybutyrylcarnitine concentration in late-fasted seals is consistent with the greater levels of ketone bodies reported for these animals (Castellini et al., 1987).
Acetylcarnitine, which nearly doubled in late-fasted seals, made up the majority of the acylcarnitines in plasma and increased concentrations were coincident with higher levels of medium-chain fatty acid acylcarnitine derivatives. This pattern is reminiscent of what is seen in insulin-resistant rodent models (e.g. Koves et al., 2008) and in human type 2 diabetics (Adams et al., 2009). Such a pattern is thought to result from a mismatch between increased mitochondrial NEFA fuel delivery relative to tricarboxylic acid (TCA) cycle activity. The origins of this mismatch are not yet resolved, but it has been hypothesized that decreased complete catabolism of branched-chain amino acids and reduced entry of anaplerotic carbon into the TCA cycle in the insulin-resistant state may contribute (Adams, 2011). Previous findings demonstrated a reduction in protein catabolism in late-fasted northern elephant seals (Adams and Costa, 1993). Patterns of acylcarnitine derivatives in the present study appeared to support this, as the acylcarnitines associated with lipid metabolism increased whereas those associated with amino acid catabolism decreased.
Similar to what is seen in grey seal, hooded seal and northern fur seal pups (Iverson et al., 1995; Mellish et al., 1999; Mellish and Loughlin, 2003), plasma lipase activity increases with fasting in northern elephant seal pups. This phenomenon may be exclusive to fasting seal pups because lipase expression decreases with age in skeletal muscle of Weddell seals (Kanatous et al., 2008) and LPL activity decreases in blubber and mammary tissue of lactating adult female northern elephant seals (McDonald and Crocker, 2006). Despite the increased activity of plasma lipases (e.g. LPL, hepatic lipase, pancreatic lipase) and reduced activity of adipose lipases, the calculations show that the majority of lipolysis still occurs in adipose tissue. There is a lack of a change in plasma glycerol and twofold increase in the NEFA:glycerol ratio in late-fasted seals during the glucose challenge that seems to disagree with the maintenance of adipose lipolysis (Naito and Okada, 1975; Gruen et al., 1980; Anthony et al., 2009; Gaidhu and Ceddia, 2011). However, chronic AMPK activation in adipose tissue (Viscarra et al., 2011b) may have inhibited the complete hydrolysis of triglycerides, leading to a disconnect in the relationship between plasma NEFA and glycerol. In late-fasted seals, the increased expression of ATGL supports this suggestion because ATGL only partially hydrolyzes triglycerides to generate one NEFA and one diacylglycerol, while inhibiting HSL-induced lipolysis (Gaidhu et al., 2010; Bertile and Raclot, 2011). Inhibition of the complete hydrolysis of triglycerides could also explain the lack of a significant contribution of glycerol to gluconeogenesis during the fast in adult, lactating elephant seals (Houser et al., 2007). Preventing the shuttling of glycerol into the gluconeogenic pathway would allow the re-esterification of NEFAs, and thus maintenance of both adipose and plasma lipid substrates (e.g. triglycerides and NEFAs) required to support the energetic demands of fasting, developing pups.
A survey of metabolically important enzymes further highlights the concept that in long-term fasted seal pups, adipose tissue acts as a critical NEFA supplier while downregulating its capacity for NEFA storage. For instance, decreased expression of FAS in adipose tissue of late-fasted seals suggests that de novo fatty acid synthesis is minimized in adipose tissue, although the rise in malonylcarnitine might signal an increase in hepatic fatty acid synthesis in late-fasted seals (Wakil, 1961; Robinson et al., 1963; Alberts et al., 1964). Because PEPCK-C expression is associated with glyceroneogenesis (Reshef et al., 2003), the decreased expression of adipose PEPCK-C with fasting suggests that NEFA re-esterification is decreased, which may further contribute to increased plasma NEFA concentrations. However, increased PEPCK-C at 60 min during the late glucose challenge, which could have resulted from the suppression of plasma cortisol (Viscarra et al., 2011b), suggests that NEFA re-esterification is increased in adipose tissue in response to the glucose administration (Reshef et al., 2003). Increased PEPCK-C in response to the late-fasting GTT may restore adipose triglyceride content following the glucose-induced increase in adipose lipase activity, because PEPCK-C expression returns to pre-GTT levels by 150 min. Thus, the mechanisms contributing to the increase in plasma NEFAs in late-fasted seals involve a well-regulated series of events that includes: (1) increased plasma lipase activity, (2) increased expression of adipose ATGL, (3) decreased expression of adipose CD36 and FATP1, resulting in reduced NEFA uptake, (4) increased secretion of adipose LPL and (5) decreased PEPCK-C protein content (Table 4).
Table 4.
Summary of the effect of long-term fasting on measured parameters and potential effects on plasma NEFA in northern elephant seal pups
In conclusion, the present study suggests that a metabolism that increasingly relies on lipid oxidation may contribute to the fasting-induced insulin resistance (Viscarra et al., 2011b). The fasting-induced decrease in plasma apelin suggests that its role in the inhibition of cellular lipolysis in late-fasted seals is decreased as a mechanism to sustain lipolysis during the prolonged fast. The differential response of apelin to the glucose administration suggests that its sensitivity is altered with fasting duration. The increased plasma acetylcarnitine coupled to higher concentrations of medium-chain acylcarnitines in late-fasted seal pups suggests that a mismatch of NEFAs and TCA cycle capacity elicits incomplete β-oxidation that accompanies worsened glucose tolerance and insulin resistance. The gradual shift in the regulation of lipase activity during the course of the fast reduces the rate at which adipose triglyceride stores are depleted. Additionally, the decreased expression of CD36, FATP1 and PEPCK are likely required for this transition so as to maintain the increased concentration of plasma NEFAs, resulting in reduced peripheral uptake of NEFAs from circulation. More work is required to identify exactly how the aforementioned mechanisms are regulated. However, this study presents an initial description of the adaptive mechanisms responsible for the onset of fasting-induced insulin resistance in a large mammal adapted to prolonged food deprivation.
ACKNOWLEDGEMENTS
We would like to thank Dr D. P. Costa (UCSC) for providing laboratory space. We also thank A. Lee, J. Minas and M. Thorwald for their assistance in the field and with laboratory analyses, and Año Nuevo State Park for logistic support of this work. The authors are grateful to Dr C. Hoppel and M. Stoll (Case Western Reserve University) for analysis of acylcarnitines. USDA is an equal opportunity provider and employer.
LIST OF ABBREVIATIONS
- AMPK
adenosine monophosphate kinase
- ATGL
adipose tissue triglyceride lipase
- CD36
fatty acid translocase
- CPTI/II
carnitine palmitoyl transferase
- FAS
fatty acid synthase
- FATP1
fatty acid transport protein 1
- HSL
hormone sensitive lipase
- ivGTT
intravenous glucose tolerance test
- LPL
lipoprotein lipase
- NEFA
non-esterified fatty acid
- PEPCK-C
phosphoenolpyruvate carboxy kinase (cytosolic)
FOOTNOTES
FUNDING
This research was funded by the National Heart Lung and Blood Institute [NIH NHLBI HL091767 to R.M.O. and D.E.C.; NIH NHLBI HL091767-S1 to R.M.O.; and NIH NHLBI K02HL103787 to R.M.O.], the US Department of Agriculture Agricultural Research Service Intramural Project [5306-51530-019-00 to S.H.A.] and the National Institute of Diabetes and Digestive and Kidney Diseases [NIH-NIDDK R01DK078328-01 and R01DK078328-02S1 to S.H.A.]. Deposited in PMC for release after 12 months.
REFERENCES
- Adams S. H. (2011). Emerging perspectives on essential amino acid metabolism in obesity and the insulin-resistant state. Adv. Nutr. 2, 445-456 [DOI] [PMC free article] [PubMed] [Google Scholar]
- Adams S. H., Costa D. P. (1993). Water conservation and protein metabolism in northern elephant seal pups during the postweaning fast. J. Comp. Physiol. B 163, 367-373 [DOI] [PubMed] [Google Scholar]
- Adams S. H., Costa D. P., Winter S. C. (1992). Plasma carnitine in fasting neonatal and adult northern elephant seals. Am. J. Physiol. 263, E570-E574 [DOI] [PubMed] [Google Scholar]
- Adams S. H., Hoppel C. L., Lok K. H., Zhao L., Wong S. W., Minkler P. E., Hwang D. H., Newman J. W., Garvey W. T. (2009). Plasma acylcarnitine profiles suggest incomplete long-chain fatty acid β-oxidation and altered tricarboxylic acid cycle activity in type 2 diabetic African-American women. J. Nutr. 139, 1073-1081 [DOI] [PMC free article] [PubMed] [Google Scholar]
- Alberts A. W., Majerus P. W., Talamo B., Vagelos P. R. (1964). Acyl-carrier protein. II. Intermediary reactions of fatty acid synthesis. Biochemistry 3, 1563-1571 [DOI] [PubMed] [Google Scholar]
- Anthony N. M., Gaidhu M. P., Ceddia R. B. (2009). Regulation of visceral and subcutaneous adipocyte lipolysis by acute AICAR-induced AMPK activation. Obesity 17, 1312-1317 [DOI] [PubMed] [Google Scholar]
- Bertile F., Raclot T. (2011). ATGL and HSL are not coordinately regulated in response to fuel partitioning in fasted rats. J. Nutr. Biochem. 22, 372-379 [DOI] [PubMed] [Google Scholar]
- Campbell P. J., Carlson M. G., Hill J. O., Nurjhan N. (1992). Regulation of free fatty acid metabolism by insulin in humans: role of lipolysis and reesterification. Am. J. Physiol. 263, E1063-E1069 [DOI] [PubMed] [Google Scholar]
- Castellini M. A., Costa D. P., Huntley A. C. (1987). Fatty acid metabolism in fasting elephant seal pups. J. Comp. Physiol. B 157, 445-449 [DOI] [PubMed] [Google Scholar]
- Champagne C. D., Houser D. S., Crocker D. E. (2005). Glucose production and substrate cycle activity in a fasting adapted animal, the northern elephant seal. J. Exp. Biol. 208, 859-868 [DOI] [PubMed] [Google Scholar]
- Chaves V. E., Frasson D., Kawashita N. H. (2011). Several agents and pathways regulate lipolysis in adipocytes. Biochimie 93, 1631-1640 [DOI] [PubMed] [Google Scholar]
- Chen X., Yu Q. Q., Zhu Y. H., Bi Y., Sun W. P., Liang H., Cai M. Y., He X. Y., Weng J. P. (2010). Insulin therapy stimulates lipid synthesis and improves endocrine functions of adipocytes in dietary obese C57BL/6 mice. Acta Pharmacol. Sin. 31, 341-346 [DOI] [PMC free article] [PubMed] [Google Scholar]
- Choi S. M., Tucker D. F., Gross D. N., Easton R. M., DiPilato L. M., Dean A. S., Monks B. R., Birnbaum M. J. (2010). Insulin regulates adipocyte lipolysis via an Akt-independent signaling pathway. Mol. Cell. Biol. 30, 5009-5020 [DOI] [PMC free article] [PubMed] [Google Scholar]
- Coburn C. T., Knapp F. F., Jr, Febbraio M., Beets A. L., Silverstein R. L., Abumrad N. A. (2000). Defective uptake and utilization of long chain fatty acids in muscle and adipose tissues of CD36 knockout mice. J. Biol. Chem. 275, 32523-32529 [DOI] [PubMed] [Google Scholar]
- Costa D. P., Ortiz C. L. (1982). Blood chemistry homeostasis during prolonged fasting in the northern elephant seal. Am. J. Physiol. 242, R591-R595 [DOI] [PubMed] [Google Scholar]
- Doh K.-O., Kim Y.-W., Park S.-Y., Lee S.-K., Park J. S., Kim J.-Y. (2005). Interrelation between long-chain fatty acid oxidation rate and carnitine palmitoyltransferase 1 activity with different isoforms in rat tissues. Life Sci. 77, 435-443 [DOI] [PubMed] [Google Scholar]
- Furler S. M., Cooney G. J., Hegarty B. D., Lim-Fraser M. Y., Kraegen E. W., Oakes N. D. (2000). Local factors modulate tissue-specific NEFA utilization: assessment in rats using 3H-(R)-2-bromopalmitate. Diabetes 49, 1427-1433 [DOI] [PubMed] [Google Scholar]
- Gaidhu M. P., Ceddia R. B. (2011). The role of adenosine monophosphate kinase in remodeling white adipose tissue metabolism. Exerc. Sport Sci. Rev. 39, 102-108 [DOI] [PubMed] [Google Scholar]
- Gaidhu M. P., Anthony N. M., Patel P., Hawke T. J., Ceddia R. B. (2010). Dysregulation of lipolysis and lipid metabolism in visceral and subcutaneous adipocytes by high-fat diet: role of ATGL, HSL, and AMPK. Am. J. Physiol. Cell Physiol. 298, C961-C971 [DOI] [PubMed] [Google Scholar]
- Gertow K., Pietiläinen K. H., Yki-Järvinen H., Kaprio J., Rissanen A., Eriksson P., Hamsten A., Fisher R. M. (2004). Expression of fatty-acid-handling proteins in human adipose tissue in relation to obesity and insulin resistance. Diabetologia 47, 1118-1125 [DOI] [PubMed] [Google Scholar]
- Golay A., Swislocki A. L. M., Chen Y. D., Reaven G. M. (1987). Relationships between plasma-free fatty acid concentration, endogenous glucose production, and fasting hyperglycemia in normal and non-insulin-dependent diabetic individuals. Metabolism 36, 692-696 [DOI] [PubMed] [Google Scholar]
- Gruen R., Kava R., Greenwood M. R. C. (1980). Development of basal lipolysis and fat cell size in the epididymal fat pad of normal rats. Metabolism 29, 246-253 [DOI] [PubMed] [Google Scholar]
- Holland R., Hardie D. G. (1985). Both insulin and epidermal growth factor stimulate fatty acid synthesis and increase phosphorylation of acetyl-CoA carboxylase and ATP-citrate lyase in isolated hepatocytes. FEBS Lett. 181, 308-312 [DOI] [PubMed] [Google Scholar]
- Horowitz J. F., Mora-Rodriguez R., Byerley L. O., Coyle E. F. (1997). Lipolytic suppression following carbohydrate ingestion limits fat oxidation during exercise. Am. J. Physiol. 273, E768-E775 [DOI] [PubMed] [Google Scholar]
- Houser D. S., Champagne C. D., Crocker D. E. (2007). Lipolysis and glycerol gluconeogenesis in simultaneously fasting and lactating northern elephant seals. Am. J. Physiol. Regul. Integr. Comp. Physiol. 293, R2376-R2381 [DOI] [PubMed] [Google Scholar]
- Iverson S. J., Hamosh M., Bowen W. D. (1995). Lipoprotein lipase activity and its relationship to high milk fat transfer during lactation in grey seals. J. Comp. Physiol. B 165, 384-395 [DOI] [PubMed] [Google Scholar]
- Kanatous S. B., Hawke T. J., Trumble S. J., Pearson L. E., Watson R. R., Garry D. J., Williams T. M., Davis R. W. (2008). The ontogeny of aerobic and diving capacity in the skeletal muscles of Weddell seals. J. Exp. Biol. 211, 2559-2565 [DOI] [PubMed] [Google Scholar]
- Karpe F., Tan G. D. (2005). Adipose tissue function in the insulin-resistance syndrome. Biochem. Soc. Trans. 33, 1045-1048 [DOI] [PubMed] [Google Scholar]
- Knutson V. P. (2000). The release of lipoprotein lipase from 3T3-L1 adipocytes is regulated by microvessel endothelial cells in an insulin-dependent manner. Endocrinology 141, 693-701 [DOI] [PubMed] [Google Scholar]
- Koves T. R., Ussher J. R., Noland R. C., Slentz D., Mosedale M., Ilkayeva O., Bain J., Stevens R., Dyck J. R. B., Newgard C. B., et al. (2008). Mitochondrial overload and incomplete fatty acid oxidation contribute to skeletal muscle insulin resistance. Cell Metab. 7, 45-56 [DOI] [PubMed] [Google Scholar]
- Leney S. E., Tavaré J. M. (2009). The molecular basis of insulin-stimulated glucose uptake: signalling, trafficking and potential drug targets. J. Endocrinol. 203, 1-18 [DOI] [PubMed] [Google Scholar]
- McDonald B. I., Crocker D. E. (2006). Physiology and behavior influence lactation efficiency in northern elephant seals (Mirounga angustirostris). Physiol. Biochem. Zool. 79, 484-496 [DOI] [PubMed] [Google Scholar]
- Mellish J. E., Loughlin T. R. (2003). Lipoprotein lipase in lactating and neonatal northern fur seals: exploring physiological management of energetic conflicts. Comp. Biochem. Physiol. 134A, 147-156 [DOI] [PubMed] [Google Scholar]
- Mellish J. E., Iverson S. J., Bowen W. D., Hammill M. O. (1999). Fat transfer and energetics during lactation in the hooded seal: the roles of tissue lipoprotein lipase in milk fat secretion and pup blubber deposition. J. Comp. Physiol. B 169, 377-390 [DOI] [PubMed] [Google Scholar]
- Minkler P. E., Ingalls S. T., Hoppel C. L. (2005). Strategy for the isolation, derivatization, chromatographic separation, and detection of carnitine and acylcarnitines. Anal. Chem. 77, 1448-1457 [DOI] [PubMed] [Google Scholar]
- Minkler P. E., Stoll M. S. K., Ingalls S. T., Yang S., Kerner J., Hoppel C. L. (2008). Quantification of carnitine and acylcarnitines in biological matrices by HPLC electrospray ionization-mass spectrometry. Clin. Chem. 54, 1451-1462 [DOI] [PubMed] [Google Scholar]
- Naito C., Okada K. (1975). Effect of glucose on lipolysis and on release of lipolytic products in isolated adipocytes. Am. J. Physiol. Leg. Content 228, 92-97 [DOI] [PubMed] [Google Scholar]
- Ong J. M., Kern P. A. (1989). The role of glucose and glycosylation in the regulation of lipoprotein lipase synthesis and secretion in rat adipocytes. J. Biol. Chem. 264, 3177-3182 [PubMed] [Google Scholar]
- Ortiz C. L., Costa D. P., Le Boeuf B. J. (1978). Water and energy flux in elephant seal pups fasting under natural conditions. Physiol. Zool. 51, 166-178 [Google Scholar]
- Ortiz C. L., Le Boeuf B. J., Costa D. P. (1984). Milk intake of elephant seal pups: an index of parental investment. Am. Nat. 124, 416-422 [Google Scholar]
- Ortiz R. M., Wade C. E., Ortiz C. L. (2001). Effects of prolonged fasting on plasma cortisol and TH in postweaned northern elephant seal pups. Am. J. Physiol. Regul. Integr. Comp. Physiol. 280, R790-R795 [DOI] [PubMed] [Google Scholar]
- Ortiz R. M., Wade C. E., Ortiz C. L. (2003). Body water handling in response to hypertonic-saline induced diuresis in fasting northern elephant seal pups (Mirounga angustirostris). Comp. Biochem. Physiol. 134A, 423-428 [DOI] [PubMed] [Google Scholar]
- Patterson-Buckendahl P., Adams S. H., Morales R., Jee W. S. S., Cann C. E., Ortiz C. L. (1994). Skeletal development in newborn and weanling northern elephant seals. Am. J. Physiol. Regul. Integr. Comp. Physiol. 267, R726-R734 [DOI] [PubMed] [Google Scholar]
- Perseghin G., Petersen K., Shulman G. I. (2003). Cellular mechanism of insulin resistance: potential links with inflammation. Int. J. Obes. Relat. Metab. Disord. 27 Suppl. 3, S6-S11 [DOI] [PubMed] [Google Scholar]
- Ramsay R. R., Zammit V. A. (2004). Carnitine acyltransferases and their influence on CoA pools in health and disease. Mol. Aspects Med. 25, 475-493 [DOI] [PubMed] [Google Scholar]
- Rea L. D., Costa D. P. (1992). Changes in standard metabolism during long-term fasting in northern elephant seal pups (Mirounga angustirostris). Physiol. Zool. 65, 97-111 [Google Scholar]
- Reiter J., Stinson N. L., Boeuf B. J. (1978). Northern elephant seal development: the transition from weaning to nutritional independence. Behav. Ecol. Sociobiol. 3, 337-367 [Google Scholar]
- Reshef L., Olswang Y., Cassuto H., Blum B., Croniger C. M., Kalhan S. C., Tilghman S. M., Hanson R. W. (2003). Glyceroneogenesis and the triglyceride/fatty acid cycle. J. Biol. Chem. 278, 30413-30416 [DOI] [PubMed] [Google Scholar]
- Riedman M., Ortiz C. L. (1978). Changes in the milk composition during lactation in the northern elephant seal. Physiol. Zool. 52, 240-249 [Google Scholar]
- Robinson J. D., Bradley R. M., Brady R. O. (1963). The utilization of substituted acyl-coenzyme a derivatives in fatty acid synthesis. II. Studies with enzymes obtained from adipose tissue. Biochemistry 2, 191-194 [Google Scholar]
- Schwenk R. W., Holloway G. P., Luiken J. J. F. P., Bonen A., Glatz J. F. C. (2010). Fatty acid transport across the cell membrane: regulation by fatty acid transporters. Prostaglandins Leukot. Essent. Fatty Acids 82, 149-154 [DOI] [PubMed] [Google Scholar]
- Thorson P. H. (1993). Development of diving in the northern elephant seal. PhD dissertation, University of California; Santa Cruz: [Google Scholar]
- Tift M. S., Houser D. S., Crocker D. E. (2011). High-density lipoprotein remains elevated despite reductions in total cholesterol in fasting adult male elephant seals (Mirounga angustirostris). Comp. Biochem. Physiol. 159B, 214-219 [DOI] [PubMed] [Google Scholar]
- Van Epps-Fung M., Williford J., Wells A., Hardy R. W. (1997). Fatty acid-induced insulin resistance in adipocytes. Endocrinology 138, 4338-4345 [DOI] [PubMed] [Google Scholar]
- Vannier C., Ailhaud G. (1989). Biosynthesis of lipoprotein lipase in cultured mouse adipocytes. II. Processing, subunit assembly, and intracellular transport. J. Biol. Chem. 264, 13206-13216 [PubMed] [Google Scholar]
- Viscarra J. A., Vázquez-Medina J. P., Crocker D. E., Ortiz R. M. (2011a). Glut4 is upregulated despite decreased insulin signaling during prolonged fasting in northern elephant seal pups. Am. J. Physiol. Regul. Integr. Comp. Physiol. 300, R150-R154 [DOI] [PMC free article] [PubMed] [Google Scholar]
- Viscarra J. A., Champagne C. D., Crocker D. E., Ortiz R. M. (2011b). 5′AMP-activated protein kinase activity is increased in adipose tissue of northern elephant seal pups during prolonged fasting-induced insulin resistance. J. Endocrinol. 209, 317-325 [DOI] [PMC free article] [PubMed] [Google Scholar]
- Wakil S. J. (1961). Mechanism of fatty acid synthesis. J. Lipid Res. 2, 1-24 [Google Scholar]
- Yue P., Jin H., Aillaud M., Deng A. C., Azuma J., Asagami T., Kundu R. K., Reaven G. M., Quertermous T., Tsao P. S. (2010). Apelin is necessary for the maintenance of insulin sensitivity. Am. J. Physiol. Endocrinol. Metab. 298, E59-E67 [DOI] [PMC free article] [PubMed] [Google Scholar]
- Yue P., Jin H., Xu S., Aillaud M., Deng A. C., Azuma J., Kundu R. K., Reaven G. M., Quertermous T., Tsao P. S. (2011). Apelin decreases lipolysis via Gq, Gi, and AMPK-dependent mechanisms. Endocrinology 152, 59-68 [DOI] [PMC free article] [PubMed] [Google Scholar]


