

Abstract
Several mathematical models of epidemic cholera have recently been proposed in response to outbreaks in Zimbabwe and Haiti. These models aim to estimate the dynamics of cholera transmission and the impact of possible interventions, with a goal of providing guidance to policy-makers in deciding among alternative courses of action, including vaccination, provision of clean water, and antibiotics. Here we discuss concerns about model misspecification, parameter uncertainty, and spatial heterogeneity intrinsic to models for cholera. We argue for caution in interpreting quantitative predictions, particularly predictions of the effectiveness of interventions. We specify sensitivity analyses that would be necessary to improve confidence in model-based quantitative prediction, and suggest types of monitoring in future epidemic settings that would improve analysis and prediction.
The recent cholera epidemic in Zimbabwe (2008-2009) and the ongoing cholera epidemic in Haiti (2010-2011) are catastrophes in two regions already devastated by disease and poverty. The extent of these disasters has prompted inquiries into whether interventions – such as vaccination, antibiotic administration, and the provision of clean water – could have slowed or aborted these cholera epidemics, and how such interventions might be most effectively implemented in future epidemics. Cholera spreads in areas with poor sanitation and through contaminated water, and the ideal solution is to improve infrastructure to provide clean water and effective sanitation -- an approach that has been successful since the 19th century.1 On the timescale of an epidemic, creation of such infrastructure is rarely feasible. Administration of vaccine, a staple of preventive medicine, is one of the few potentially life-saving and implementable solutions.2-8 However, vaccines remain untested in epidemic cholera.
Decisions regarding whether and how to pursue mass vaccination during epidemic cholera present logistical and policy challenges. Ideally, all lifesaving interventions should be employed, but, in practice, policy makers often have to choose among possible interventions, as well as among strategies for deploying these interventions.
Mathematical models of disease transmission aim to provide guidance in making such decisions. Models can estimate key parameters such as R0 (the basic reproductive number, referring to the number of infectious cases caused by an average infectious person in an otherwise entirely susceptible population), and the impact of control strategies. Toward this end, several recent models based on data from the cholera epidemics in Haiti and Zimbabwe have been published.3-7
All models are limited by their simplifying assumptions. It is important to critically evaluate cholera models and their assumptions, so as to gauge the strength of their conclusions. Here, we examine the assumptions implicit in mathematical models of cholera, and the ways these models have been applied to data from Haiti and Zimbabwe. We discuss the impact of model misspecification, parameter uncertainty, and spatial heterogeneity, and explore specifically the impact of the unknown lifespan of cholera vibrios in water reservoirs. We discuss why these criticisms -- potentially applicable to many infectious disease modeling efforts -- are particularly germane to cholera models. Our goal is neither to compare models directly nor to critique each model individually, but to explore the general issues that confront cholera modeling efforts.
Cholera transmission model misspecification and parameter uncertainty
Cholera transmission depends on excretion of Vibrio cholerae by infected persons and on ingestion of vibrios in contaminated food or water. In endemic situations, cholera transmission is influenced by complex factors including multiple co-circulating strains, local immunity from past outbreaks,9 weather cycles (both seasonal and climatic oscillations 10-12), and phage that destroy V. cholerae.13 In epidemic outbreaks in susceptible populations, many of these factors are ignored; models assume a single infecting strain, an entirely susceptible population, and a short time scale for the epidemic such that climatic and phage-cholera relationships can be neglected. The rate at which cholera vibrios are excreted depends on the severity of infection, which ranges from asymptomatic infection to cholera gravis (0.5-1L of diarrhea an hour 14), and the extent to which food and water supplies are contaminated by sewage.
In 2001, Codeço 15 proposed a model that aims to capture transmission within a community and is a predecessor of several recent models.3,4,6,16 While this model was explicitly designed for simplicity and qualitative analysis (rather than for quantitative prediction), it provides a convenient framework to illustrate concerns that frequently arise in cholera models. A simplified version of the model is:
S, I, and R represent the number of susceptible, infected, and recovered persons, respectively, with a total population N = S+I+R; B represents the concentration of Vibrio cholerae in the water reservoir used by this population. Key parameters include those influenced by specific local geographic, aquatic, socioeconomic, and behavioral characteristics and others that reflect the biology of Vibrio cholerae and clinical disease. We discuss below the issues of model misspecification (in which the item modeled differs from the item of interest) and parameter uncertainty (in which the true values of the parameters are difficult or impossible to estimate accurately, as they pertain to this cholera model). The model parameters include
β, the rate at which each of the N persons contacts contaminated water from the reservoir (units: day-1). This is an abstract concept that in the context of this model must be related to the amount of reservoir water consumed, but is not expressed in units that include volume and has no upper or lower bounds.
ξ, the rate that describes how much an infected person contributes to the concentration of Vibrio in the water reservoir – a measure of the size of the reservoir, the daily amount of each infected person's stool that reaches the reservoir, and the concentration of Vibrio in the stool (units: cells·ml-1·day-1·person-1). This compound parameter is not empirically known, and it likely varies widely, depending on severity of infection, state of sewage infrastructure, and size of water reservoir.
δ, rate of removal of infectious vibrios from the water supply (units: day-1). This is a reflection of the lifespan of V. cholerae, and depends on many factors including whether the reservoir is stationary (such as a well) or flowing (as in a river), as well as water salinity, water temperature, and concentration of cholera phages.17,18 Interpretation of this parameter is further complicated by the fact that viable but unculturable vibrios persist and can remain infectious.19 Reports of data from cholera outbreaks rarely include estimates of this parameter or relevant quantities.
γ, the rate at which a person recovers from cholera (units: day-1). Symptoms last less than a week. Recovered persons can continue to shed vibrios for 1-2 weeks, with a very small fraction shedding for longer.14
κ, the concentration of cholera that infects 50% of exposed people (units: cells/mL). The infectious dose ranges widely, depending on the strain and context, especially gastric acidity. In volunteers, doses of 1011 V. cholerae consistently caused diarrhea.20 When ingested with a bicarbonate buffer, as few as 102 vibrios can result in cholera vibrios in the stool.20 Dose is related to the severity of diarrhea and duration of incubation, with lower doses being associated with a carrier state or milder forms of diarrhea and longer incubation periods.20,21 While the empirical data describe a relationship between dose (number of vibrios), the model is parameterized in terms of vibrio concentration.
This model also assumes that the ratio of asymptomatic to symptomatic infections is constant throughout an epidemic, and that dose determines the likelihood of infection but not the likelihood of being symptomatic. This assumption is contrary to findings from experimental human infections.20 Violations of this assumption may have two consequences for cholera modeling in conjunction with case-notification data. First, severity affects the intensity of shedding,14 and so the average contribution of an infectious person to transmission may change systematically with time as the distribution of infectious doses changes. Second, only symptomatic infections are likely to be reported, and so the reporting rate may change systematically over time for the same reason.
The infection term in this model suffers from misspecification in the sense that there is no physically plausible process that relates the modeled state variables (concentrations of vibrios and “rate of contact with contaminated water”) to a rate (or probability per small unit of time) at which susceptible persons become infected. Put another way, there is no simple way to convert measurable quantities (e.g., a measured dose-response relationship between number of vibrios ingested and the risk of infection) into the parameters β and κ of this model.
This base model has been augmented in multiple ways.16,22-27 Some recent models that analyze the outbreaks in Haiti and Zimbabwe 3-7 incorporate a non-reservoir-based, person-to-person transmission term.5-7 Also, some incorporate a hyperinfectious state for vibrios shortly after excretion3,5,16,22. Some include an asymptomatic state for infected persons 3-5,23, with different models assuming that 20%,5 21%,3 and 25% 4 of infected persons are symptomatic, and that symptomatic persons are 10 (ref. 5) to 1000 (ref. 3) times as infectious as asymptomatic ones. One model includes a latent period,5 and several models link communities to generate meta-population models.4,5,7,25,26
The Table shows the range of several key parameter values either used or generated by the models. Although these models have different structures, we include the ranges to illustrate the uncertainty and inconsistency in parameters that should be biological aspects of cholera and parameters that reflect local water infrastructure and sanitation. We note that some of the parameters used by Codeço,15 chosen for use in an exploratory study, continue to be used in some cholera models despite no evidence for them. For example, the rate of contact with reservoir water is either fixed at 1 day-1 in some models or used for fitting in others, although the physical meaning of this term is unclear as described above. Similarly, rate of contribution of vibrio concentration in the aquatic environment is variously set at ξ=10 cells/mL/person/day following Codeço,15 or set as low as 0.01 cells/mL/person/day based on estimated water reservoir size, or allowed to vary in model fitting.
Table. Parameters assumed or fitted based on mathematical models of cholera.
| Parameters | Range |
|---|---|
| Rate of contact with reservoir water (days-1) | 1×10⁻⁵ - 1 |
| Duration of cholera infection (days) | 2.9-14 |
| Cholera lifespan in water reservoir (days) | 3-41 |
| Rate of contribution to V.cholerae concentration in the aquatic environment (cells*mL-1*individual-1*day-1) | 0.01 - 10 |
| Concentration of cholera that yields 50% chance of infection (cells/mL) | 105-106 |
| Multiplier for infectiousness of freshly shed vibrio (hyperinfectious state) | 50-700 |
| Duration of hyperinfective state (hours) | 5-24 |
Ranges are drawn from several references 3-7,15. Note that not all parameters are used in all models (for example, Bertuzzo et al.,4 Tuite et al.,7 and Mukandavire et al.6 do not include a hyperinfective state in their models) and that there is variation in which parameters are fixed and fitted to data.
The problem of variability in aggregated spatial models of cholera
All of the recent models of epidemic cholera in Haiti and Zimbabwe calibrate to province-level incidence data. Fitting models to data that aggregate local communities assumes that parameters derived from aggregated data can be applied homogeneously, essentially saying that everyone within a province shares the same water reservoir. Attempts to approach this issue in recent cholera modeling include the papers by Chao et al.,5 in which the authors address this concern by estimating local communities based on population density, making use of LandScan (http://www.ornl.gov/sci/landscan/) and geography with respect to rivers and highways, and by Bertuzzo et al.,4 in which the authors use administrative sub-district populations in their model. These model improvements require additional estimated parameters.
The obvious difficulty in calibrating models to province-level data is that cholera outbreaks may be highly spatially heterogeneous: adjacent neighborhoods can experience very different levels of infection,28,29 and given the dependence on water source and sanitation, there may be significant variation at smaller spatial scales than neighborhood. Even neighboring households may not be equally exposed to contaminated water. The shape of an aggregate epidemic curve is influenced by the size of constituent communities, relative timing of outbreaks in those communities, local factors that influence each community's R0, control measures implemented over time, fraction of asymptomatic infection, and extent of underreporting.
Fitting a model to an aggregate epidemic curve will generate a single R0, but this R0 may suggest a level of vaccination that would be protective in some constituent communities but not others. For example, in one recent paper,6 Mukandavire et al. calibrated their model to the Zimbabwean epidemic as reported in each province and from the country as a whole; they then derived the R0 for each of these populations. They reported a threshold vaccination proportion ranging from 13% in Mashonaland East to 81% in Matebeleland South, with the fraction for all provinces except for Mashonaland East reported as 34% or greater. For Zimbabwe overall, the estimated critical vaccination fraction that would prevent an epidemic was 17% – lower than the level of vaccination for all but one of its constituent provinces. This discrepancy emphasizes how spatial heterogeneity can bias results.
In summary, the epidemic curves in constituent spatial units may differ both temporally and in shape, such that the aggregated epidemic curve incorporating each of these communities does not reflect homogeneous dynamics, as assumed in mass-action mixing.30 Consequently, an R0 estimated from aggregate data fails to capture the dynamics critical to accurately estimate the impact of interventions in the constituent spatial units. The data from Zimbabwe show multiple peaks and other features characteristic of heterogeneously mixed populations 31 at province and neighborhood spatial scales.6,29 The practice of fitting epidemic models to cumulative incidence curves rather than incidence curves can obscure these features, while also violating statistical assumptions of independence between fitted data points.
Use of models to predict intervention effects
Interventions such as vaccination, antibiotic administration, and provision of clean water all can decrease the number of cholera cases. Vaccination reduces the number of fully susceptible persons, reduces infectiousness (ie, the rate of contamination of the water supply), and reduces the probability of becoming symptomatic when infected. Antibiotic administration shortens the duration of illness and perhaps reduces the concentration of vibrios excreted during illness. Access to clean water reduces consumption of vibrios. Each of these interventions will result in qualitative decreases in the extent of the epidemic. The benefits will be a combination of direct effects on those receiving the intervention, and indirect effects on those who benefit from reduced exposure because others received the intervention; in the case of vaccines, the latter effect is known as herd immunity.
The estimated direct impact of these interventions is often an input variable for transmission models; for example, these models assume that a certain proportion of the population is vaccinated and that the vaccine is effective in a particular fraction of the population (all-or-nothing efficacy) or reduces the infectiousness of each contact by a fixed fraction (leaky efficacy).32 Thus the role of the transmission models, over and above the assumptions about how interventions affect those who receive them, is to quantify the indirect effects of interventions – how much interventions can slow transmission and protect those who are not directly protected by the intervention. These quantitative results about the impact of interventions depend on the parameter values used in the model. In this sense (setting aside issues of model specification), the value of model-based predictions depends on the extent to which the predictions about indirect effects are robust to uncertainties about the value of input parameters.
Uncertainties in the values of input parameters can translate into massive uncertainties in the values of model predictions. We present an example in the Figure (see eAppendix [http://links.lww.com] for details), and focus for this example on the impact of uncertainty in δ, the rate of removal of cholera from the water supply. In the Codeço model,15 the lifespan of cholera in the water supply is represented as 3 days (δ=1/3 days-1). In other models, the lifespan of cholera in the water reservoir is set at 30 days,3,5,6,16 estimated at approximately 4.5 days 4,25 or fitted at approximately 41 days.7 Given that this term reflects the rates at which infectious vibrios become noninfectious due to death or physiologic change, one would expect the lifespan to be highly context-dependent and to vary based on the conditions of the water reservoir. Studies from the 1960s 33,34 examined cholera lifespan in a variety of water types (such as well-water and sea-water) and under a variety of conditions (including sun exposure and temperature variation). In these studies, cholera lifespan is reported from 4 to 80+ days depending on water source and condition.
Figure. Influence on R0 of lifespan of cholera in water reservoir.
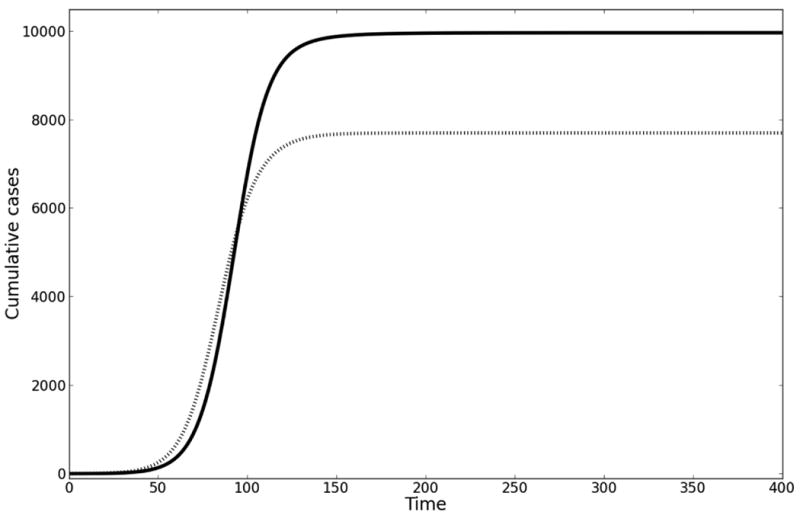
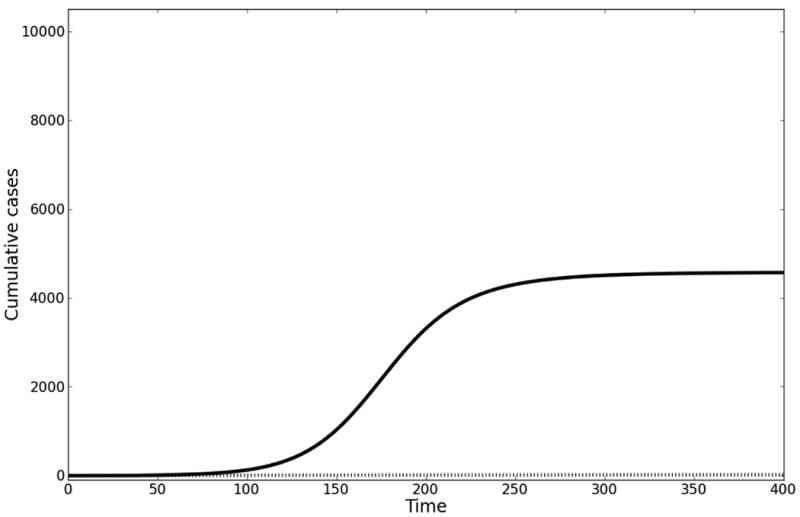
A. In this example, the early growth rate is 0.1 per day, starting population of susceptible individuals is 10000, contact rate with cholera = 1 per day, the concentration of cholera in the aquatic reservoir at which 50% of the population is infected is 106 cells per mL, and the duration of cholera infection is 5 days. Solving for ξ given this growth rate and varying values for δ yields different R0. Solid line (δ = 1/30 days-1): ξ = 4 cells per mL*infected individual*day; R0 = 6. Dotted line (δ = 1/3 days-1): ξ = 13 cells per mL*infected individual*day; R0 = 1.95. B. For the same parameter values in A, we have modeled the impact of having vaccinated the population prior to introduction of the epidemic at 70% coverage with a vaccine of 70% efficacy. Note that there is no epidemic at this vaccine coverage for the example where R0 = 1.95.
Variation in the assumed survival of cholera in water directly translates into variation in the distribution of assumed serial intervals for cholera transmission. This in turn changes estimates of R0, the basic reproductive number, when these are obtained by fitting a model to the initial growth rate of the epidemic.35 When these estimates of R0 are in turn used to model interventions (by extending the model, after fitting to initial-growth data, into the future and considering the impact of interventions on transmission), the various values of R0 can give dramatically different predictions for the population-level effects of the interventions.
The proportion of a randomly mixing population that must be effectively vaccinated to prevent an epidemic from taking place is known as the critical vaccination threshold. This threshold is expressed as 1-1/R0 (effective vaccination means fraction vaccinated, or coverage, multiplied by vaccine efficacy 36). For a model fitted to the early growth rate of the epidemic, varying the lifespan of infectious cholera vibrios in the aquatic reservoir (a parameter for which there are no data, but which is a key component to the serial interval) leads to very large changes in the inferred value of R0 and the corresponding critical vaccination threshold. Fitting the model with the lifespan of infectious vibrios set at 30 and then at 3 days changes the fitted R0 from 6 to 1.95, while the critical vaccination threshold decreases from 83% to 49%. Let us assume pre-epidemic vaccination of 70% of the population with a non-leaky vaccine that has 70% efficacy (in keeping with estimates for populations with less natural immunity than the endemic populations in which the vaccine was trialed37). If R0 = 1.95, then pre-vaccination of a population would prevent an epidemic, whereas if R0 = 6, then nearly all unvaccinated persons will become infected. Thus, using parameter values found in the literature, the indirect benefits of vaccination (which is what the model is meant to quantify) range from almost complete protection of all unvaccinated persons to no protection. (See the eAppendix [http://links.lww.com] for further discussion of this issue.)
If one is willing to make strong assumptions, the problems of estimating R0 based on the initial growth rate and on assumed-duration parameters can be overcome in an idealized model by fitting to an epidemic curve with a known peak in cases.38 However, one must assume homogenously mixing and homogeneous population (which is implausible as we argue in the previous section); fixed reporting ratio throughout the epidemic, which is not the case39,40; fixed asymptomatic to symptomatic ratio throughout the epidemic, for which we know of no supporting data; and a single-peaked epidemic, which has not been the case in multiple locations in both Haiti and Zimbabwe.29,41 Even if these assumptions were tenable, this approach can only be used once the epidemic has peaked and so cannot be employed at the start of an epidemic to guide interventions.
The claims made in this section are particular to the actual parameter values required for cholera models and the range of uncertainty that exists for them, in particular for the duration of infectiousness in contaminated water. Sensitivity analyses are necessary in all prediction models for infectious disease transmission, but here we argue, more specifically, that the uncertainty in just one parameter of cholera models can nearly eliminate the predictive power of these models. Within the range of possible values of this parameter, the qualitative predictions of the model range from substantial indirect vaccine effects to almost no indirect vaccine effects.
Perspective: What is special about cholera?
The process of fitting models to data on the early growth of an epidemic, then running the models forward to test the predicted impact of interventions, has been applied extensively to other infectious diseases. Are the critiques presented here generally applicable to all transmission models fitted to early epidemic data, or are there particular challenges pertaining to cholera or a limited class of infections including cholera?
Such approaches have been frequently applied in planning for pandemic influenza and in the response to SARS and the 2009 influenza pandemic. For these respiratory diseases, a common approach has been to estimate the early growth rate from daily or aggregated case counts, combine this estimate with a (usually exogenous) estimate of the distribution of serial intervals, and produce an estimate of the early values of the reproductive number of the infection. Relatively high-quality estimates of the serial interval distribution were available from contact tracing for SARS, leading to rather consistent estimates of the initial reproductive number around 3.42-44 Likewise, several sources of data provide estimates for the serial interval of pandemic influenza around 2-4 days, 45,46 with corresponding estimates of early reproductive numbers ranging from around 1.3 to a bit over 2, depending on the pandemic and the setting.45-49 While these estimates vary (reflecting true variation, methodological choices, and statistical noise), the range of variation in estimates is less than described above for epidemic cholera. The influenza literature contains explicit considerations of the appropriate values for natural-history parameters 45,50,51 (including critiques 45 of previously used values 48), discussions of the impact of data processing assumptions on reproductive number estimates,35,49 and extensive sensitivity analyses exploring the consequences of alternative parameter values.52-54
Moving beyond parameter-value uncertainty to issues of model structure, the literature on respiratory diseases has considered how varying assumptions about the scale and “local-ness” of mixing,55,56 the relative importance of various settings for transmission,54 seasonality,57 and other factors affect the predicted natural history of an epidemic and impact of control measures. The importance of heterogeneity is recognized in modeling many diseases.58-61
In summary, the issues raised here about the reliability of quantitative predictions from cholera models are applicable to other diseases, including those for which real-time (and retrospective) model fitting has been attempted, such as influenza and SARS. In these diseases, as well, sensitivity analyses to uncertain or heterogeneous parameters are needed, and have indeed been employed.42,62,63 However, there appears to be less heterogeneity and less uncertainty about parameter values for these diseases, perhaps because of their direct person-to-person transmission route, which reduces the impact of environmental variables on parameter values and improves one's ability to measure relevant quantities. Thus, while the same issues should be considered in other diseases, we believe the magnitude of uncertainty in the predictions of models is greater for cholera than for SARS and influenza.
Suggestions for improvements
Each of the uncertainties described here provides a potential avenue for advancing cholera modeling. Additional monitoring, where possible, of spatial heterogeneity and the model's quantifiable variables will aid in understanding the mechanisms and dynamics of cholera transmission.
For example, the accuracy of model predictions can be improved by line-listing data describing an outbreak in high spatial and temporal resolution, coupled with descriptions of water resources, storage, and use, and by direct quantitation of vibrio concentration, or measurement of fecal coliform contamination as a proxy.64 Such data would also improve understanding of the extent to which critical variables vary across epidemic settings. In the context of an ongoing epidemic, treatment and prevention efforts must be primary. Still, we note that data relevant to model-building have been obtained in past epidemics.64 Also, coordination with demographic, geologic, and aquatic databases 4,5 can help improve the understanding of cholera transmission dynamics under various conditions.
From the perspective of model misspecification, one possible improvement is to restructure the rate of infection to reflect quantifiable variables. For example, some model misspecification can be avoided by collecting empirical data on drinking rates. This could allow the contact rate (currently units of day-1) to be changed to a drinking rate (units of volume per time), with the probability of infection then formulated as a function of the dose of ingested vibrios rather than a function of the concentration of vibrios. Better data on the dose-response relationship for cholera – including differences between ingestion of a given dose all at once and ingestion of the same dose over several hours or days – would help to constrain the infection terms.
Lastly, the survival of vibrios in a water supply, as shown in our simple sensitivity analysis, may have a significant impact on model-based predictions. The magnitude of the effect may be limited under circumstances in which person-to-person transmission outweighs waterborne transmission (see eAppendix [http://links.lww.com]). This further emphasizes the need for monitoring, and suggests the importance of assessing the sensitivity of results to variations in this parameter.
Conclusions
The uncertainties in epidemic cholera modeling described above suggest that current quantitative estimates of benefits from intervention strategies are handicapped by uncertain model structure. Such uncertainties include the role of person-to-person transmission, a lack of data about critical parameters, including the rate of contamination of communal water supply and the rate of loss of infectious vibrios from the aquatic reservoir, and spatial heterogeneity of parameters among communities. For quantitative modeling to improve its predictions and offer better guidance to policy-makers during episodes of epidemic cholera, innovative approaches are needed for gathering data on neighborhood-level water consumption and contamination, as well as higher spatial-resolution case-reporting.
The analyses and suggestions presented here are intended to provide assistance in critically interpreting the results of cholera models and to point out avenues for further exploration in terms of data collection and modeling development. This is not to dismiss recent cholera modeling efforts or to suggest a particular threshold for modeling accuracy beyond which the use of models is valid. As discussed by George Box, 65 all models are wrong, but some are useful. The extent to which a model is useful depends on the question being asked, and then on an assessment of how a model's uncertainties and simplifying assumptions influence the strength of its conclusions.
Supplementary Material
Appendix
In the model we present, based on Codeço,1 the basic reproductive number (R0) and the rate of exponential growth (r), defined as the per capita change in number of new cases per unit of time, are:
These equations indicate that for a given growth rate, varying parameter values within their plausible range of uncertainty can lead to large changes in R0, with important consequences for the models predictions about the effects of interventions.
As an example, take the starting point in which the duration of infection with cholera is 5 days, the lifespan of cholera in the water supply is 30 days, the size of the population is 10000 individuals, the concentration of V. cholerae in the water reservoir resulting in 50% probability of infection is 1×10⁶ cells/mL, and the contact rate is 1 per day. Assuming an initial growth rate of 0.1 per day and solving for the contamination rate (ξ), then using the ξ term to derive R0, we calculate R0 = 6. Alternatively, assuming the lifespan of cholera in the water supply is 3 days, then, for the same growth rate, R0 = 1.95. We consider the effect of giving 70% of the population a vaccine that gives full immunity to 70% of recipients, but has no effect on the remainder. We assume the vaccine is distributed prior to the introduction of cholera. We model this as shifting individuals to the “Recovered” compartment in the model.
The examples above reflect the relationship among the growth rate, basic reproductive number, and disease-generation time, defined as the average amount of time between when an individual is infected and when the person who infected that individual was infected.2 Given two of the three, one can determine the third. Because the generation time depends on the duration of cholera infection and the lifespan of cholera in the water reservoir, then, for a given positive growth rate, R0 depends on these variables. Lack of knowledge of the lifespan of V. cholerae in a water reservoir then means we can only guess at the disease generation time, and hence a positive growth rate is compatible with a wide range of values of R0.
Note that in both expressions for R0 and r, the terms ξ, β, κ, and S0 appear only as the combination ξβS0/κ. If we were to assume δ and γ are fixed and fit the model to an observed value of r, then we are specifying the combination of ξβS0/κ, and so R0 is uniquely determined. This holds regardless of how we allow ξ, β, S0, and k to vary in the fit; the relation between R0 and r is not sensitive to these parameters. In other words, a sensitivity analysis of the impact of varying one of these parameters while fitting to another of the parameters is uninformative, as their product will remain the same. Introduction of terms to account for hyperinfectivity, differing infectivity for asymptomatic and symptomatic individuals, and person-to-person infection, will add terms to, and therefore influence, these relationships, but the core structure remains.
Combining these observations, the similar values for R0 reported by several recent cholera models may reflect use of similar values of δ and γ and hence a similar serial interval. The variation seen in ξ and β likely then reflects differences in other parameter estimates and model differences. However, while we might know the distribution of duration of infection with cholera, we do not know the lifespan of cholera in a water supply. Because the relation between r and R0 is sensitive to this parameter, and our knowledge of it is poor, sensitivity analyses should investigate wide ranges of this parameter.
The serial interval for the model discussed here can be calculated as follows. Start with one infected individual, who recovers at rate γ and increases the concentration of vibrios in the water reservoir at rate ξ. These vibrios decay at rate δ. The expected concentration of vibrios due to the infected individual at time t is given by:
As infectiousness is proportional to vibrio concentration when concentrations are low, to obtain the serial interval distribution we can normalize BI(t) by its integral over time, which is
The serial interval has a mean equal to the sum of the mean duration of human infectiousness and the mean duration of vibrio viability in the water,
Thus for these parameters, this ranges from 8 days (5 + 3) to 35 days (5+30) -- an uncertainty of almost 4.5 times. Plotting the serial interval distribution for the two sets of parameters used in the example above yields eFigure (http://links.lww.com).
The parameter uncertainty emphasized here is importantly dependent on the most uncertain (and probably variable) parameter that influences timing of infectiousness, the decay rate of cholera infectivity in water. One might argue that this dependence is an artifact of assuming a purely waterborne transmission route, without accounting for person-to-person transmission, which in this context means transmission through contaminated food or water containers within households or at communal meals. The role of waterborne transmission is to extend the duration of infectiousness traceable back to one infected person from the duration of that person's shedding to the (possibly much longer) time that the vibrios shed by that person remain infectious in the water reservoir. In a model with primarily person-to-person transmission, the serial interval would be shorter and less uncertain.
If one were certain of the relative proportion of person-to-person and waterborne transmission of cholera within an epidemic (and if it could be assumed constant in space and time), then the parameter uncertainty described in the main text of this paper would be reduced. However, in models incorporating direct person-to-person transmission, the relative role of this route vs. waterborne transmission is either fitted, for which there may be an identifiability problem, or assumed, based on little or no data, especially for any particular ongoing outbreak. In the absence of knowledge about the relative importance of person-to-person and waterborne transmission, the uncertainty in the serial interval remains unchanged.
- 1.Codeco CT. Endemic and epidemic dynamics of cholera: the role of the aquatic reservoir. BMC Infect Dis. 2001;1:1. doi: 10.1186/1471-2334-1-1. [DOI] [PMC free article] [PubMed] [Google Scholar]
- 2.Wallinga J, Lipsitch M. How generation intervals shape the relationship between growth rates and reproductive numbers. Proc Biol Sci. 2007;274(1609):599–604. doi: 10.1098/rspb.2006.3754. [DOI] [PMC free article] [PubMed] [Google Scholar]
Footnotes
SDC Supplemental digital content is available through direct URL citations in the HTML and PDF versions of this article (www.epidem.com). This content is not peer-reviewed or copy-edited; it is the sole responsibility of the author.
Conflicts of Interest and Sources of Funding: The project described was supported by Award Number U54GM088558 to ML from the National Institute Of General Medical Sciences. The content is solely the responsibility of the authors and does not necessarily represent the official views of the National Institute Of General Medical Sciences or the National Institutes of Health. YHG received support from National Institutes of Allergy and Infectious Disease (T32 grant AI007061). JCM received support from the RAPIDD program of the Science and Technology Directorate, Department of Homeland Security and the Fogarty International Center, National Institutes of Health.
References
- 1.Rosenberg CE. The cholera years : the United States in 1832, 1849, and 1866. Chicago: University of Chicago Press; 1987. [Google Scholar]
- 2.Reyburn R, Deen JL, Grais RF, Bhattacharya SK, Sur D, Lopez AL, Jiddawi MS, Clemens JD, von Seidlein L. The case for reactive mass oral cholera vaccinations. PLoS Negl Trop Dis. 2011;5(1):e952. doi: 10.1371/journal.pntd.0000952. [DOI] [PMC free article] [PubMed] [Google Scholar]
- 3.Andrews JR, Basu S. Transmission dynamics and control of cholera in Haiti: an epidemic model. Lancet. 2011;377(9773):1248–55. doi: 10.1016/S0140-6736(11)60273-0. [DOI] [PMC free article] [PubMed] [Google Scholar]
- 4.Bertuzzo E, Mari L, Righetto L, Gatto M, Casagrandi R, Blokesch M, Rodriguez-Iturbe I, Rinaldo A. Prediction of the spatial evolution and effects of control measures for the unfolding Haiti cholera outbreak. Geophysical Research Letters. 2011;38(6) [Google Scholar]
- 5.Chao DL, Halloran ME, Longini IM., Jr Vaccination strategies for epidemic cholera in Haiti with implications for the developing world. Proc Natl Acad Sci U S A. 2011;108(17):7081–5. doi: 10.1073/pnas.1102149108. [DOI] [PMC free article] [PubMed] [Google Scholar]
- 6.Mukandavire Z, Liao S, Wang J, Gaff H, Smith DL, Morris JG., Jr Estimating the reproductive numbers for the 2008-2009 cholera outbreaks in Zimbabwe. Proc Natl Acad Sci U S A. 2011 doi: 10.1073/pnas.1019712108. [DOI] [PMC free article] [PubMed] [Google Scholar]
- 7.Tuite AR, Tien J, Eisenberg M, Earn DJ, Ma J, Fisman DN. Cholera epidemic in haiti, 2010: using a transmission model to explain spatial spread of disease and identify optimal control interventions. Ann Intern Med. 2011;154(9):593–601. doi: 10.7326/0003-4819-154-9-201105030-00334. [DOI] [PubMed] [Google Scholar]
- 8.Clemens JD. Vaccines in the time of cholera. Proc Natl Acad Sci U S A. 2011;108(21):8529–30. doi: 10.1073/pnas.1105807108. [DOI] [PMC free article] [PubMed] [Google Scholar]
- 9.Koelle K, Pascual M, Yunus M. Serotype cycles in cholera dynamics. Proc Biol Sci. 2006;273(1603):2879–86. doi: 10.1098/rspb.2006.3668. [DOI] [PMC free article] [PubMed] [Google Scholar]
- 10.Pascual M, Rodo X, Ellner SP, Colwell R, Bouma MJ. Cholera dynamics and El Nino-Southern Oscillation. Science. 2000;289(5485):1766–9. doi: 10.1126/science.289.5485.1766. [DOI] [PubMed] [Google Scholar]
- 11.Koelle K, Rodo X, Pascual M, Yunus M, Mostafa G. Refractory periods and climate forcing in cholera dynamics. Nature. 2005;436(7051):696–700. doi: 10.1038/nature03820. [DOI] [PubMed] [Google Scholar]
- 12.Koelle K. The impact of climate on the disease dynamics of cholera. Clin Microbiol Infect. 2009;15(1):29–31. doi: 10.1111/j.1469-0691.2008.02686.x. [DOI] [PubMed] [Google Scholar]
- 13.Nelson EJ, Harris JB, Glenn Morris J, Calderwood SB, Camilli A. Cholera transmission: the host, pathogen and bacteriophage dynamic. Nature Reviews Microbiology. 2009;7(10):693–702. doi: 10.1038/nrmicro2204. [DOI] [PMC free article] [PubMed] [Google Scholar]
- 14.Kaper JB, Morris JG, Jr, Levine MM. Cholera. Clin Microbiol Rev. 1995;8(1):48–86. doi: 10.1128/cmr.8.1.48. [DOI] [PMC free article] [PubMed] [Google Scholar]
- 15.Codeco CT. Endemic and epidemic dynamics of cholera: the role of the aquatic reservoir. BMC Infect Dis. 2001;1:1. doi: 10.1186/1471-2334-1-1. [DOI] [PMC free article] [PubMed] [Google Scholar]
- 16.Hartley DM, Morris JG, Smith DL. Hyperinfectivity: A Critical Element in the Ability of V. cholerae to Cause Epidemics? PLoS Medicine. 2006;3(1):e7. doi: 10.1371/journal.pmed.0030007. [DOI] [PMC free article] [PubMed] [Google Scholar]
- 17.Faruque SM, Islam MJ, Ahmad QS, Faruque AS, Sack DA, Nair GB, Mekalanos JJ. Self-limiting nature of seasonal cholera epidemics: Role of host-mediated amplification of phage. Proc Natl Acad Sci U S A. 2005;102(17):6119–24. doi: 10.1073/pnas.0502069102. [DOI] [PMC free article] [PubMed] [Google Scholar]
- 18.Jensen MA, Faruque SM, Mekalanos JJ, Levin BR. Modeling the role of bacteriophage in the control of cholera outbreaks. Proc Natl Acad Sci U S A. 2006;103(12):4652–7. doi: 10.1073/pnas.0600166103. [DOI] [PMC free article] [PubMed] [Google Scholar]
- 19.Colwell RR, Huq A. Environmental reservoir of Vibrio cholerae. The causative agent of cholera. Ann N Y Acad Sci. 1994;740:44–54. doi: 10.1111/j.1749-6632.1994.tb19852.x. [DOI] [PubMed] [Google Scholar]
- 20.Hornick RB, Music SI, Wenzel R, Cash R, Libonati JP, Snyder MJ, Woodward TE. The Broad Street pump revisited: response of volunteers to ingested cholera vibrios. Bull N Y Acad Med. 1971;47(10):1181–91. [PMC free article] [PubMed] [Google Scholar]
- 21.Haas CN, Rose JB, Gerba CP. Quantitative microbial risk assessment. New York: Wiley; 1999. [Google Scholar]
- 22.Merrell DS, Butler SM, Qadri F, Dolganov NA, Alam A, Cohen MB, Calderwood SB, Schoolnik GK, Camilli A. Host-induced epidemic spread of the cholera bacterium. Nature. 2002;417(6889):642–5. doi: 10.1038/nature00778. [DOI] [PMC free article] [PubMed] [Google Scholar]
- 23.King AA, Ionides EL, Pascual M, Bouma MJ. Inapparent infections and cholera dynamics. Nature. 2008;454(7206):877–880. doi: 10.1038/nature07084. [DOI] [PubMed] [Google Scholar]
- 24.Joh RI, Wang H, Weiss H, Weitz JS. Dynamics of indirectly transmitted infectious diseases with immunological threshold. Bull Math Biol. 2009;71(4):845–62. doi: 10.1007/s11538-008-9384-4. [DOI] [PubMed] [Google Scholar]
- 25.Bertuzzo E, Azaele S, Maritan A, Gatto M, Rodriguez-Iturbe I, Rinaldo A. On the space-time evolution of a cholera epidemic. Water Resources Research. 2008;44(1) [Google Scholar]
- 26.Bertuzzo E, Casagrandi R, Gatto M, Rodriguez-Iturbe I, Rinaldo A. On spatially explicit models of cholera epidemics. Journal of The Royal Society Interface. 2009;7(43):321–333. doi: 10.1098/rsif.2009.0204. [DOI] [PMC free article] [PubMed] [Google Scholar]
- 27.Tien JH, Earn DJD. Multiple Transmission Pathways and Disease Dynamics in a Waterborne Pathogen Model. Bulletin of Mathematical Biology. 2010;72(6):1506–1533. doi: 10.1007/s11538-010-9507-6. [DOI] [PubMed] [Google Scholar]
- 28.Luquero FJ, Banga CN, Remartinez D, Palma PP, Baron E, Grais RF. Cholera epidemic in Guinea-bissau (2008): the importance of “place”. PLoS One. 2011;6(5):e19005. doi: 10.1371/journal.pone.0019005. [DOI] [PMC free article] [PubMed] [Google Scholar]
- 29.Luque Fernández MÁ, Mason PR, Gray H, Bauernfeind A, Fesselet JF, Maes P. Descriptive spatial analysis of the cholera epidemic 2008–2009 in Harare, Zimbabwe: a secondary data analysis. Transactions of the Royal Society of Tropical Medicine and Hygiene. 2011;105(1):38–45. doi: 10.1016/j.trstmh.2010.10.001. [DOI] [PubMed] [Google Scholar]
- 30.Watts DJ, Muhamad R, Medina DC, Dodds PS. Multiscale, resurgent epidemics in a hierarchical metapopulation model. Proc Natl Acad Sci U S A. 2005;102(32):11157–62. doi: 10.1073/pnas.0501226102. [DOI] [PMC free article] [PubMed] [Google Scholar]
- 31.Watts DJ. Multiscale, resurgent epidemics in a hierarchical metapopulation model. Proceedings of the National Academy of Sciences. 2005;102(32):11157–11162. doi: 10.1073/pnas.0501226102. [DOI] [PMC free article] [PubMed] [Google Scholar]
- 32.Halloran ME, Longini IM, Jr, Struchiner CJ. Design and interpretation of vaccine field studies. Epidemiol Rev. 1999;21(1):73–88. doi: 10.1093/oxfordjournals.epirev.a017990. [DOI] [PubMed] [Google Scholar]
- 33.Pandit CG, Pal SC, Murti GV, Misra BS, Murty DK, Shrivastav JB. Survival of Vibrio cholerae biotype El Tor in well water. Bull World Health Organ. 1967;37(4):681–5. [PMC free article] [PubMed] [Google Scholar]
- 34.Pesigan TP, Plantilla J, Rolda M. Applied studies on the viability of El Tor vibrios. Bull World Health Organ. 1967;37(5):779–86. [PMC free article] [PubMed] [Google Scholar]
- 35.Wallinga J, Lipsitch M. How generation intervals shape the relationship between growth rates and reproductive numbers. Proc Biol Sci. 2007;274(1609):599–604. doi: 10.1098/rspb.2006.3754. [DOI] [PMC free article] [PubMed] [Google Scholar]
- 36.McLean AR, Blower SM. Imperfect vaccines and herd immunity to HIV. Proc Biol Sci. 1993;253(1336):9–13. doi: 10.1098/rspb.1993.0075. [DOI] [PubMed] [Google Scholar]
- 37.Longini IM, Jr, Nizam A, Ali M, Yunus M, Shenvi N, Clemens JD. Controlling endemic cholera with oral vaccines. PLoS Med. 2007;4(11):e336. doi: 10.1371/journal.pmed.0040336. [DOI] [PMC free article] [PubMed] [Google Scholar]
- 38.Baguelin M, Hoek AJ, Jit M, Flasche S, White PJ, Edmunds WJ. Vaccination against pandemic influenza A/H1N1v in England: a real-time economic evaluation. Vaccine. 2010;28(12):2370–84. doi: 10.1016/j.vaccine.2010.01.002. [DOI] [PubMed] [Google Scholar]
- 39.Update: outbreak of cholera ---Haiti, 2010. MMWR Morb Mortal Wkly Rep. 2010;59(48):1586–90. [PubMed] [Google Scholar]
- 40.Update: cholera outbreak --- Haiti, 2010. MMWR Morb Mortal Wkly Rep. 2010;59(45):1473–9. [PubMed] [Google Scholar]
- 41. [Accessed June 27, 2011]; http://www.mspp.gouv.ht/site/index.php?option=com_content&view=article&id=57.
- 42.Lipsitch M, Cohen T, Cooper B, Robins JM, Ma S, James L, Gopalakrishna G, Chew SK, Tan CC, Samore MH, Fisman D, Murray M. Transmission dynamics and control of severe acute respiratory syndrome. Science. 2003;300(5627):1966–70. doi: 10.1126/science.1086616. [DOI] [PMC free article] [PubMed] [Google Scholar]
- 43.Riley S, Fraser C, Donnelly CA, Ghani AC, Abu-Raddad LJ, Hedley AJ, Leung GM, Ho LM, Lam TH, Thach TQ, Chau P, Chan KP, Lo SV, Leung PY, Tsang T, Ho W, Lee KH, Lau EM, Ferguson NM, Anderson RM. Transmission dynamics of the etiological agent of SARS in Hong Kong: impact of public health interventions. Science. 2003;300(5627):1961–6. doi: 10.1126/science.1086478. [DOI] [PubMed] [Google Scholar]
- 44.Wallinga J, Teunis P. Different epidemic curves for severe acute respiratory syndrome reveal similar impacts of control measures. Am J Epidemiol. 2004;160(6):509–16. doi: 10.1093/aje/kwh255. [DOI] [PMC free article] [PubMed] [Google Scholar]
- 45.Ferguson NM, Cummings DA, Cauchemez S, Fraser C, Riley S, Meeyai A, Iamsirithaworn S, Burke DS. Strategies for containing an emerging influenza pandemic in Southeast Asia. Nature. 2005 doi: 10.1038/nature04017. [DOI] [PubMed] [Google Scholar]
- 46.Yang Y, Sugimoto JD, Halloran ME, Basta NE, Chao DL, Matrajt L, Potter G, Kenah E, Longini IM., Jr The Transmissibility and Control of Pandemic Influenza A (H1N1) Virus. Science. 2009 doi: 10.1126/science.1177373. [DOI] [PMC free article] [PubMed] [Google Scholar]
- 47.Lessler J, dos Santos T, Aguilera X, Brookmeyer R, Cummings DA. H1N1pdm in the Americas. Epidemics. 2010;2(3):132–8. doi: 10.1016/j.epidem.2010.07.001. [DOI] [PMC free article] [PubMed] [Google Scholar]
- 48.Mills CE, Robins JM, Lipsitch M. Transmissibility of 1918 pandemic influenza. Nature. 2004;432(7019):904–6. doi: 10.1038/nature03063. [DOI] [PMC free article] [PubMed] [Google Scholar]
- 49.White LF, Wallinga J, Finelli L, Reed C, Riley S, Lipsitch M, Pagano M. Estimation of the reproductive number and the serial interval in early phase of the 2009 influenza A/H1N1 pandemic in the USA. Influenza Other Respi Viruses. 2009;3(6):267–76. doi: 10.1111/j.1750-2659.2009.00106.x. [DOI] [PMC free article] [PubMed] [Google Scholar]
- 50.Carrat F, Vergu E, Ferguson NM, Lemaitre M, Cauchemez S, Leach S, Valleron AJ. Time lines of infection and disease in human influenza: a review of volunteer challenge studies. Am J Epidemiol. 2008;167(7):775–85. doi: 10.1093/aje/kwm375. [DOI] [PubMed] [Google Scholar]
- 51.Lessler J, Reich NG, Brookmeyer R, Perl TM, Nelson KE, Cummings DA. Incubation periods of acute respiratory viral infections: a systematic review. Lancet Infect Dis. 2009;9(5):291–300. doi: 10.1016/S1473-3099(09)70069-6. [DOI] [PMC free article] [PubMed] [Google Scholar]
- 52.Ferguson NM, Cummings DA, Fraser C, Cajka JC, Cooley PC, Burke DS. Strategies for mitigating an influenza pandemic. Nature. 2006;442(7101):448–52. doi: 10.1038/nature04795. [DOI] [PMC free article] [PubMed] [Google Scholar]
- 53.Germann TC, Kadau K, Longini IM, Jr, Macken CA. Mitigation strategies for pandemic influenza in the United States. Proc Natl Acad Sci U S A. 2006;103(15):5935–40. doi: 10.1073/pnas.0601266103. [DOI] [PMC free article] [PubMed] [Google Scholar]
- 54.Halloran ME, Ferguson NM, Eubank S, Longini IM, Jr, Cummings DA, Lewis B, Xu S, Fraser C, Vullikanti A, Germann TC, Wagener D, Beckman R, Kadau K, Barrett C, Macken CA, Burke DS, Cooley P. Modeling targeted layered containment of an influenza pandemic in the United States. Proc Natl Acad Sci U S A. 2008;105(12):4639–44. doi: 10.1073/pnas.0706849105. [DOI] [PMC free article] [PubMed] [Google Scholar]
- 55.Fraser C. Estimating individual and household reproduction numbers in an emerging epidemic. PLoS ONE. 2007;2(1):e758. doi: 10.1371/journal.pone.0000758. [DOI] [PMC free article] [PubMed] [Google Scholar]
- 56.Goldstein E, Paur K, Fraser C, Kenah E, Wallinga J, Lipsitch M. Reproductive numbers, epidemic spread and control in a community of households. Math Biosci. 2009;221(1):11–25. doi: 10.1016/j.mbs.2009.06.002. [DOI] [PMC free article] [PubMed] [Google Scholar]
- 57.Bacaer N, Gomes MG. On the final size of epidemics with seasonality. Bulletin of mathematical biology. 2009;71(8):1954–66. doi: 10.1007/s11538-009-9433-7. [DOI] [PubMed] [Google Scholar]
- 58.Lloyd-Smith JO, Schreiber SJ, Kopp PE, Getz WM. Superspreading and the effect of individual variation on disease emergence. Nature. 2005;438(7066):355–9. doi: 10.1038/nature04153. [DOI] [PMC free article] [PubMed] [Google Scholar]
- 59.Smith DL, Drakeley CJ, Chiyaka C, Hay SI. A quantitative analysis of transmission efficiency versus intensity for malaria. Nature communications. 2010;1:108. doi: 10.1038/ncomms1107. [DOI] [PMC free article] [PubMed] [Google Scholar]
- 60.Woolhouse ME, Dye C, Etard JF, Smith T, Charlwood JD, Garnett GP, Hagan P, Hii JL, Ndhlovu PD, Quinnell RJ, Watts CH, Chandiwana SK, Anderson RM. Heterogeneities in the transmission of infectious agents: implications for the design of control programs. Proc Natl Acad Sci U S A. 1997;94(1):338–42. doi: 10.1073/pnas.94.1.338. [DOI] [PMC free article] [PubMed] [Google Scholar]
- 61.Yorke JA, Hethcote HW, Nold A. Dynamics and control of the transmission of gonorrhea. Sex Transm Dis. 1978;5(2):51–6. doi: 10.1097/00007435-197804000-00003. [DOI] [PubMed] [Google Scholar]
- 62.Fraser C, Donnelly CA, Cauchemez S, Hanage WP, Van Kerkhove MD, Hollingsworth TD, Griffin J, Baggaley RF, Jenkins HE, Lyons EJ, Jombart T, Hinsley WR, Grassly NC, Balloux F, Ghani AC, Ferguson NM, Rambaut A, Pybus OG, Lopez-Gatell H, Alpuche-Aranda CM, Chapela IB, Zavala EP, Guevara DM, Checchi F, Garcia E, Hugonnet S, Roth C. Pandemic potential of a strain of influenza A (H1N1): early findings. Science. 2009;324(5934):1557–61. doi: 10.1126/science.1176062. [DOI] [PMC free article] [PubMed] [Google Scholar]
- 63.Yang Y, Sugimoto JD, Halloran ME, Basta NE, Chao DL, Matrajt L, Potter G, Kenah E, Longini IM., Jr The transmissibility and control of pandemic influenza A (H1N1) virus. Science. 2009;326(5953):729–33. doi: 10.1126/science.1177373. [DOI] [PMC free article] [PubMed] [Google Scholar]
- 64.Swerdlow DL, Mintz ED, Rodriguez M, Tejada E, Ocampo C, Espejo L, Greene KD, Saldana W, Seminario L, Tauxe RV, et al. Waterborne transmission of epidemic cholera in Trujillo, Peru: lessons for a continent at risk. Lancet. 1992;340(8810):28–33. doi: 10.1016/0140-6736(92)92432-f. [DOI] [PubMed] [Google Scholar]
- 65.Box GEP. Science and Statistics. JASA. 1976;71(356):791–799. [Google Scholar]
Associated Data
This section collects any data citations, data availability statements, or supplementary materials included in this article.