

1. INTRODUCTION
A substantial and bi-directional overlap has been documented between attention deficit hyperactivity disorder (ADHD) and bipolar disorder (BPD) in adults (Sachs et al. 2000) and children (Biederman et al. 2003). In adults, BPD comorbid with ADHD has an early age of onset in childhood and adolescence (Sachs et al. 2000). Family studies suggested that BPD comorbid with ADHD might be an early onset, familially distinct subtype of BPD (Faraone et al. 2003), given that co-segregation between BPD and ADHD has been demonstrated.
Although ADHD and bipolar disorder co-occur frequently and represent a particularly morbid clinical form of both disorders (Biederman et al. 2005) neuroimaging research addressing this co-morbidity is scarce, and no studies have used measures of cortical thickness. In a previous volumetric MRI study of the current sample we found that BPD was associated with a significantly smaller orbital prefrontal cortex and larger right thalamus, and that this pattern was also found in comorbid subjects with ADHD+BPD (Biederman et al. 2008). Likewise, ADHD was associated with significantly less neocortical gray matter, less overall frontal lobe and superior prefrontal cortex volumes, a smaller right anterior cingulate cortex, and less cerebellar gray matter, as was comorbid ADHD+BPD (Biederman et al. 2008). These results support the hypothesis that ADHD and BPD independently contribute to volumetric alterations of selective and distinct brain structures. Yet, whether these results will extend to cortical thickness alterations remains unknown.
Given the architectonic nature of cortical and subcortical connections with respect to cortical lamination, cortical thickness could be an indicator of integrity of cytoarchitecture in the cortex and thus an indirect assessment of cortical connectivity (Makris et al. 2006). Recent neuroimaging studies of cortical thickness in ADHD, including our own, have shown consistent abnormalities in prefrontal and parietal regions associated with corticostriatal, attention and executive neural networks (Sowell et al. 2003; Makris et al. 2007; Shaw et al. 2007; Almeida et al. 2010; Batty et al. 2010). In contrast, in BPD, cortical thinning was shown in left rostral paracingulate and right dorsal paracingulate regions in one study (Fornito et al. 2008), whereas other studies of cortical thickness have found BPD-related thinning in left dorsal-anterior and posterior cingulate regions, left occipital region, left precentral area, right medial frontal, frontopolar and frontoorbital cortex (FOC), right postcentral and angular regions, right lateral occipital areas as well as right and left middle frontal areas (Lyoo et al. 2006; Fornito et al. 2008). To date, none of these studies evaluated individuals with combined ADHD+BPD.
The main aim of this study was to identify a network of MRI measures of cortical thickness in adults with ADHD comorbid with bipolar disorder (ADHD+BPD), and the independent contribution of each disorder to this network of alterations. Based on the existing, limited neuroimaging literature on comorbidity, we expected that each contributing disorder would be associated with disorder specific findings. Specifically, ADHD will be associated with abnormalities in the supervisory networks involved in generalized control of multiple cognitive functions involved in attentional and executive processing (e.g., prefrontal, inferior parietal lobule and anterior cingulate cortices (Strange et al. 2001; Seidman 2006; Burgess et al. 2007)). We also expected that BPD will be associated with abnormalities in the limbic and paralimbic cortices involved in emotion processing including anterior cingulate, and anterior insula, as well as the ventral PFC regions including FOC. To the best of our knowledge, this represents the first examination of cortical thickness measurements in adults with ADHD and BPD attending to the issue of the comorbidity.
2. METHOD
As previously reported, (Biederman et al. 2008), subjects (ages 18–59) were stratified into four groups based on diagnostic status: BPD+ADHD (n=31), BPD only (n=18), ADHD only (n=26), and controls with neither ADHD nor BPD (n=23). This paper presents entirely new cortical thickness analyses on the same sample as in our previous volumetric study using identical brain acquisitions carried out at Massachusetts General Hospital (MGH) as reported in Biederman (Biederman et al. 2008). Data from 43% of the participants in this study without BPD (24 with ADHD and 18 controls) have additionally been reported in other papers (Seidman 2006; Makris et al. 2007). Briefly, exclusion criteria were neurological disorders, sensorimotor handicaps, inadequate command of the English language, or a Full Scale IQ estimate less than 75 as measured by the Wechsler Adult Intelligence Scale-Revised (Wechsler 1981). No ethnic or racial group was excluded. Socioeconomic status (SES) was assessed with the Hollingshead scale (Hollingshead, 1975).
We recruited ADHD probands (including those with comorbid BPD) through referrals to the Adult ADHD program at Massachusetts General Hospital (MGH) and advertisements in the greater Boston area. A subset of the bipolar probands was recruited through a follow-up to a birth cohort study (Thermenos et al. 2010) that used identical imaging methods during the same time period. We recruited control probands through advertisements in the greater Boston area. These were selected by not having BPD or ADHD as is customary in case-control studies. ADHD adults were included if they met full criteria for current ADHD according to the DSM-IV, with childhood onset and persistence into adulthood. Written informed consent was obtained for all subjects after a complete description of the study, and all participants received an honorarium for participating. The MGH human subjects committee approved this study. All BPD subjects met full criteria for DSM-IV bipolar I disorder.
Regarding medication history for the 23 controls, 19 had never received psychotropic medications, 4 had received medications in their lifetime, including anti-depressants (n=4), anti-anxiety (n=1) and stimulant (n=1) medications. For the 26 ADHD participants, 12 had never received psychotropic medications, and 14 had received some medications including anti-depressants in the past only (n=2), stimulants until the 24 hours prior to imaging when they were washed out (n=8), and stimulants in the past (n=4). For the 18 BPD participants, 6 had never received psychotropic medications, and 12 were on multiple medications including anti-depressants (n=10), anti-psychotics or mood stabilizers (n=10), stimulants (n=1), and anti-anxiety medications (n=2). For the 31 ADHD+BPD participants, 3 had never received psychotropic medication, 5 had missing data, and 23 were on multiple medications including stimulants (n=10), anti-depressants (n=23), anti-anxiety medications (n=3), and anti-psychotics or mood stabilizers (n=17).
2.1 Clinical Assessment Measures
Trained interviewers, blind to ascertainment status, interviewed subjects with the Structured Clinical Interview for DSM-IV (First et al. 1997) and modules from the Kiddie SADS-E (Orvaschel 1994). The structured interview data were reviewed by a diagnostic committee blind to the subject’s ascertainment group and all non-diagnostic data. We computed kappa coefficients by having board certified child and adult psychiatrists diagnose subjects from audio taped interviews. Kappa coefficients for ADHD and BPD were 0.88 and 0.95, respectively. We estimated IQ from the Block Design and Vocabulary subtests of the Wechsler Adult Intelligence Scale-Revised (WAIS-R) (Wechsler 1981) to assess comparability of the groups.
2.2 MRI Protocol
Whole brain MR images were collected on a Siemens 1.5 Tesla scanner at the MGH/HST A. Athinoula Martinos Center for Biomedical Imaging. A sagittal localizer scan was performed for placement of slices, followed by a coronal T2-weighted sequence to rule out unexpected neuropathology. Two sagittal 3D MP-RAGE (T1-weighted, non-selective inversion-prepared spoiled gradient echo pulse) sequences were collected and averaged (TR/TE/T1/flip = 2.73 s/3.39 ms/1.0 s/7, bandwidth =190 Hz/pixel, sampling matrix = 256 × 192 pixels, FOV = 256 × 256 mm, effective slice thickness = 1.33 mm on a 170 mm slab of 128 partitions) and used for analyses conducted at the MGH Center for Morphometric Analysis (CMA).
2.3 Image Analysis
Structural scans were transferred to the CMA and coded and catalogued for blind analysis. Image analysis, including preprocessing and segmentation of cerebral cortex and white matter was done in workstations using Cardviews software (Filipek et al. 1994; Caviness et al. 1996).
2.4 Cortical Thickness Analysis Procedure
The technique implemented herein is a method using a combination of automated routines and supplemented by semi-automated and manual procedures (Makris et al. 2008). Briefly, steps include: 1). Segmentation of the cerebral cortex using Cardviews; 2). Computation of cortical thickness differences using FreeSurfer (Dale et al. 1999) and; 3). Caret (Van Essen 2004) implementation for robust surface registration. For a more detailed and complete description of the methods we refer to previous publications of our groups (Makris et al. 2006; Makris et al. 2007; Makris et al. 2008) and to the detailed methods in the supplemental materials of this manuscript. Once segmentation is executed in Cardviews following a semi-automated procedure (see Figure 1A, 1B), the outline files created by the segmentation are converted to a FreeSurfer volume segmentation (Figure 1C). A surface is tessellated, smoothed (Figure 1D) and inflated (Figure 1E) from the converted FreeSurfer volume. An intensity gradient is then created throughout the cortex as a function of the distance from the white matter surface according to the manual segmentation of the cerebral cortex (Figure 1F) and the exterior surface is generated to be consistent with the manual segmentation (Figure 1G). These surfaces enable the computation of cortical topographical measurements such as cortical thickness, curvature, gyrification index and folding index (Dale et al. 1999). With the white and gray surfaces in place, thickness maps are created across the cerebral cortex.
Figure 1.

Illustration of the topological cortical parcellation (TCP) system. The overall approach is to segment and parcellate the cerebral cortex using Cardviews and then use FreeSurfer to compute cortical thickness differences. 1A shows an intensity normalized T1-weighted MR coronal image. Segmentation (1B) of the cerebral cortex is done in the Cardviews domain following mainly a manual procedure. The outline files created by the segmentation procedure (using Cardviews) is converted to a FreeSurfer volume (1C). A surface is tessellated, smoothed (1D) and inflated (1E) from the converted FreeSurfer volume. An intensity gradient is created throughout the cortex as a function of the distance from the white matter surface according to the manual segmentation of the cerebral cortex (1F). The exterior surface is generated to be consistent with the manual segmentation (1G). Using Caret software (Van Essen 2002); (Van Essen 2004) we draw manually visible anatomical landmarks, i.e., sulci, on the cortical surface of each subject. Then we run Caret surface registration to the Population-Average, Landmark- and Surface-based (PALS) atlas (Van Essen 2005) (1H). By registering each subject to a common space, each vertex on each subject can be mapped together to allow for inter-subject averaging. Maps are then created showing the cortical thickness differences between groups of subjects; colored regions show significant differences in cortical thickness between the two groups with red representing p < .05 and yellow p < .001. These regions are localized by overlaying the cortical parcellation map on the inflated surface (1I). Significant clusters from a vertex-wise omnibus F test of all four groups were identified using a general linear model.
The registration was done using the Caret software package (Van Essen 2004) by manually tracing visible anatomical landmarks, i.e., sulci, on the cortical surface of each subject (see Figure 2) and then registering to the Population Average, Landmark- and Surface-based (PALS) atlas (Van Essen 2005). This approach has been shown to be more robust in surface registration as compared to fully automated methods of registration (Pantazis et al. 2010). Given our a priori ROI driven hypothesis and neural systems-based approach, we think that this study benefits the most from the landmark-based technique as the anatomical regions adjacent to the landmarks are optimally registered (Zhong et al. 2010). The registration method uses a deformable, spherical registration that is constrained by the landmarks. This landmark-based spherical registration to the PALS atlas generates a deformation map of each subject’s cortical surface to align each subject into the common space (Figure 1H), and allows inter-subject averaging for computation of cortical thickness differences between groups. Colored regions show significant differences in cortical thickness from an omnibus F-test with red representing p < .05 and yellow p < .001. A parcellation scheme is mapped onto the template brain, which depicts the 49 cortical parcellation units (PUs), per hemisphere, as labeled by the CMA methodology and their approximate corresponding Brodmann’s areas, to localize results regionally (Figure 1I). It should be noted that this hybrid method is different from other available techniques, such as FreeSurfer, (which perform similar cortical measurements), with respect to two principal aspects. First, semi-automated and manual routines (Filipek et al. 1994; Caviness et al. 1996), which have been implemented as the gold standard to validate fully automated methodologies for segmentation (Fischl et al. 2002) were necessary to reliably and accurately obtain the cortical ribbon in each subject (Caviness et al. 1996; Makris et al. 2006). Furthermore, we used the Caret software to improve surface registration by manually drawing sulci on each subject’s cortical surface (Van Essen 2004). In all, this combined method allows for the interoperation between volume-based and surface-based topographic analysis, and extends the functionality of many existing segmentation schemes.
Figure 2.
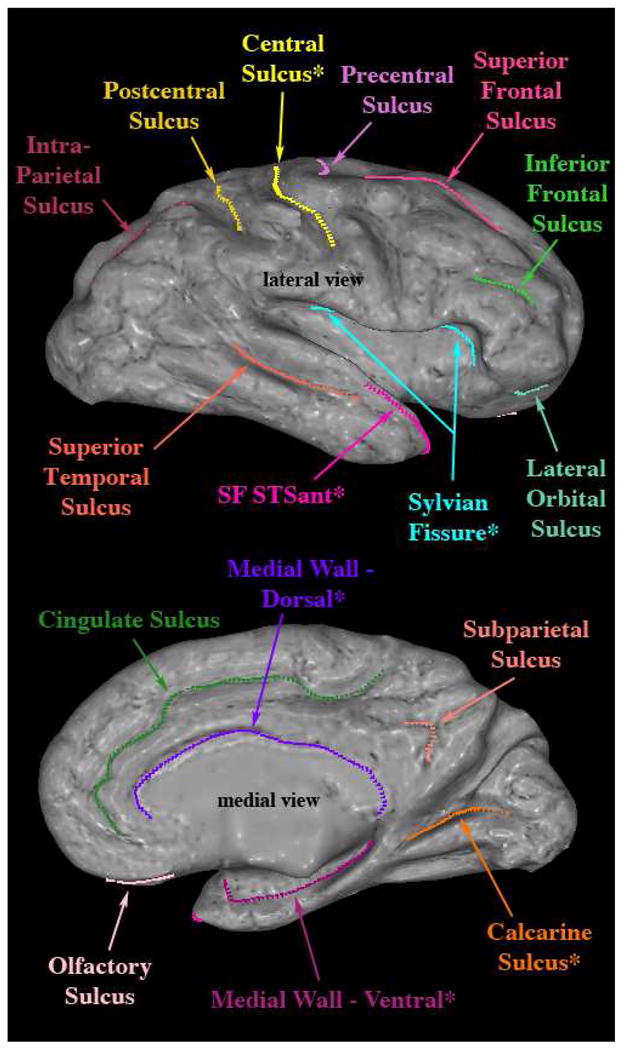
Example illustrating the landmarks traced on the right hemispheric surface of a single subject. Lateral and medial views shown. Landmarks with a ‘*’ indicate the six standard sulci supplied with Caret.
Abbreviations: SF STSant – Sylvian Fissure, Superior Temporal Sulcus anterior.
2.5 Reliability of sulci
In our study, the 32 landmarks (16 for each hemisphere), i.e., principally cerebral sulci, of five subjects were delineated twice by rater1 (DB), and once by rater2 (MG) in the Caret domain. To test intra-rater reliability of the manual delineation, for each landmark, we computed the Hausdorff distance between the two delineations of rater1. For inter-rater reliability, we calculated the Hausdorff distance between the first delineation of rater1 and the corresponding delineation of rater2. Hausdorff distance measures how close the two curves are, and would be zero if they were perfectly matched. So we would expect to see a smaller value if a landmark delineation reliability is high.
2.6 Data Analysis
Each subjects’ native space cortical thickness map was transformed to a target subject (PALS) using the Caret registration technique described above, and then smoothed using a Gaussian with fwhm of 10mm (full width at half maximum). Using a general linear model (GLM) we implemented a vertex-wise omnibus F-test to find regions that differed between controls and any psychopathological group (i.e., ADHD, BPD, or BPD+ADHD). The four group omnibus test was advantageous because it provided a single map that identified any areas where thickness differences were due to effects of ADHD, effects of BPD, or the interaction of the two disorders. A cluster was significant if each contiguous vertex had p<0.05 and a total area of at least 31.77 mm2 (Makris et al. 2008). Additionally, the surface of the target subject was parcellated in order to localize group differences. Each cluster is identified and labeled by the PU that is the primary constituent of that cluster.
For each subject, the mean cortical thickness of a cluster was calculated from all vertices that comprise that cluster. In each cluster, the subjects’ mean thickness was then modeled as a function of their ADHD status, BPD status, and an interaction term using linear regression. No covariates were used in the model. If the interaction term was not significant, it was removed from the regression model, and the independent effects of ADHD and BPD were reported in the form of beta weights. Using a model with the two main effects and their interaction allowed us to quantify the specific contribution of ADHD or BPD on the cortical thickness in each cluster, independent of the presence or absence of the other disorders. All tests were two-tailed with alpha set at 0.05.
3. RESULTS
3.1 Demographic Characteristics, Intellectual Functioning and Psychiatric Comorbidity
There were no significant group differences on age, sex, or handedness. Not surprisingly, significantly different IQ scores were shown across the 4 groups, and a trend difference was found in personal SES (i.e., subjects own occupational and educational status) and race (p <.10). Whole brain volume between the groups was comparable (Table 1).
Table 1.
Demographic Characteristics Comparing ADHD vs. Controls vs. Bipolar vs. Bipolar & ADHD*
| Controls N=23 |
ADHD N=26 |
Bipolar N=18 |
ADHD & Bipolar N=31 |
Test Statistic (df), p value | |
|---|---|---|---|---|---|
| Demographic Characteristics | Mean (Standard Deviation) | ||||
|
| |||||
| Age | 34.0 (9.6) | 36.9 (11.1) | 39.9 (6.5) | 35.7 (12.0) | F(3,94)= 1.16, p=0.329 |
| SES 1 | 1.7 (0.5) | 2.0 (1.1) | 2.4 (1.0) | 2.3 (1.2) | F(3,91)= 2.20, p=0.094 |
| Full Scale IQ Estimate | 115.6 ± 12.1 | 117.2 ± 13.5 | 102.7 ± 11.8 ab | 107.9 ± 12.0 ab | F(3,93)=6.5, p<0.001 |
| Whole Brain Volume | 1311.3 (149.1) | 1292.4 (90.2) | 1247.9 (155.4) | 1314.2 (131.3) | F(3,94)= 1.11, p=0.347 |
|
| |||||
| Frequency (Percent) | |||||
|
| |||||
| Gender (male) | 13(57) | 13(50) | 8(44) | 19(61) | χ2(1)= 1.6, p=0.670 |
| Handedness (right) | 21(91) | 25(96) | 16(89) | 24(80) | χ2(3)= 3.9, p=0.278 |
| Race (Caucasian) | 19(83) | 26(100) | 15(83) | 29(97) | χ2(3)= 7.5, p=0.057 |
| Medication status at scan | 1(4) | 1(4) | 11(61) ab | 13(42) ab | χ2(3)= 27.5, p<0.001 |
|
| |||||
| Psychiatric Comorbidity | Frequency (Percent) | ||||
|
| |||||
| Multiple (≥2) Anxiety Disorder 2 | 0 (0) | 4 (15) | 2 (25) | 4 (15) | χ2(3)= 5.0, p=0.174 |
| Antisocial Personality Disorder 2 | 0 (0) | 0 (0) | 0 (0) | 0 (0) | n/a |
| Substance Use Disorders 3 | 7 (30) | 13 (50) | 9 (50) | 7(23) | χ2(3)= 6.4, p=0.094 |
p<0.05 vs. ADHD;
p<0.05 vs. BPD
Table is identical to that presented in Biederman et al (2008).
Social class as measured by the Hollingshead scale (1975).
Presence of the disorder within one month of diagnostic interview. Due to missing data, sample sizes for the Bipolar and ADHD & Bipolar groups are 8 and 26, respectively.
Lifetime history of alcohol or drug abuse or dependence
3.2 Reliability of sulci
Intra-rater and inter-rater reliability for sulci tracing using the Hausdorff distance was high. Specifically, the overall mean difference was 1.32 mm for intra-rater and 1.68 mm for inter-rater measurements. Table 2 shows reliability measures for each one of the 32 landmarks.
Table 2.
The mean (in unit of mm) and standard deviation (std) of Hausdorff distances over five subjects are listed to quantify intra-rater and inter-rater reliability of the manual landmark delineation in Caret.
| landmark | hemisphere | Intra-Reliability | Inter-Reliability | ||
|---|---|---|---|---|---|
|
| |||||
| mean | std | mean | std | ||
|
| |||||
| cingulate | left | 1.1852 | 0.4635 | 1.8180 | 1.0275 |
| cingulate | right | 1.7086 | 0.5053 | 2.3540 | 1.2997 |
| i_frontal | left | 0.7077 | 0.1885 | 1.0483 | 0.6054 |
| i_frontal | right | 0.7136 | 0.1098 | 0.7997 | 0.1840 |
| inparietal | left | 1.2301 | 0.6217 | 1.7682 | 0.6505 |
| inparietal | right | 1.0295 | 0.3596 | 1.2269 | 0.2642 |
| LANDMARK.CalcarineSulcus | left | 1.5289 | 0.5693 | 2.3250 | 0.6082 |
| LANDMARK.CalcarineSulcus | right | 1.3415 | 0.6510 | 1.7009 | 0.4304 |
| LANDMARK.CentralSulcus | left | 1.3632 | 0.4059 | 1.7613 | 0.5633 |
| LANDMARK.CentralSulcus | right | 1.4654 | 0.5678 | 1.8872 | 0.7342 |
| LANDMARK.MedWall.DORSAL | left | 0.6495 | 0.1097 | 1.0429 | 0.3791 |
| LANDMARK.MedWall.DORSAL | right | 0.8447 | 0.1058 | 0.8516 | 0.4251 |
| LANDMARK.MedWall.VENTRAL | left | 2.8389 | 1.1521 | 2.5844 | 1.1094 |
| LANDMARK.MedWall.VENTRAL | right | 1.5977 | 0.4583 | 3.4432 | 1.2592 |
| LANDMARK.SF_STSant | left | 3.3281 | 2.3943 | 3.4782 | 1.0056 |
| LANDMARK.SF_STSant | right | 4.6988 | 1.6450 | 4.9360 | 3.6711 |
| LANDMARK.SylvianFissure | left | 0.9833 | 0.1077 | 1.5376 | 0.8652 |
| LANDMARK.SylvianFissure | right | 0.8748 | 0.2852 | 1.7063 | 1.0940 |
| latorbtl | left | 0.8229 | 0.3424 | 1.0449 | 0.3626 |
| latorbtl | right | 1.2689 | 0.7963 | 1.2322 | 0.6156 |
| olfactory | left | 1.0255 | 0.3604 | 1.8162 | 0.9977 |
| olfactory | right | 0.8838 | 0.2727 | 1.0773 | 0.5495 |
| postcentral | left | 1.3935 | 0.5920 | 1.6769 | 0.5800 |
| postcentral | right | 1.0974 | 0.3714 | 1.4340 | 1.0509 |
| precentral | left | 0.9420 | 0.2396 | 1.0111 | 0.3980 |
| precentral | right | 0.9371 | 0.2429 | 1.1427 | 0.3905 |
| sbparietal | left | 0.6939 | 0.2326 | 0.9939 | 0.2844 |
| sbparietal | right | 0.4673 | 0.1144 | 0.8568 | 0.3962 |
| s_frontal | left | 0.9522 | 0.2694 | 1.0293 | 0.5581 |
| s_frontal | right | 0.9758 | 0.3910 | 1.3251 | 0.4923 |
| s_temporal | left | 1.4186 | 0.5119 | 1.3575 | 0.4022 |
| s_temporal | right | 1.3132 | 0.1598 | 1.4926 | 0.7422 |
| Overall | 1.32 | 0.85 | 1.68 | 0.89 | |
3.3 Cortical Thickness
ROIs: By using the omnibus F-test we found 23 clusters of vertices in the right hemisphere and 13 in the left, which became the ROIs used in these analyses as shown in figure 3. Colored regions show significant differences in cortical thickness (Figure 3).
Figure 3.

Significant clusters from a vertex-wise omnibus F test of all four groups using a general linear model, identifying clusters that differed between controls and any psychopathological group (i.e., ADHD, BPD, or BPD+ADHD). Shown are the 36 significant clusters that surpassed a significance level of p<0.05 for each contiguous vertex and an area of at least 31.77 mm2 (Makris et al. 2008). Mean thickness values from these clusters were used as regions of interest for the regression model.
The 23 clusters of vertices localized to the right hemisphere comprised frontal, parietal, temporal and occipital regions (Figure 3). Frontal lobe regions included the frontal pole (FP, BA 10, 11), superior frontal gyrus (F1, BA 6, 8, 9), middle frontal gyrus (F2, BA 6, 8, 9, 46), perigenual anterior cingulate gyrus (perigACC or perigCGa, BA 24), dorsal anterior cingulate gyrus (dACC or dCGa, BA 24, 33) and paracingulate gyrus (PAC, BA 32), supplementary motor cortex (SMC, medial BA 6), and precentral gyrus (PRG, BA 4, and Caudal BA 6). Parietal cortical areas comprised the angular gyrus (AG, BA 39), and posterior part of supramarginal gyrus (SGp, caudal BA 40), superior parietal lobule (SPL, BA 5, 7). Temporal lobe regions included the temporal pole (TP, BA 38), posterior insula (pINS) and posterior part of parahippocampal gyrus (PHp, BA 27, 35). Several areas in the occipital lobe were involved, including the dorsolateral occipital area (OLs, BA 18, 19), lingual gyrus (LG, BA 17, 18) and the occipital pole (OP, BA 17, 18). Finally, there were also two clusters localized within temporooccipital transition areas, namely the dorsolateral temporooccipital region (TO2, BA 37) and the temporooccipital fusiform gyrus (TOF, BA 37). Of the above regions several were localized bilaterally. These were the frontal pole, precentral gyrus, caudal part of the supramarginal gyrus, temporooccipital fusiform gyrus, dorsolateral occipital and occipital pole areas. Finally, the cortical regions lateralized uniquely on the left hemisphere involved principally the parietal lobe at the posterior cingulate gyrus (CGp, BA 23, 31, 26, 29, 30), and precuneus (PCN, medial BA 7). The mean cortical thickness in each ROI is shown for each of the four groups (Table 3).
Table 3.
Mean cortical thickness in each significant cluster for each group.
| Controls (N=23) | ADHD (N=26) | BPD (N=18) | Comorbid (N=31) | |
|---|---|---|---|---|
| Mean ± SD (mm) | Mean ± SD (mm) | Mean ± SD (mm) | Mean ± SD (mm) | |
| ADHD Significantly Thinner | ||||
| Right F1 | 3.58 ± 0.41 | 3.35 ± 0.34 | 3.76 ± 0.45 | 3.44 ± 0.48 |
| Right F2 | 3.86 ± 0.45 | 3.43 ± 0.56 | 3.77 ± 0.49 | 3.67 ± 0.58 |
| Right F2 | 4.05 ± 0.52 | 3.67 ± 0.63 | 4.03 ± 0.7 | 3.57 ± 0.68 |
| Right FP/BA 9/10/11 | 3.72 ± 0.45 | 3.4 ± 0.58 | 3.49 ± 0.47 | 3.28 ± 0.5 |
| Right PRG/BA 4 | 3.62 ± 0.44 | 3.2 ± 0.47 | 3.67 ± 0.54 | 3.43 ± 0.76 |
| Right perigACC | 4.22 ± 0.44 | 4.03 ± 0.82 | 4.16 ± 0.64 | 3.66 ± 0.74 |
| Right pmCGa_dACC2 | 3.62 ± 0.39 | 3.49 ± 0.46 | 3.93 ± 0.51 | 3.55 ± 0.51 |
| Right SMC/BA 6 | 4.22 ± 0.55 | 3.81 ± 0.48 | 4.27 ± 0.63 | 3.94 ± 0.68 |
| Right SGp/BA 40 | 3.37 ± 0.45 | 3.15 ± 0.4 | 3.53 ± 0.42 | 3.31 ± 0.42 |
| Right SPL/BA 7 | 3.39 ± 0.41 | 3.06 ± 0.44 | 3.43 ± 0.44 | 3.29 ± 0.55 |
| Right OLs/BA 18/19 | 3.29 ± 0.37 | 2.99 ± 0.31 | 3.32 ± 0.44 | 3.07 ± 0.44 |
| Right OLs/BA 18/19 | 3.01 ± 0.41 | 2.64 ± 0.36 | 3.04 ± 0.54 | 2.83 ± 0.59 |
| Right TP | 4.11 ± 0.44 | 3.92 ± 0.5 | 4.31 ± 0.34 | 3.89 ± 0.58 |
| Right TP | 4.31 ± 0.44 | 4.11 ± 0.57 | 4.55 ± 0.64 | 4.07 ± 0.59 |
| Left FP/BA 9/10/11 | 4.05 ± 0.51 | 3.96 ± 0.73 | 4.21 ± 0.71 | 3.63 ± 0.72 |
| Left FP/BA 9/10/11 | 4.18 ± 0.49 | 3.97 ± 0.87 | 4.12 ± 0.66 | 3.61 ± 0.78 |
| Left PRG/BA 4 | 3.48 ± 0.34 | 3.19 ± 0.44 | 3.69 ± 0.67 | 3.33 ± 0.6 |
| Left CGp/BA 23 | 3.55 ± 0.38 | 3.38 ± 0.4 | 3.77 ± 0.41 | 3.41 ± 0.35 |
| Left PCN/BA 7 | 3.77 ± 0.48 | 3.48 ± 0.45 | 3.91 ± 0.5 | 3.67 ± 0.43 |
| Left PCN/BA 7 | 3.7 ± 0.48 | 3.45 ± 0.53 | 3.94 ± 0.55 | 3.51 ± 0.7 |
| Left OLs/BA 18/19 | 3.23 ± 0.45 | 2.89 ± 0.33 | 3.22 ± 0.35 | 2.98 ± 0.53 |
| BPD Significantly Thicker | ||||
| Right AG/BA 39 | 3.12 ± 0.31 | 2.97 ± 0.33 | 3.4 ± 0.38 | 3.27 ± 0.46 |
| Right pINS | 3.94 ± 0.47 | 3.78 ± 0.45 | 4.28 ± 0.38 | 4.07 ± 0.52 |
| Right TO2 | 3.15 ± 0.29 | 2.96 ± 0.27 | 3.25 ± 0.32 | 3.26 ± 0.45 |
| Right TOF/BA 37 | 2.8 ± 0.51 | 2.69 ± 0.45 | 3.16 ± 0.46 | 3.03 ± 0.63 |
| Left CGp/BA 23 | 3.41 ± 0.43 | 3.34 ± 0.41 | 3.77 ± 0.37 | 3.54 ± 0.49 |
| Left TOF/BA 37 | 2.43 ± 0.37 | 2.23 ± 0.39 | 2.55 ± 0.39 | 2.47 ± 0.3 |
| Right OLi | 2.99 ± 0.36 | 2.61 ± 0.41 | 2.83 ± 0.36 | 2.92 ± 0.61 |
| ADHD Thinner and BPD Thicker | ||||
| Right PHp | 2.66 ± 0.31 | 2.43 ± 0.25 | 2.85 ± 0.36 | 2.63 ± 0.32 |
| Right LG | 2.99 ± 0.31 | 2.88 ± 0.33 | 3.26 ± 0.31 | 3.07 ± 0.31 |
| Right OP | 2.63 ± 0.29 | 2.44 ± 0.36 | 2.86 ± 0.36 | 2.56 ± 0.52 |
| Left CGp/BA 23 | 2.92 ± 0.36 | 2.66 ± 0.37 | 3.01 ± 0.31 | 2.92 ± 0.35 |
| Left SGp/BA 40 | 3.27 ± 0.36 | 3.16 ± 0.41 | 3.58 ± 0.48 | 3.31 ± 0.49 |
| Left OP | 2.73 ± 0.34 | 2.51 ± 0.34 | 3.04 ± 0.42 | 2.69 ± 0.59 |
| Left OP | 2.56 ± 0.4 | 2.34 ± 0.4 | 2.86 ± 0.69 | 2.56 ± 0.74 |
| BPD Significantly Thinner | ||||
| Right FP/BA 9/10/11 | 4.14 ± 0.49 | 3.87 ± 0.77 | 3.84 ± 0.53 | 3.58 ± 0.85 |
Abbreviations: AG – angular gyrus; BA – Brodmann’s area; CGp – cingulate gyrus, posterior division; F1 – superior frontal gyrus; F2 – middle frontal gyrus; FP – frontal pole; LG – lingual gyrus; OLs – occipital lateral gyrus, superior division; OP – occipital pole; PCN – precuneus; perigACC – perigenual anterior cingulate cortex; PHp – parahippocampal gyrus, posterior division; pINS – posterior insula; pmCGa_dACC2 – posterior middle cingulate gyrus, anterior division, dorsal anterior cingulate cortex; PRG – precentral gyrus; SGp – supramarginal gyrus, posterior division; SMC – supplementary motor cortex; SPL – superior parietal lobule; TO2 – midddle temporal gyrus; TOF – temporo-occipital fusiform gyrus; TP – temporal pole.
3.4 Effect of ADHD and BPD
For each ROI an analysis was performed to examine separately the effect of ADHD and BPD. In the regression model the intercept represents the average thickness of the ROI without either ADHD or BPD effects (control average). The beta coefficients for ADHD and BPD represent the average increase or decrease in cortical thickness due to the respective factors. In all but one ROI showing an interaction effect in the ventrolateral surface of the visual association occipital region (OLi, BA 18, 19), there was no interaction between ADHD and BPD. Of note, the effects of ADHD were all decreases in cortical thickness, though not all statistically significant (Figure 4a and Table 4). In contrast, effects of BPD included increases and decreases in cortical thickness, however, all but one area that were statistically significant were increases (Figure 4a and Table 4). The one ROI, in which the BPD effect was decreased cortical thickness was the right ventral frontal pole.
Figure 4.


Figure 4a. Effect of ADHD controlling for BPD. Colored regions show clusters with significant (p<0.05) cortical thinning due to an independent ADHD effect. Color bar represents beta values from regression model.
Abbreviations: CGp – cingulate gyrus, posterior division; F1 – superior frontal gyrus; F2 – middle frontal gyrus; FP – frontal pole; LG – lingual gyrus; OLs – occipital lateral gyrus, superior division; OP – occipital pole; PCN – precuneus; perigACC – perigenual anterior cingulate cortex; PHp – parahippocampal gyrus, posterior division; pmCGa_dACC2 – posterior middle cingulate gyrus, anterior division, dorsal anterior cingulate cortex; PRG – precentral gyrus; SGp – supramarginal gyrus, posterior division; SMC – supplementary motor cortex; SPL – superior parietal lobule; TP – temporal pole.
Figure 4b. Effect of BPD controlling for ADHD. Colored regions show clusters with significant (p<0.05) independent BPD effect. Red colors represent thinning and blue colors represent thickening. Color bar represents beta values from regression model.
Abbreviations: AG – angular gyrus; CGp – cingulate gyrus, posterior division; FP – frontal pole; LG – lingual gyrus; OP – occipital pole; PHp – parahippocampal gyrus, posterior division; pINS – posterior insula; SGp – supramarginal gyrus, posterior division; TO2 – midddle temporal gyrus; TOF – temporo-occipital fusiform gyrus.
Figure 4c. Additive effect of ADHD+BPD. Cortical thickness of the comorbid condition depicted by combining the individual effect of each condition. Blue represents areas in which the comorbid group has thicker cortices than the control group. Red, orange and yellow represents areas in which the comorbid group has thinner cortices than the control group.
Abbreviations: AG – angular gyrus; CGp – cingulate gyrus, posterior division; F1 – superior frontal gyrus; F2 – middle frontal gyrus; FP – frontal pole; LG – lingual gyrus; OLs – occipital lateral gyrus, superior division; OP – occipital pole; PCN – precuneus; perigACC – perigenual anterior cingulate cortex; PHp – parahippocampal gyrus, posterior division; pINS – posterior insula; pmCGa_dACC2 – posterior middle cingulate gyrus, anterior division, dorsal anterior cingulate cortex; PRG – precentral gyrus; SGp – supramarginal gyrus, posterior division; SMC – supplementary motor cortex; SPL – superior parietal lobule; TO2 – midddle temporal gyrus; TOF – temporo-occipital fusiform gyrus; TP – temporal pole.
Table 4.
Cortical thickness in total sample of four groups of subjects (n=98), predicted by ADHD and BPD
| ADHD Effect β [95% CI] |
BPD Effect β [95% CI] |
Intercept β [95% CI] |
|
|---|---|---|---|
| ADHD SIGNIFICANTLY THINNER | |||
| Right F1 | −0.28 [−0.45, −0.10]** | 0.12 [−0.05, 0.29] | 3.61 [3.46, 3.76] |
| Right F2 | −0.27 [−0.49, −0.05]* | 0.10 [−0.12, 0.31] | 3.78 [3.59, 3.97] |
| Right F2 | −0.42 [−0.68, −0.16]** | −0.07 [−0.32, 0.19] | 4.07 [3.84, 4.30] |
| Right FP/BA 9/10/11 | −0.27 [−0.47, −0.06]* | −0.17 [−0.37, 0.04] | 3.69 [3.51, 3.87] |
| Right PRG/BA 4 | −0.33 [−0.57, −0.10]** | 0.15 [−0.08, 0.39] | 3.58 [3.37, 3.78] |
| Right perigACC | −0.34 [−0.62, −0.06]* | −0.24 [−0.52, 0.03] | 4.30 [4.01, 4.55] |
| Right pmCGa_dACC2 | −0.25 [−0.45, −0.06] | 0.17 [−0.03, 0.36] | 3.68 [3.51, 3.85] |
| Right SMC/BA 6 | −0.37 [−0.61, −0.13]** | 0.10 [−0.14, 0.34] | 4.20 [3.99, 4.41] |
| Right SGp/BA 40 | −0.22 [−0.39, −0.05]* | 0.16 [−0.01, 0.33] | 3.37 [3.22, 3.52] |
| Right SPL/BA 7 | −0.24 [−0.43, −0.04]* | 0.15 [−0.04, 0.34] | 3.34 [3.17, 3.51] |
| Right OLs/BA 18/19 | −0.28 [−0.43, −0.12]*** | 0.06 [−0.10, 0.22] | 3.28 [3.14, 3.41] |
| Right OLs/BA 18/19 | −0.29 [−0.49, −0.10]** | 0.12 [−0.07, 0.32] | 2.97 [2.79, 3.14] |
| Right TP | −0.30 [−0.50, −0.10]** | 0.07 [−0.13, 0.27] | 4.17 [3.99, 4.34] |
| Right TP | −0.33 [−0.56, −0.10]** | 0.08 [−0.15, 0.30] | 4.38 [4.18, 4.58] |
| Left FP/BA 9/10/11 | −0.35 [−0.61, −0.04]* | −0.12 [−0.40, 0.16] | 4.17 [3.93, 4.42] |
| Left FP/BA 9/10/11 | −0.35 [−0.65, −0.05]* | −0.23 [−0.53, 0.06] | 4.25 [3.99, 4.51] |
| Left PRG/BA 4 | −0.32 [−0.54, −0.11]** | 0.17 [−0.04, 0.38] | 3.50 [3.31, 3.69] |
| Left CGp/BA 23 | −0.26 [−0.42, −0.11]** | 0.11 [−0.04, 0.27] | 3.60 [3.46, 3.73] |
| Left PCN/BA 7 | −0.26 [−0.45, −0.08]** | 0.17 [−0.01, 0.36] | 3.75 [3.59, 3.92] |
| Left PCN/BA 7 | −0.34 [−0.57, −0.10]** | 0.14 [−0.10, 0.37] | 3.75 [3.54, 3.95] |
| Left OLs/BA 18/19 | −0.29 [−0.47, −0.11]** | 0.05 [−0.13, 0.22] | 3.20 [3.05, 3.36] |
| BPD SIGNIFICANTLY THICKER | |||
| Right AG/BA 39 | −0.15 [−0.30, 0.01] | 0.30 [0.14, 0.45]*** | 3.12 [2.98, 3.25] |
| Right pINS | −0.19 [−0.38, 0.002] | 0.31 [0.12, 0.50]*** | 3.95 [3.79, 4.12] |
| Right TO2 | −0.10 [−0.24, 0.05] | 0.21 [0.07, 0.35]** | 3.10 [2.98, 3.23] |
| Right TOF/BA 37 | −0.12 [−0.33, 0.10] | 0.34 [0.13, 0.56]** | 2.81 [2.62, 3.00] |
| Left CGp/BA 23 | −0.14 [−0.32, 0.04] | 0.27 [0.09, 0.44]** | 3.45 [3.29, 3.60] |
| Left TOF/BA 37 | −0.14 [−0.30, 0.008] | 0.19 [0.04, 0.34]* | 2.40 [2.27. 2.53] |
| Right OLi | Interaction effect p=0.02‡ | ||
| ADHD THINNER AND BPD THICKER | |||
| Right PHp | −0.22 [−0.35, −0.10]*** | 0.20 [0.07, 0.32]** | 2.65 [2.55, 2.76] |
| Right LG | −0.15 [−0.27, −0.02]* | 0.22 [0.10, 0.35]*** | 3.01 [2.90, 3.12] |
| Right OP | −0.24 [−0.41, −0.08]** | 0.17 [0.006, 0.33]* | 2.66 [2.51, 2.80] |
| Left CGp/BA 23 | −0.18 [−0.32, −0.04]* | 0.18 [0.04, 0.32]* | 2.88 [2.76, 3.00] |
| Left SGp/BA 40 | −0.18 [−0.36, −0.005]* | 0.21 [0.04, 0.39]* | 3.31 [3.15, 3.47] |
| Left OP | −0.28 [−0.47, −0.10]** | 0.23 [0.05, 0.41]* | 2.77 [2.61, 2.93] |
| Left OP | −0.26 [−0.50, −0.03]* | 0.26 [0.02, 0.49]* | 2.58 [2.37, 2.79] |
| BPD SIGNIFICANTLY THINNER | |||
| Right FP/BA 9/10/11 | −0.26 [−0.55, 0.02] | −0.29 [−0.57, −0.008]* | 4.14 [3.89, 4.39] |
p≤0.05,
p≤0.01,
p≤0.001
Abbreviations: AG – angular gyrus; BA – Brodmann’s area; CGp – cingulate gyrus, posterior division; F1 – superior frontal gyrus; F2 – middle frontal gyrus; FP – frontal pole; LG – lingual gyrus; OLs – occipital lateral gyrus, superior division; OP – occipital pole; PCN – precuneus; perigACC – perigenual anterior cingulate cortex; PHp – parahippocampal gyrus, posterior division; pINS – posterior insula; pmCGa_dACC2 – posterior middle cingulate gyrus, anterior division, dorsal anterior cingulate cortex; PRG – precentral gyrus; SGp – supramarginal gyrus, posterior division; SMC – supplementary motor cortex; SPL – superior parietal lobule; TO2 – midddle temporal gyrus; TOF – temporo-occipital fusiform gyrus; TP – temporal pole.
3.5 Comorbid ADHD plus BPD condition-Additive Effect
Because there was only one statistical interaction (as noted above) between the effects of ADHD and BPD in cortical thickness, cortical thickness of the comorbid condition can be accurately predicted by combining the individual effect of each condition (Figure 4c). This resulted in three classes of findings. 1) In most ROIs, ADHD decreased cortical thickness and BPD increased cortical thickness and thus the combination of the two produced an intermediate effect; 2) in some areas there was little effect of one of the conditions and the combination of the two produced an effect very similar to the predominant condition, and 3) in a few ROIs, the effect of both conditions was a decrease in cortical thickness for both conditions and the combined condition produced a much thinner cortex than either condition alone (notably the frontal pole).
4. DISCUSSION
In this cortical thickness analysis, we found a striking pattern of different effects attributable to ADHD and BPD that were independent of the other condition. The ADHD effect was a statistically significant decrease in cortical thickness in a number of regions across the cortex that support executive and attentional functions. In contrast, the BPD effect was a statistically significant increase in cortical thickness in several brain regions with the exception of the frontal pole, which showed a decrease in both BPD and ADHD. Given that there were minimal interaction effects, these results indicate that the cortical thickness of the comorbid group can be accurately predicted by combining the individual effects of ADHD and BPD observed individually.
Our observations with respect to the ADHD effect replicated already published observations (Sowell et al. 2003; Makris et al. 2007; Almeida et al. 2010; Batty et al. 2010), which indicate cortical thinning of frontal and parietal cortical regions in both the dorsolateral and dorsomedial aspects of the hemispheric surface. Likewise, the BPD effects demonstrated cortical thinning in frontopolar areas (FP) and cortical thickening in an array of temporal, parietal and occipital regions in this sample of adults with BPD. This reduction in cortical thickness in the FP is predicted and largely consistent with the neurobehavioral literature (Lyoo et al. 2006; Fornito et al. 2008; Rimol et al. 2010), however the presence of significant cortical thickening is less well established. However, the findings of a pattern following a dorsal and a ventral stream of distribution in the cortical surface are novel. Future studies will need to assess whether this pattern is associated with neural systems alterations involving both cortical and white matter fibers (Makris et al. 2009).
The cortical thinning abnormalities in the dorsal-cortical and the ventral-limbic system are consistent with the neuroimaging literature on ADHD and bipolar disorders. Cortical thinning has been shown in ADHD in dorsal systems involving DLPFC and medial frontal regions (Makris et al. 2007). Likewise, cortical alterations have been reported in BPD in left rostral paracingulate and right dorsal paracingulate regions using a semi-automated approach (Fornito et al. 2008). Cortical abnormalities have also been shown in BPD using a fully automated method in left dorsal-anterior and posterior cingulate regions, left occipital region, left precentral area, left and right middle frontal area, right medial frontal, frontopolar and orbitofrontal cortex, right postcentral and angular regions as well as right lateral occipital areas (Lyoo et al. 2006).
Our findings indicate that comorbid ADHD with BPD presents a morphometric profile reflecting an additive effect of both ADHD and BPD cortical abnormalities (Lyoo et al. 2006; Makris et al. 2007; Fornito et al. 2008), similar to what we observed in the same sample with volumetric imaging (Biederman et al. 2008). Individuals with comorbid ADHD+BPD showed cortical thinning within both the dorsal-cortical system (i.e., DLPFC, dorsolateral and medial frontal pole, anterior cingulate gyrus and paracingulate gyrus) as well as in the ventral-limbic system (i.e., medial frontal cortex and ventral frontopolar cortices) bilaterally. These alterations in prefrontal limbic circuitry reflect a disruption in regions governing cognitive control of affective and hedonic functions, as well as self-monitoring, attention and executive functions.
The dorsal-cortical system (including the DLPFC, dorsal FP, ACC and PAC) has been associated with cognitive aspects of negative emotion such as apathy, psychomotor slowing as well as attentional and executive function deficits. In contrast, the ventral-limbic system containing limbic and paralimbic structures (such as the ventral FP, ventral prefrontal cortex, subcallosal cortex, insula, and temporal pole) deals with aspects of autonomic behavior (Mayberg 2002).
Interestingly, among all structures, the most affected structure was the frontal pole (FP, BA 10) bilaterally, which belongs to both dorsal-cortical and ventral-limbic systems. This cortical region shows unique features in terms of its topography, histology, anatomical connections and function (Ramnani and Owen 2004). Topographically, it unites its dorsolateral and ventral aspects bridging BA 10 with BA 9 and 46 of the DLPFC with BA 32 of the mPFC and BA 11 and 47 of the ventral PFC. Structurally, its high content and density in dendritic spines (Jacobs et al. 2001) and functionally, its role in a variety of cognitive and emotional processes such as memory (Duzel et al. 1999; Burgess et al. 2001), attention (Koechlin et al. 1999), planning and reasoning, relational integration between objects or thoughts (Kroger et al. 2002), and processing of internal states (Christoff and Gabrieli 2000), make the frontopolar region a potential processor for the integration of cognitive and emotional information. Future studies are needed to determine whether these abnormalities are specific to this particular comorbid diagnosis.
Although the exact etiology of the cortical thinning findings remains unclear, it can be hypothesized that they represent alterations of cells, neuropil, synaptic densities as well as local fibers or long corticocortical fiber pathways. More work is needed to elucidate the etiology of these neurobiological changes in the cortex in subjects with ADHD+BPD.
Our findings should be interpreted in light of some methodological limitations such as registration errors inherent to inter-subject mapping due to a high degree in inter-individual variability of cortical surface topography. Limitations are also due in part to the transformation procedure, as well as the potentially ill-posed nature of inter-subject correspondence in topology. While inferior parietal lobule alterations have been documented in both ADHD and BPD, in the present study of comorbid ADHD with BPD, we did not find any significant cortical alterations in this region. Whether this may be due to population criteria differences or differences in method remains an open question. Also, differences in our findings may have resulted from the fact that these are comorbid cases rather than ADHD or BPD alone. Furthermore, because the medication status was heterogeneous, we could not address the impact of medication adequately. More work is needed to further elucidate these important issues.
Despite these considerations, our study shows that the effects of ADHD and BPD on cortical thickness are primarily independent and often in contrasting directions. Since ADHD was consistently associated with decreased cortical thickness, and BPD was predominantly associated with increased cortical thickness, the additive effects resulted in less cortical thickness alterations. A notable exception was the frontal pole in which cortical thickness was decreased by both conditions. To the best of our knowledge, this is the first neuroimaging documentation showing that in comorbid ADHD+BPD subjects, the cerebral cortex is affected in networks that support cognitive and emotional processes and in cortical centers responsible for vital cortical-limbic interactions and integration localized principally in the frontal lobe.
Supplementary Material
Acknowledgments
The authors would like to thank Sharmila Bandyopadhyay, Katherine Crum, Kalika Kelkar, Alexandra Lomedico, Snezana Milanovic, Michael Monuteaux, Michael Schiller, Heidi Thermenos, Michael Vitulano, and our research study volunteers for their generous assistance. This research was primarily supported by a grant from the NIMH MH 62152 (LJS) and the National Alliance for Research on Schizophrenia and Depression Distinguished Investigator Award (JB). Preparation of this article was also supported in part by grants from: NIDA 1R01DA027804-01, NIMH 1R21MH084041-01A1, ARRA-NIH-NCCAM (NM); Janssen Pharmaceuticals and the Johnson and Johnson Center for the Study of Psychopathology (JB); the Fairway Trust (DK); National Research Service Award (NIMH F32 MH065040-01A1), Peter Livingston Fellowship through the Harvard Medical School Department of Psychiatry, and the Clinical Research Training Program Fellowship in Biological and Social Psychiatry MH-16259 (EMV); The National Center for Research Resources (P41RR14075); the March of Dimes Foundation (LJS), and the Mental Illness and Neuroscience Discovery (MIND) Institute (LJS).
Footnotes
Location of work: Clinical and Research Program in Pediatric Psychopharmacology and Adult ADHD, Psychiatry Department, Massachusetts General Hospital (MGH), Boston, MA; and MGH/MIT/HMS Athinoula A. Martinos Center for Functional and Structural Biomedical Imaging, Charlestown, MA 02129
Disclosures: Dr. Joseph Biederman is currently receiving research support from the following sources: Elminda, Janssen, McNeil, and Shire. In 2010, Dr. Joseph Biederman received speaker’s fees for a foundation sponsored talk on ADHD in Monterey, Mexico and the MGH academy for a tuition supported CME program. In 2009, Dr. Joseph Biederman received a speaker’s fee from the following sources: Fundacion Areces, Medice Pharmaceuticals, and the Spanish Child Psychiatry Association. In previous years, Dr. Joseph Biederman received research support, consultation fees, or speaker’s fees for/from the following additional sources: Abbott, Alza, AstraZeneca, Bristol Myers Squibb, Celltech, Cephalon, Eli Lilly and Co., Esai, Forest, Glaxo, Gliatech, Janssen, McNeil, Merck, NARSAD, NIDA, New River, NICHD, NIMH, Novartis, Noven, Neurosearch, Organon, Otsuka, Pfizer, Pharmacia, The Prechter Foundation, Shire, The Stanley Foundation, UCB Pharma, Inc. and Wyeth. Dr. Thomas Spencer has received research support from, has been a speaker for or on a speaker bureau or has been an Advisor or on an Advisory Board of the following sources: Shire Laboratories, Inc, Eli Lilly & Company, Glaxo-Smith Kline, Janssen Pharmaceutical, McNeil Pharmaceutical, Novartis Pharmaceuticals, Cephalon, Pfizer, the National Institute of Mental Health and royalties on adult ADHD scales (research support). In the past year, Dr. Faraone has received consulting fees and has been on Advisory Boards for Shire Development and has received research support from Pfizer, Shire and the National Institutes of Health. In previous years, Dr. Faraone has received consulting fees or has been on Advisory Boards or has participated in continuing medical education programs sponsored by: Shire, McNeil, Janssen, Novartis, Pfizer and Eli Lilly. In previous years he has received research support from Eli Lilly, Shire, Pfizer and the National Institutes of Health. Dr. Faraone receives royalties from a book published by Guilford Press: Straight Talk about Your Child’s Mental Health. Dr. Eve M. Valera has a financial relationship with Eli Lilly (travel grant), Shire Pharmaceuticals (honoraria), and Ortho-McNeil Janssen Scientific (honoraria). The following authors do not have any conflicts of interest to declare: Nikos Makris, Larry J. Seidman, Jonathan R. Kaiser, Carter Petty, Lichen Liang, Ariel Brown, Megan Aleardi, Denise Boriel, Carly S. Henderson, Michelle Giddens.
Publisher's Disclaimer: This is a PDF file of an unedited manuscript that has been accepted for publication. As a service to our customers we are providing this early version of the manuscript. The manuscript will undergo copyediting, typesetting, and review of the resulting proof before it is published in its final citable form. Please note that during the production process errors may be discovered which could affect the content, and all legal disclaimers that apply to the journal pertain.
References
- Almeida LG, Ricardo-Garcell J, Prado H, Barajas L, Fernandez-Bouzas A, Avila D, Martinez RB. Reduced right frontal cortical thickness in children, adolescents and adults with ADHD and its correlation to clinical variables: A cross-sectional study. Journal Psychiatric Research. 2010;44:1214–1223. doi: 10.1016/j.jpsychires.2010.04.026. [DOI] [PubMed] [Google Scholar]
- Batty MJ, Liddle EB, Pitiot A, Toro R, Groom MJ, Scerif G, Liotti M, Liddle PF, Paus T, Hollis C. Cortical gray matter in attention-deficit/hyperactivity disorder: a structural magnetic resonance imaging study. Journal of the American Academy of Child and Adolesccent Psychiatry. 2010;49:229–238. doi: 10.1016/j.jaac.2009.11.008. [DOI] [PMC free article] [PubMed] [Google Scholar]
- Biederman J, Faraone SV, Wozniak J, Mick E, Kwon A, Cayton GA, Clark SV. Clinical correlates of bipolar disorder in a large, referred sample of children and adolescents. Journal of Psychiatric Research. 2005;39:611–622. doi: 10.1016/j.jpsychires.2004.08.003. [DOI] [PubMed] [Google Scholar]
- Biederman J, Makris N, Valera EM, Monuteaux MC, Goldstein JM, Buka S, Boriel DL, Bandyopadhyay S, Kennedy DN, Caviness VS, Bush G, Aleardi M, Hammerness P, Faraone SV, Seidman LJ. Towards further understanding of the co-morbidity between attention deficit hyperactivity disorder and bipolar disorder: a MRI study of brain volumes. Psychol Med. 2008;38:1045–1056. doi: 10.1017/S0033291707001791. [DOI] [PubMed] [Google Scholar]
- Biederman J, Mick E, Wozniak J, Monuteaux M, Galdo M, Faraone S. Can a subtype of conduct disorder linked to bipolar disorder be identified? Integration of findings from the Massachusetts General Hospital Pediatric Psychopharmacology Research Program. Biological Psychiatry. 2003;53:952–960. doi: 10.1016/s0006-3223(03)00009-x. [DOI] [PubMed] [Google Scholar]
- Burgess PW, Gilbert SJ, Dumontheil I. Function and localization within rostral prefrontal cortex (area 10) Philosophical Transactions of the Royal Society B: Biological Sciences. 2007;362:887–899. doi: 10.1098/rstb.2007.2095. [DOI] [PMC free article] [PubMed] [Google Scholar]
- Burgess PW, Quayle A, Frith CD. Brain regions involved in prospective memory as determined by positron emission tomography. Neuropsychologia. 2001;39:545–555. doi: 10.1016/s0028-3932(00)00149-4. [DOI] [PubMed] [Google Scholar]
- Caviness VS, Jr, Meyer J, Makris N, Kennedy DN. MRI-based topographic parcellation of human neocortex: an anatomically specified method with estimate of reliability. Journal of Cognitive Neuroscience. 1996;8:566–587. doi: 10.1162/jocn.1996.8.6.566. [DOI] [PubMed] [Google Scholar]
- Christoff K, Gabrieli JDE. The frontopolar cortex and human cognition: evidence for a rostrocaudal heirachical organisation within the human prefrontal cortex. Psychobiology. 2000;28:168–186. [Google Scholar]
- Dale AM, Fischl B, Sereno MI. Cortical surface-based analysis. I. Segmentation and surface reconstruction. Neuroimage. 1999;9:179–194. doi: 10.1006/nimg.1998.0395. [DOI] [PubMed] [Google Scholar]
- Dubuisson MP, Jain AK. A modified Hausdorff distance for object matching. Proceedings of the 12th IAPR International Conference on Pattern Recognition. 1994;1:566–568. [Google Scholar]
- Duzel E, Cabeza R, Picton TW, Yonelinas AP, Scheich H, Heinze HJ, Tulving E. Task-related and item-related brain processes of memory retrieval. Proceedings of the National Academy of Sciences of the United States of America. 1999;96:1794–1799. doi: 10.1073/pnas.96.4.1794. [DOI] [PMC free article] [PubMed] [Google Scholar]
- Faraone S, Glatt S, Tsuang M. The genetics of pediatric onset bipolar disorder. Biological Psychiatry. 2003;53:970–977. doi: 10.1016/s0006-3223(02)01893-0. [DOI] [PubMed] [Google Scholar]
- Filipek PA, Richelue C, Kennedy DN, Caviness VS. The young adult human brain: An MRI-based morphometric study. Cerebral Cortex. 1994;267:344–360. doi: 10.1093/cercor/4.4.344. [DOI] [PubMed] [Google Scholar]
- First M, Spitzer R, Gibbon M, Williams J. Structured Clinical Interview for DSM-IV Axis I Disorders. American Psychiatric Press; Washington, D.C: 1997. [Google Scholar]
- Fischl B, Salat DH, Busa E, Albert M, Dieterich M, Haselgrove C, van der Kouwe A, Killiany R, Kennedy D, Klaveness S, Montillo A, Makris N, Rosen B, Dale AM. Whole brain segmentation: automated labeling of neuroanatomical structures in the human brain. Neuron. 2002;33:341–355. doi: 10.1016/s0896-6273(02)00569-x. [DOI] [PubMed] [Google Scholar]
- Fornito A, Malhi GS, Lagopoulos J, Ivanovski B, Wood SJ, Saling MM, Pantelis C, Yucel M. Anatomical abnormalities of the anterior cingulate and paracingulate cortex in patients with bipolar I disorder. Psychiatry Research Neuroimaging. 2008;162:123–132. doi: 10.1016/j.pscychresns.2007.06.004. [DOI] [PubMed] [Google Scholar]
- Jacobs B, Schall M, Prather M, Kapler E, Driscoll L, Baca S, Jacobs J, Ford K, Wainwright M, Treml M. Regional dendritic and spine variation in human cerebral cortex: a quantitative golgi study. Cerebral Cortex. 2001;11:558–571. doi: 10.1093/cercor/11.6.558. [DOI] [PubMed] [Google Scholar]
- Koechlin E, Basso G, Pietrini P, Panzer S, Grafman J. The role of the anterior prefrontal cortex in human cognition. Nature. 1999;399:148–151. doi: 10.1038/20178. [DOI] [PubMed] [Google Scholar]
- Kroger JK, Sabb FW, Fales CL, Bookheimer SY, Cohen MS, Holyoak KJ. Recruitment of anterior dorsolateral prefrontal cortex in human reasoning: a parametric study of relational complexity. Cerebral Cortex. 2002;12:477–485. doi: 10.1093/cercor/12.5.477. [DOI] [PubMed] [Google Scholar]
- Lyoo IK, Sung YH, Dager SR, Friedman SD, Lee JY, Kim SJ, Kim N, Dunner DL, Renshaw PF. Regional cerebral cortical thinning in bipolar disorder. Bipolar Disord. 2006;8:65–74. doi: 10.1111/j.1399-5618.2006.00284.x. [DOI] [PubMed] [Google Scholar]
- Makris N, Biederman J, Monuteaux MC, Seidman LJ. Towards conceptualizing a neural systems-based anatomy of attention-deficit/hyperactivity disorder. Dev Neurosci. 2009;31:36–49. doi: 10.1159/000207492. [DOI] [PMC free article] [PubMed] [Google Scholar]
- Makris N, Biederman J, Valera EM, Bush G, Kaiser J, Kennedy DN, Caviness VS, Faraone SV, Seidman LJ. Cortical Thinning of the Attention and Executive Function Networks in Adults with Attention-Deficit/Hyperactivity Disorder. Cereb Cortex. 2007;17:1364–1375. doi: 10.1093/cercor/bhl047. [DOI] [PubMed] [Google Scholar]
- Makris N, Gasic GP, Kennedy DN, Hodge SM, Kaiser JR, Lee MJ, Kim BW, Blood AJ, Evins AE, Seidman LJ, Iosifescu DV, Lee S, Baxter C, Perlis RH, Smoller JW, Fava M, Breiter HC. Cortical thickness abnormalities in cocaine addiction--a reflection of both drug use and a pre-existing disposition to drug abuse? Neuron. 2008;60:174–188. doi: 10.1016/j.neuron.2008.08.011. [DOI] [PMC free article] [PubMed] [Google Scholar]
- Makris N, Kaiser J, Haselgrove C, Seidman LJ, Biederman J, Boriel D, Valera EM, Papadimitriou GM, Fischl B, Caviness VS, Jr, Kennedy DN. Human cerebral cortex: a system for the integration of volume- and surface-based representations. Neuroimage. 2006;33:139–153. doi: 10.1016/j.neuroimage.2006.04.220. [DOI] [PubMed] [Google Scholar]
- Mayberg H. Mapping mood: an evolving emphasis on frontal-limbic interactions. In: Stuss DT, Knight RT, editors. Principles of frontal lobe function. Oxford University Press; New York: 2002. [Google Scholar]
- Orvaschel H. Schedule for Affective Disorder and Schizophrenia for School-Age Children Epidemiologic Version. Nova Southeastern University, Center for Psychological Studies; Ft. Lauderdale: 1994. [Google Scholar]
- Pantazis D, Joshi A, Jiang J, Shattuck DW, Bernstein LE, Damasio H, Leahy RM. Comparison of landmark-based and automatic methods for cortical surface registration. NeuroImage. 2010;49:2479–2493. doi: 10.1016/j.neuroimage.2009.09.027. [DOI] [PMC free article] [PubMed] [Google Scholar]
- Ramnani N, Owen AM. Anterior prefrontal cortex: insights into function from anatomy and neuroimaging. Nature Reviews Neuroscience. 2004;5:184–194. doi: 10.1038/nrn1343. [DOI] [PubMed] [Google Scholar]
- Rimol LM, Panizzon MS, Fennema-Notestine C, Eyler LT, Fischl B, Franz CE, Hagler DJ, Lyons MJ, Neale MC, Pacheco J, Perry ME, Schmitt JE, Grant MD, Seidman LJ, Thermenos HW, Tsuang MT, Eisen SA, Kremen WS, Dale AM. Cortical thickness is influenced by regionally specific genetic factors. Biological Psychiatry. 2010;67:493–499. doi: 10.1016/j.biopsych.2009.09.032. [DOI] [PMC free article] [PubMed] [Google Scholar]
- Sachs GS, Baldassano CF, Truman CJ, Guille C. Comorbidity of attention deficit hyperactivity disorder with early- and late-onset bipolar disorder. American Journal of Psychiatry. 2000;157:466–468. doi: 10.1176/appi.ajp.157.3.466. [DOI] [PubMed] [Google Scholar]
- Seidman LJ. Neuropsychological functioning in people with ADHD across the lifespan. Clinical Psychology Review. 2006;26:466–485. doi: 10.1016/j.cpr.2006.01.004. [DOI] [PubMed] [Google Scholar]
- Shaw P, Eckstrand K, Sharp W, Blumenthal J, Lerch JP, Greenstein D, Clasen L, Evans A, Giedd J, Rapoport JL. Attention-deficit/hyperactivity disorder is characterized by a delay in cortical maturation. Proceedings of the National Academy of Sciences of the United States of America. 2007;104:19649–19654. doi: 10.1073/pnas.0707741104. [DOI] [PMC free article] [PubMed] [Google Scholar]
- Sowell ER, Thompson PM, Welcome SE, Henkenius AL, Toga AW, Peterson BS. Cortical abnormalities in children and adolescents with attention-deficit hyperactivity disorder. Lancet. 2003;362:1699–1707. doi: 10.1016/S0140-6736(03)14842-8. [DOI] [PubMed] [Google Scholar]
- Strange BA, Henson RN, Friston KJ, Dolan RJ. Anterior prefrontal cortex mediates rule learning in humans. Cerebral Cortex. 2001;11:1040–1046. doi: 10.1093/cercor/11.11.1040. [DOI] [PubMed] [Google Scholar]
- Thermenos HW, Goldstein JM, Milanovic SM, Whitfield-Gabrieli S, Makris N, Laviolette P, Koch JK, Faraone SV, Tsuang MT, Buka SL, Seidman LJ. An fMRI study of working memory in persons with bipolar disorder or at genetic risk for bipolar disorder. American Journal of Medical Genetics Part B: Neuropsychiatric Genetics. 2010;153B:120–131. doi: 10.1002/ajmg.b.30964. [DOI] [PMC free article] [PubMed] [Google Scholar]
- Van Essen DC. Windows on the brain: the emerging role of atlases and databases in neuroscience. Current Opinion in Neurobiology. 2002;12:574–579. doi: 10.1016/s0959-4388(02)00361-6. [DOI] [PubMed] [Google Scholar]
- Van Essen DC. Surface-based approaches to spatial localization and registration in primate cerebral cortex. Neuroimage. 2004;23(Suppl 1):S97–107. doi: 10.1016/j.neuroimage.2004.07.024. [DOI] [PubMed] [Google Scholar]
- Van Essen DC. A Population-Average, Landmark- and Surface-based (PALS) atlas of human cerebral cortex. Neuroimage. 2005;28:635–662. doi: 10.1016/j.neuroimage.2005.06.058. [DOI] [PubMed] [Google Scholar]
- Wechsler D. Manual for the Wechsler Adult Intelligence Scale - Revised. The Psychological Corporation; San Antonio: 1981. [Google Scholar]
- Zhong J, Phua DY, Qiu A. Quantitative evaluation of LDDMM, FreeSurfer, and CARET for cortical surface mapping. NeuroImage. 2010;52:131–141. doi: 10.1016/j.neuroimage.2010.03.085. [DOI] [PubMed] [Google Scholar]
Associated Data
This section collects any data citations, data availability statements, or supplementary materials included in this article.