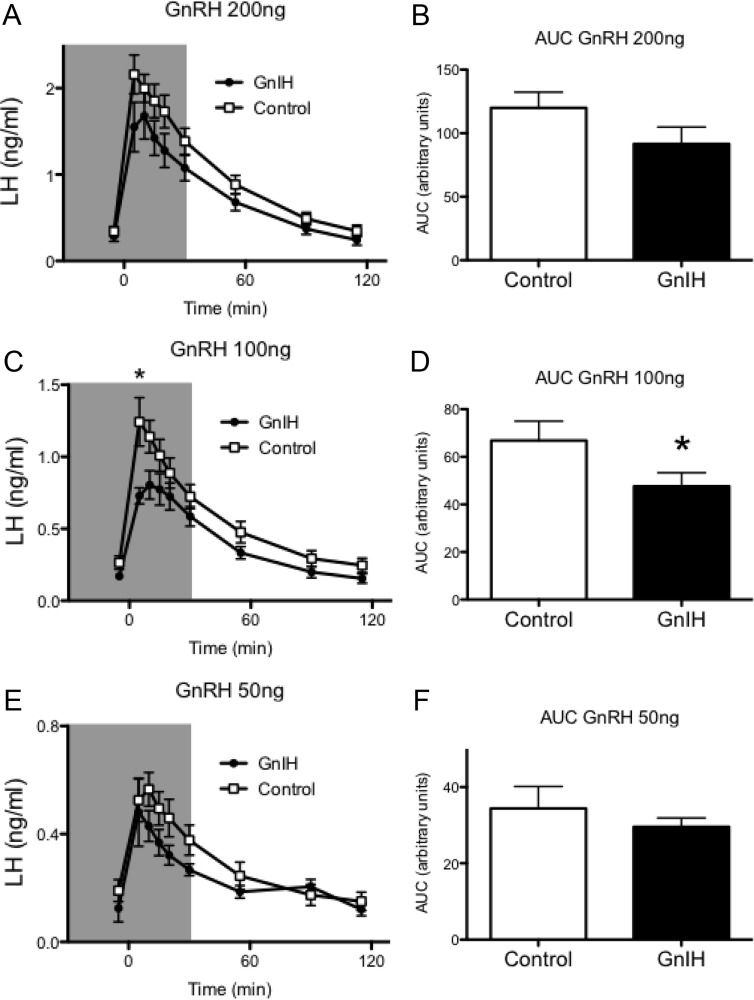
Fig. 3.
GnIH inhibits the LH response to GnRH in vivo. A, C, and E, Plasma concentrations of LH in HPD ewes treated with GnIH (●, 400 μg, shaded area) or saline control (□) and GnRH (200, 100, and 50 ng at time zero). *, P < 0.05. B, D, and F, Area under the curve (AUC) analyses revealed a significant decrease in the LH response in GnIH-treated animals to the 100-ng dose of GnRH. Data are the mean ± sem; n = 8 per group. *, P < 0.05.

