

Abstract
More than 4.5 million children have been conceived by in vitro fertilization (IVF). Interestingly, singleton IVF offspring born at term have an increased incidence of low birth weight. The mechanism responsible for the lower birth weight is unknown, but alterations in placental function are possible. Hence, the goal of our study was to examine placental growth and function in mice generated in vivo or in vitro. To assess placental function, blastocysts were generated by IVF or produced by natural mating (control group); both IVF and control blastocysts were transferred to pseudopregnant recipients. Placental weights did not differ at embryonic d 15.5 (E15.5) but were increased at E18.5 in the IVF group (25.4%, P < 0.001) compared with control. Proliferation was increased in IVF placentae, whereas overall placental gross morphology and apoptosis were not affected. Both fetal weights (16.4% lower at E15.5 and 8.8% lower at E18.5, P < 0.05) and fetal to placental ratios were lower (P < 0.001) in the IVF compared with the control group at both time points, whereas birth weights did not differ. At E18.5, the mRNA for selected glucose, system A amino acid transporters, and imprinted genes were down-regulated in IVF placentae. GLUT3 protein level was decreased in the IVF group (P < 0.05). Importantly, intrajugular injections of 14C-methyl-d-glucose or 14C-MeAIB tracers (n = 6 litters per group) showed that placental transport of glucose and amino acids were 24.8% (not significant) and 58.1% (P < 0.05) lower in the IVF group. Fetal accumulation of glucose was not different, but amino acid accumulation was significantly (36 %) lower in IVF fetuses (P < 0.05). We conclude that IVF alters both fetal and placental growth and, importantly, decreases placental transport efficiency in mice conceived by IVF.
Since the first successful in vitro fertilization (IVF) performed in the late 1970s, more than 4.5 million children have been conceived by IVF. The technique has proven successful and safe for the great majority of children (1). However, several reports have suggested an increased risk of complications, including low birth weight, malformations, abnormal placentation (2, 3), and possibly alterations of some metabolic parameters (4). Conversely, in vitro culture (IVC) of cattle embryos is associated with an increase in birth weight, the so called large offspring syndrome, suggesting that preimplantation culture has species-specific effects (5).
The mechanisms responsible for these adverse events are unknown and could include abnormal placentation, altered epigenetic marks, or a combination of these factors. Studies in animal models have demonstrated that IVC is stressful to gametes and embryos. For example, blastocysts cultured in different media or with varying oxygen tension show alterations of global gene expression pattern (6, 7) and long-term health problems (8, 9). These changes could lead to reprogramming of the genome and predispose to adult disease, as proposed by the developmental origins of health and disease hypothesis (10, 11).
Particularly interesting in this context is the finding that assisted reproductive technologies (ART) have been associated with an increase in placental morphologic abnormalities (12), alteration of placenta gene expression (13), abnormalities in placenta glucocorticoid metabolism (14), and increase in placental pathologies, such as preeclampsia (2). These findings raise the question of whether ART placentae perform their nutrient transport function appropriately. Abnormal embryonic or fetal nutrition can lead to deleterious consequences in adult life (11).
Previously, we have found that IVF blastocysts have fewer trophectoderm (TE) cells than in vivo embryos (6). Particularly interesting in this regard are the down-regulation of nutrient transport pathways in whole blastocysts (15). We found that in whole blastocysts cultured in vitro, there is a down-regulation of Slc7a3 (a cationic amino acid transporter with high affinity for arginine) and of facilitated glucose transporter, member 3 (Glut3) (also known as Slc2a3); other amino acids or glucose transporters were not down-regulated in IVF blastocysts (15).
In addition, although IVF placentae have normal morphology, they display a decrease in the ratio of fetal to placenta (F:P) weight ratio at embryonic day (E)12 (E12.5) (16). Importantly, a dose-response effect was demonstrated, because embryos cultured in more severe conditions manifested a greater change in fetal and placental weights.
In the present study, we aimed to evaluate fetal and placental development during mid to late gestation, i.e. at E15.5 and E18.5 after fertilizing and culturing embryos in optimal conditions (17). As an attempt to uncover the mechanisms responsible for low fetal weight after IVF (16), we also performed functional studies evaluating placental transport of glucose and neutral amino acids at E18.5, the time in gestation during which fetuses grow exponentially (18). Moreover, we evaluated gene and protein expression of selected glucose/amino acid transporters and imprinted genes.
Finally, we evaluated 11β-hydroxysteroid dehydrogenase type 2 (11β-Hsd2) mRNA and protein levels in IVF and control group placentae to investigate whether glucocorticoids were involved in the alteration of fetal and placental development (19).
Here, we have found that IVF placentae were larger than control placentae, displayed selective down-regulation of amino acid and glucose transporters, and transported less neutral amino acid.
Materials and Methods
Animals
Virgin 6- to 8-wk-old CF1 female mice (n = 232), adult B6D2F1/J males (n = 31), and CD1 vasectomized males (n = 11) were used. All experiments were approved by the Institutional Animal Care and Use Committee of the University of California, San Francisco, and all animals were provided with nesting material and housed in cages maintained under a constant 12-h light, 12-h dark cycle at 21–23 C, with free access to standard chow and tap water.
IVF and embryo transfer
IVF and control pregnant mice were generated as previously described (16) with some modifications.
Two groups of embryos were produced. The control group consisted of blastocysts that were generated by normal fertilization, flushed from the uterus, and then immediately transferred to a pseudopregnant recipient dam [the flushed blastocyst (FB) group]. Superovulation was achieved by administering 5 IU of pregnant mare's serum gonadotropin to CF1 female mice (n = 113), followed by 5 IU of human chorionic gonadotropin, 42–46 h later. The females were placed with B6D2F1/J males (n = 8 total) overnight and checked for vaginal plugs the next morning. Late cavitating blastocysts were flushed from the uterus on d 3.5 at 1500 h, i.e. 87 h after fertilization. Subsequently, blastocysts were transferred to the uterine horns (n = 8–10 per horn) of CF1 pseudopregnant recipients (n = 27) (20). This experimental strategy was adopted to control for the embryo transfer procedure and the resulting litter size.
For the IVF group, oocytes were collected from the ampullae of 6- to 8-wk-old superovulated CF1 female mice (n = 69) 13 h after human chorionic gonadotropin injection and fertilized in vitro with cauda epididymal sperm obtained from B6D2F1/J mice (n = 23). Gametes were coincubated in human tubal fluid medium (Millipore, MR-070-D) for 5 h. Zygotes were then washed and cultured in K-modified simplex optimized medium with amino acids, under mineral oil, 5% CO2, and 5% O2 in modular humidified incubators at 37 C for 96 h, at which time the embryos have reached the blastocyst stage. These culture conditions are currently considered to be optimal (21). The blastocysts were then transferred to the uterine horns (n = 8–10 per horn) of CF1 pseudopregnant recipients (n = 23).
Recipients were generated by mating 6-wk-old CF1 females with CD1 vasectomized males (n = 11), and pseudopregnancy was determined by identification of a copulation plug the next morning. Embryonic age was calculated according to the state of pseudopregnancy of the recipient, considering the presence of the copulation plug as E0.5 of pregnancy. FB or IVF blastocysts of similar morphology were transferred to recipients on d 2.5 after mating (16).
Placental and fetal dissection
Pregnant mice were euthanized by CO2 inhalation followed by cervical dislocation, whereas fetuses were euthanized by decapitation. Fetus and placentae were harvested at 2 different time points, E15.5 and E18.5. After dissection, placental and fetal wet weights were recorded, and each placenta was immediately preserved, in one of three ways: 1) fixed overnight in 4% paraformaldehyde/PBS for histological analyses, 2) placed in RNALater (QIAGEN, Valencia, CA) for real-time PCR, or 3) frozen in liquid nitrogen for Western blot analysis. In another set of experiments, placentae and fetuses were collected at E18.5 after maternal radioactive tracer injection. A third cohort of mice was allowed to deliver spontaneously to assess for length of gestation and birth weight.
Histological analysis of the placentae
At E18.5, one placenta, with a wet weight closest to the mean weight of the litter, was selected from each litter (n = 6 per group), bisected through the attachment of the umbilical cord, and embedded in paraffin wax, following the protocol of Coan et al. (21). Briefly, each placenta was cut in 6-μm serial cross-sections, and every sixth section was stained with hematoxylin and eosin (H&E). Additionally, to evaluate whether proliferation or apoptosis were different, a subgroup of sections was stained using antibodies to Ki67 (for proliferation, every 20th section) or cleaved caspase-3 (to asses apoptosis, every 21st section). To do so, paraffin sections were deparaffinized with citrisolve, rehydrated through graded series of ethanol to PBS, and then quenched with 3% (vol/vol) hydrogen peroxide solution in absolute methanol (Sigma-Aldrich, St. Louis, MO) for 10 min at room temperature. Subsequently, slides were incubated in boiling unmasking solution (Vector Laboratories, Inc., Burlingame CA) for 30 min, cooled, and exposed to normal horse serum (for Ki67) and normal goat serum (for cleaved caspase-3); 1:10 dilution (Vector Laboratories, Inc.) for 1 h to block nonspecific binding sites. Slides were then incubated with the primary antibodies in 0.1% BSA/PBS (Sigma-Aldrich) at 4 C overnight [1:10 Ki67 antibody, NCL-Ki67-MM1 (Novocastra Laboratories, Newcastle upon Tyne, UK) and 1:100 cleaved caspase-3 no. 9661 (Cell Signaling, Danvers, MA)]. Then, biotinylated secondary antibodies were added to the sections and incubated for 30 min followed by peroxidase and streptavidin incubation in ABC reagent (Vector Laboratories, Inc.). The immunolocalization of the primary antibodies was visualized with the addition of diaminobenzidine (Roche Diagnostics, Mannheim, Germany). Tissue sections were counterstained with hematoxylin (Sigma-Aldrich). Negative control sections were incubated with normal serum instead of primary antibody. Murine thymus and bovine mammary tissue were used as positive controls.
Systematic random sampling was used to select field of view for counting at ×400 magnification. The percentage of immunostained cells was estimated by counting approximately 1300 cells per placenta.
The border between the labyrinth and spongiotrophoblast was identified visually in H&E-stained sections (IVF, n = 6; FB, n = 6). The border between maternal and fetal components of the placenta was identified by the presence of trophoblast giant cells; the total volume fraction of fetal and labyrinthine zones were estimated using a point counting method, using ImageJ software (version 1.42q; National Institutes of Health, Bethesda, MD) (22) as we have performed before (16).
RNA extraction, cDNA preparation, and real-time PCR analysis
RNA was extracted from 18 placentae per group per time point. In particular, the three placentae with the weight closest to the mean in each litter were used (n = 6 litter per group, with the exception of the IVF group at E15.5, where only five litters were available) (21). Only the average cycle threshold value of the three placentae from one litter was used for statistical analysis. Tissue was manually homogenized. Total RNA was extracted with RNeasy Protect Mini kit (QIAGEN) and then treated with ribonuclease-free deoxyribonuclease according to the instructions of the manufacturer (QIAGEN). Purity and quantity of total RNA were assessed by electrophoresis using the bionalayzer method (Thermo Scientific, Wilmington, DE) (23). RT was accomplished by using a commercially available first strand cDNA synthesis kit (Bio-Rad Laboratories, Hercules, CA). The RT reactions were performed by following the kit manufacturer's protocol to reverse transcribe 1 μg of total RNA. RNA samples were tested for genomic DNA contamination by performing a quantitative RT-PCR without reverse transcriptase in the RT step.
Real-time PCR was performed using SYBR Green PCR Supermix (Bio-Rad Laboratories). Primers sequences for the genes analyzed are listed in Table 1. The following genes were evaluated: the glucose transporter isoforms, Glut1 and Glut3; the system A amino acid transporter isoforms sodium-coupled neutral amino acid transporter (Snat)1 (also known as Slc38a1), Snat2 (Slc38a2), and Snat4 (Slc38a4); cationic amino acid transporter (Slc7a3); 11β-HSD2; the paternally imprinted genes, Igf2 and Igf2P0 (IGF2 placental-specific isoform); the maternally imprinted gene H19; and the housekeeping gene glyceraldehyde 3-phosphate dehydrogenase (Gapdh). Duplicates were used for each real-time PCR reaction, and a no-template control was included in all runs using water instead of cDNA. Data were analyzed within the log linear phase of the amplification curve obtained for each probe/primer using the comparative threshold cycle method (Bio-Rad Laboratories). Thermal cycle conditions used are as follows: 40 cycles of 94 C for15 sec, 55 C for 30 sec, and 72 C for 30 sec using 50 ng of cDNA in a final reaction volume of 25 μl.
Table 1.
Primers used for real-time PCR
| Gene symbol | Sequence | References |
|---|---|---|
| Glut1 | Forward, CCAGCTGGGAATCGTCGTT | 38 |
| Reverse, CAAGTCTGCATTGCCCATGAT | ||
| Glut3 | Forward, CTCTTCAGGTCACCCAACTACGT | 38 |
| Reverse, CCGCGTCCTTGAAGATTCC | ||
| Snat1 | Forward, GATTTACAGGACATTTTTGACCACATAGTA | 39 |
| Reverse, CACCTGTACTAGAAGGTGGACCATTT | ||
| Snat2 | Forward, AGAAGCCATCTTTGATCAAATTGTG | 39 |
| Reverse, GACCTGAACTAGAAGGTGAATCATGC | ||
| Snat4 | Forward, TCACACTGCTGTTTCCAAGG | a |
| Reverse, CAGCCGGAAGAATGAAAATC | ||
| Slc7a3 | Forward, TTCTGGCCGAGTTGTCTATGTTTG | c |
| Reverse, AGTGCGGTTCTGTGGCTGTCTC | ||
| 11betaHsd2 | Forward, CTGCAGATGGATCTGACCAA | 40 |
| Reverse, GTCAGCTCAAGTGCACCAAA | ||
| Igf2 | Forward, AAGAGTTCAGAGAGGCCAAACG | 38 |
| Reverse, CACTGATGGTTGCTGGACATCT | ||
| igf2P0 | Forward, CCGAGGCCTGTACCACCTA | 21 |
| Reverse, CCTCGGCTCAGACCTCAGTA | ||
| H19 | Forward, AATGGTGCTACCCAGCTCAT | a |
| Reverse, GCAGAGTTGGCCATGAAGAT | ||
| Gapdh | Forward, ACAACTTTGGCATTGTGGAA | b |
| Reverse, GATGCAGGGATGATGTTCTG |
Designed using the Primer3 web program http://frodo.wi.mit.edu/primer3/.
Designed using the PrimerSelect, DNASTAR lasergene software (Madison, WI).
Designed using PerlPrimer program http://perlprimer.sourceforge.net/.
Western blotting
The expression of GLUT1, GLUT3, and 11β-HSD2 proteins was analyzed in placental homogenates. Three placentae from three different dams in each experimental group were harvested and processed (n = 9 per group). Placentae were homogenized and suspended in cold lysis buffer [50 mm Tris-HCI (pH 7.2), 250 mm NaCI, 1% Tergitol (NP-40), 2 mm EDTA, and 10% glycerol]. Ten micrograms of protein were resolved by SDS-PAGE (12% gel) and transferred to a polyvinylidene difluoride membrane. The membrane was blocked by soaking in blocking solution [Tris-buffered saline with 0.1% Tween 20 (TBST) and 5% nonfat dried milk] for 1.5 h and incubated at 4 C overnight on a rocking platform using specific antibodies: anti-GLUT1 (1:1000 dilution), anti-GLUT3 (1:2500, both anti-GLUT antibodies; Millipore, Bedford, MA), and anti-11β-HSD2 (1:1000; Alpha Diagnostic International, San Antonio, TX) in 2.5% milk (Bio-Rad Laboratories). The membrane was then washed three times with TBST, incubated with the 1:3500 horseradish peroxidase-conjugated chicken antirabbit IgG (Santa Cruz Biotechnology, Inc., Santa Cruz, CA) diluted with 1% milk (in TBST) for 1 h, and washed three times with TBST. The signal was detected with the ECL Advance Western Blotting Detection reagents (Amersham Biosciences, Piscataway, NJ) followed by autoradiography. Before reprobing with an anti-β-tubulin antibody (Sigma, St. Louis, MO) as a loading control, the membrane was stripped in stripping buffer (Thermo Scientific) for 30 min in room temperature and then washed three times in TBST. The autoradiogrammes were scanned on a flat-bed scanner, and the integrated density of each band and of the background in the Western blotting was quantitated using the measurement analysis tool in Adobe Photoshop CS5.1.
Placental transport of radiolabeled glucose and amino acids
Placental transport of radiolabeled glucose and amino acids was established using the modified method of Sibley et al. (20). Experiments were conducted at E18.5; this time point was specifically chosen to assess placental function during the most rapid phase of fetal growth (E16–E19) (21). Briefly, pregnant mice (n = 6 litters for each group and tracer) were anesthetized with an ip injection of a cocktail of ketamine-xylazine-acepromazine. Then, the maternal jugular vein was dissected and exposed. A total of 100 μl of PBS containing 3.5 μCi of 14C-methyl-d-glucose (NEC377050UC; specific activity 56.4 mCi/mmol; PerkinElmer, Waltham, MA) or 3.5 μCi of 14CMeAIB (NEC671; specific activity 50.5 mCi/mmol; PerkinElmer) was injected in the jugular vein via a short piece of tubing (15 cm) attached to a 27-gauge needle. Maternal blood samples (0.3–0.7 ml) were collected from the maternal heart at specific times and no later than 4 min for plasma counts. Conceptuses and placentae were then dissected out and weighed after fetal decapitation. Fetuses were then minced and lysed for 48 h at 55 C in Biosol (National Diagnostics, Atlanta, GA). The scintillation fluid Bioscint (National Diagnostics) was then added to aliquots of maternal plasma and fetal fractions in scintillation tubes (Sigma) for β-counting (Tri-Carb 4000 Series Scintillation Counter; PerkinElmer).
Fetal and plasma maternal radioactivity was used to calculate clearance in μl/min−1 (g placenta)−1 and fetal uptake in fetal count per minute (g fetus)−1, as described (20). Because the in vitro- and in vivo-produced embryos were in different recipients, we calculated placental clearance by constructing a clearance curve from maternal plasma counts collected at known times 1–4 min after injection. Each mouse provides one time point for the curve.
Statistical analysis
Values for all data are expressed as mean ± sd. For the weight and placental transport data, statistics was calculated using the mean value for each foster mother (and not the individual fetuses), and therefore, “n” represents the number of litters (24). After unpaired Student's t test (Prism 4; GraphPad Software, La Jolla, CA), statistical significance between FB and IVF group was considered if P < 0.05 (25). The relationship between placental unidirectional flux and placental weight was assessed using an analysis of covariance model with amino acid and glucose as the outcome variables, whereas IVF, FB, and placental weight served as predictor variables.
Results
IVF conceptuses had larger placentae and smaller fetuses
At E15.5, placental weights in the IVF group were approximately 9% greater than in the FB group (IVF, n = 49, five litters; FB, n = 60, six litters), although this was not statistically significant. By E18.5, however, the IVF placentae were significantly heavier (∼25%) than controls (IVF, n = 102, 14 litters; FB, n = 97, 16 litters; P < 0.001) (Table 2).
Table 2.
Litter size and fetal and placental weight
| Age | Litters | Maternal weight gain (g) | Litter size | Placental weight (mg) | Fetal weight (mg) | F:P ratio | |
|---|---|---|---|---|---|---|---|
| FB | 15.5 | 6 | 13.7 ± 2.1a | 10.0 ± 2.4a | 97.5 ± 7.7a | 472.0 ± 55.3a | 4.9 ± 0.4a |
| IVF | 15.5 | 5 | 14.4 ± 3.3a | 9.8 ± 2.3a | 106.9 ± 13.9a | 394.4 ± 35.5b | 3.9 ± 0.5b |
| FB | 18.5 | 16 | 20.6 ± 5.4a | 6.1 ± 2.7a | 101.5 ± 11.1a | 1491 ± 104.4a | 15.0 ± 1.6a |
| IVF | 18.5 | 14 | 22.0 ± 3.9a | 7.2 ± 2.0a | 127.3 ± 16.7b | 1360 ± 106.2b | 11.2 ± 1.3b |
| FB | Birth | 5 | 22.9 ± 5.4a | 8.0 ± 1.4a | 1710 ± 85.7a | ||
| IVF | Birth | 4 | 16.8 ± 4.7a | 6.3 ± 2.2a | 1766 ± 119.2a |
Significantly different values (P < 0.05). Different superscripts if P < 0.05.
In contrast, IVF fetal weight was approximately 16% lower at E15.5 (P < 0.05) and approximately 8% lower at E18.5 (IVF, P < 0.01) (Table 2). Interestingly, the birth, weights of IVF and FB mice did not differ (IVF, n = 25, four litters; FB, n = 40, five litters; not significant). The F:P weight ratio (Table 2) was significantly decreased in IVF mice at both gestational ages. Of note, there were no significant differences in average litter size between the FB and IVF groups at E15.5 or E18.5 and no differences in maternal weight gain. Similarly, litters allowed to deliver spontaneously did so at E19.5 in both groups (Table 2).
Proliferation was increased in IVF placentae
IVF placental gross morphology did not differ between groups (Fig. 1, A and B) at E18.5 (n = 6). The area of the labyrinth and spongiotrophoblast layer was not different (Table 3). No differences were seen in the percentage of cells expressing cleaved caspase-3 immunostaining, a marker of apoptosis (Fig. 1, G–J, and Table 3). However, Ki67 immunostaining, indicating the level of cell proliferation (Fig. 1, C–F, and Table 3), was increased (P < 0.05) in both the labyrinth and spongiotrophoblast layers.
Fig. 1.

Cross-sections of the entire placenta at E18.5, from FB (A) and IVF (B) groups stained with H&E. S, Spongiotrophoblast layer; L, labyrinth layer. C–F, Representative microscopic fields from slides stained with an antibody to Ki67. Black arrows indicate positive staining and white arrows negative staining. G–J, Representative microscopic views of placentae stained with an antibody to cleaved caspase-3 in the labyrinth and spongiotrophoblast layers. Scale bar, 100 μm.
Table 3.
Analysis of labyrinth and spongiotrophoblast areas, placental proliferation, and apoptosis at E18.5
| Groups | Labyrinth | Spongiotrophoblast | |
|---|---|---|---|
| Total area (%) | FB | 52.7 ± 4.2a | 40.9 ± 3.4a |
| IVF | 53.7 ± 7.2a | 37.0 ± 7.3a | |
| Ki67 positive cells (%) | FB | 28.50 ± 9.2a | 36.59 ± 7.6a |
| IVF | 57.96 ± 10.8b | 62.50 ± 7.8b | |
| Cleaved caspase-3 positive cells (%) | FB | 5.2 ± 2.7a | 7.1 ± 3.5a |
| IVF | 5.8 ± 2.7a | 6.4 ± 2.9a |
n = 6 placenta per group; each placenta originated from a different litter.
Significantly different values (P < 0.05). Different superscripts if P < 0.05.
IVF placentae showed decreased expression of selected transporters and imprinted genes
To examine whether the decrease in transporter mRNA levels seen previously (6) in blastocysts continued on in the mature placenta, we investigated whether there was a change in the expression of placental nutrient transporters (Fig. 2). At E15.5 (FB, n = 18 placentae, six litters; IVF, n = 15 placentae, five litters), real-time quantitative PCR revealed that the glucose transporter Glut3 was down-regulated, whereas the cationic amino acid transporter Slc7a3 was increased in the IVF group (P < 0.05) while all the other genes had similar expression to the control group (Fig. 2A). In contrast, at E18.5 (n = 6 litters per group), multiple transporters were down-regulated (P < 0.05) (Fig. 2B). In particular, both glucose transporters (Glut1 and Glut3) and two system A amino acid transporters (Snat2 and Snat4) were down-regulated. Snat1 and Slc7a3 expression remained unchanged.
Fig. 2.

Real-time PCR for the relative amounts of Glut1, Glut3, Slc7a3, Snat1, Snat2, Snat4, Igf2, Igf2P0, H19, and 11βHsd2 mRNA in total placental tissue at E15.5 (FB, n = 6 dams; IVF, n = 5) (A) and E18.5 (n = 6 per group) (B) in the FB (control) and IVF group. Three placentae closest to the mean in a litter for each gestational age and group were analyzed. Values are means ± sd. *, P < 0.05 (unpaired Student's t test).
To better understand the significance of the gene expression findings, we quantified protein expression using commercially available antibodies. The decrease in Glut3 mRNA expression at E18.5 was associated with a decreased protein expression (IVF and FB, n = 9, three litters per group) in IVF whole placentae (P < 0.01), whereas GLUT1 protein expression did not differ between groups. (Fig. 3). We were unable to assess system N amino acid transporters (SNAT) transporters due to lack of reliable antibodies.
Fig. 3.
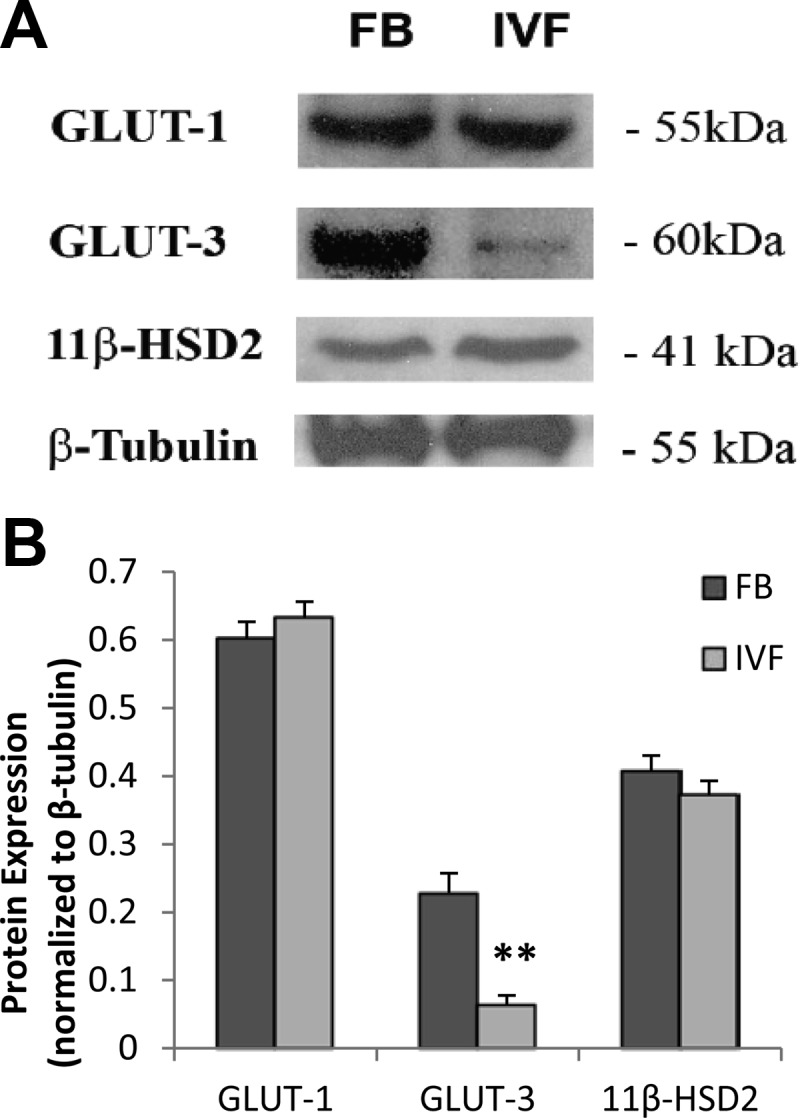
A, Representative Western blottings of GLUT1, GLUT3, 11βHsd2, and β-tubulin in total placental homogenates, obtained from FB or IVF-conceived fetuses (n = 3 litters per group). The three placentae closest to the mean in a litter for group were analyzed. B, Densitometric measurements of Western blotting autoradiograms. Values are means ± sd. **, P < 0.001 (unpaired Student's t test).
We next examined whether there were differences in the expression of specific imprinted genes. We found that the placenta-specific Igf2P0 was down-regulated only at E15.5, whereas Igf2 and H19 were significantly down-regulated (P < 0.05) only at E18.5 in IVF placentae. Finally, because ART have been found to impair placental steroid metabolism (14), we evaluated 11βhsd2 message and protein levels. We found that 11βhsd2 mRNA was decreased at E18.5, whereas the protein level was not (Fig. 3).
Neutral amino acid transfer was reduced in IVF placentae
With the purpose of investigating whether the decreased fetal weight found in mice conceived by IVF was due to impaired transplacental nutrient transport, and to see whether the decreased transporter mRNA levels were of functional significance, we investigated placental transport and fetal accumulation of neutral amino acids and glucose (Fig. 4).
Fig. 4.

Unidirectional flux of nutrients across the placenta (A and C) and fetal accumulation of tracer per gram of fetus (B and D). A and B, [14C]-MeAIB (n = 6 litters per group). C and D, [14C]-methyl-d-glucose (n = 6 litters per group). Values are means ± sd. **, P < 0.001 (unpaired Student's t test).
Transport of [14C]-methyl-d-glucose per gram of placenta was approximately 24% lower in IVF compared with FB (IVF, n = 42, six litters; FB, n = 38, six litters). Fetal accumulation of [14C]-methyl-d-glucose tracer was also approximately 3% lower in the IVF group compared with FB, although neither of these differences was statistically significant. Placental transport of [14C]-MeAIB per gram of placenta was greatly reduced (∼57%, P < 0.01) in IVF conceptuses, compared with the FB group (IVF, n = 33, six litters; FB, n = 29, six litters). Accordingly, [14C]-MeAIB accumulation in IVF fetuses was approximately 36% lower than in FB (P < 0.001).
We next examined whether there was a relationship between placental size and placental transport. There was an inverse relationship between placental size and amino acid transport. Larger placentae were more inefficient than smaller placentae in transporting [14C]-MeAIB (in both IVF and FB groups) (Supplemental Fig. 1A, published on The Endocrine Society's Journals Online web site at http://endo.endojournals.org). The fitted model indicates that the rate of decline of placenta amino acid transport is significantly different (P < 0.0001) for FB placenta [−14.75 μl/min−1 per (g placenta)−1] vs. IVF placenta [−2.92 μl/min−1 per (g placenta)−1].
According to the fitted model, the relationship between placental size and glucose transport was statistically different between IVF and FB placentae (P = 0.04) (Supplemental Fig. 1B). Although the larger IVF placenta transported less glucose per gram of tissue than smaller IVF placentae [−25.90 μl/min−1 per (g placenta)−1], similar to the situation with amino acids, the larger FB placentae were more efficient than smaller placentae in transporting glucose [29.23 μl/min−1 per (g placenta)−1].
When the transport capabilities of placentae of the same size were compared (0.09 with 0.1 g), IVF placentae were significantly less efficient at transporting amino acids but no different from FB controls in transporting glucose (Supplemental Fig. 1).
Discussion
In this study, we evaluated whether IVF and preimplantation embryo culture affected fetal and placental development and placental transport of solutes during late gestation in mice.
The first important finding is that IVF fetuses are smaller during most of gestation, compared with in vivo-conceived fetuses. Conversely, IVF placentae were larger at E15.5 IVF (∼9%, not significant) and even larger at E18.5 (∼25%, P < 0.01). Placental histological analyses showed that the labyrinthine and spongiotrophoblast areas were proportionally similar in both groups at E18.5, which is similar to our previous findings at E12.5 (17). Furthermore, analyses of proliferation and apoptosis showed that IVF placentae were becoming proportionally enlarged in both the labyrinth and spongiotrophoblast layers by an increase in proliferation, not via a decrease in apoptosis.
From these and earlier data taken at E4.5 and E12.5 (6, 16), we can construct a rough growth curve for IVF embryos/fetuses and their placentae, compared with controls (Fig. 5). IVF embryos were reduced in size at E12.5, but by birth, reached the same size as the controls. Regarding placental development, there were fewer TE cells around the time of implantation in IVF blastocysts, by midgestation the placentae were of normal size, and then exceed the wet weight of the controls toward the end of gestation. Of note, larger placentae as a result of restricted maternal nutrition during early gestation have been observed in humans (26).
Fig. 5.

Overview of the relative growth of IVF embryos/fetuses and placentae (6, 15, 16). IVF placental and fetal weights are expressed as a percentage of control embryos. Control data are normalized to 1 at each time point. A, The placenta. IVF blastocysts have reduced number of TE cells (E4.5), the precursor of the placenta; the placenta becomes progressively larger during gestation and ultimately becomes larger than those of control fetuses. B, The embryo/fetus. IVF blastocysts have similar number of ICM cells as control embryos. However, the IVF fetuses have statistically lower weight from E12.5 to E18.5. The fetuses increase in size relative to controls during the fetal period, so that at birth, their weight is the same. KSOMAA, K-modified simplex optimized medium with amino acids.
These altered growth curves suggest that the preimplantation conditions experienced by the IVF embryo were suboptimal. In addition, the growth data confirm that birth weight is a poor marker of stress; the isolated finding of a normal, or near normal, birth weight may not accurately reflect embryonic/fetal stress through gestation. It has been shown that fetal stress goes on to affect postnatal health (10).
The second important finding is that the levels of mRNA for Glut3, which were decreased during preimplantation development, continue to be lower in IVF placentae thorough late gestation. Specifically, we have found that Glut3 remained down-regulated in mature placenta both at E15.5 and E18.5 (6). Given that Glut 3 expression can be epigenetically regulated and that preimplantation embryo culture alters epigenetic marks (27), it is plausible that epigenetic processes are responsible for the observed Glut3 expression (28).
In contrast, Slc7a3, a cationic amino acid transporter with high affinity for arginine (23), was decreased in IVF blastocyst, was increased in IVF placentae at E15.5, and was not different from controls at E18.5. Although neutral amino acid transporters were comparable with controls at earlier stages in IVF blastocysts and placenta, they were down-regulated in IVF placentae at E18.5 (with the exception of Snat1) (Fig. 2). The amino acid transporter data show that there is not a coherent trend in mRNA expression over the course of gestation. However, the increased dysregulation in transporters at E18.5 is consistent with the idea that the IVF placentae become more inefficient at later stages of gestation. One limitation of our studies is that gene expression and protein transporter analyses were performed in whole placentae and not in plasma membranes of syncytiotrophoblast, the barrier for nutrient transport (29).
Thirdly and perhaps most importantly, IVF placentae showed significantly impaired amino acid transport, to the extent that the IVF fetuses had a lower accumulation of amino acids. Fetal delivery of glucose across the placenta and glucose accumulation in IVF fetuses did not statistically differ between groups. Overall, larger placentae in both the IVF and FB groups were less efficient than smaller placentae (Supplemental Fig. 1) in transporting amino acids, in agreement with findings of other investigators (25). Regarding glucose, FB placentae become more efficient as placenta weight increases; on the contrary, IVF placentae become less efficient with increase in weight. When we limited the analysis to IVF and FB placenta of the same weight, we found that IVF placentae were less efficient than FB placentae in transporting amino acid per gram of placental tissue, but equally effective in transporting glucose. These findings support the hypothesis that increased placental weight after IVF is a compensatory process for the decrease in transport.
Decreased amino acid transport to the fetuses has important implications. In fact, amino acids are used not only for protein synthesis but also serve as energy source. It is estimated that as much as 20–40% of the total energy supplied to the fetal/placental unit is derived from amino acids (30). Because the IVF fetuses achieved the same birth weight, and produced larger placentae than controls, despite a marked impairment in amino acid transport, we hypothesize that IVF conceptuses must modify their metabolism to accommodate a lower availability of neutral amino acids for protein synthesis and energy sources. This “metabolic reprogramming strategy” appeared to allow significant growth of IVF fetuses and placentae in late gestation, using an altered mix of nutrients.
How can we understand the growth of the IVF conceptus in light of these physiological data? A reasonable hypothesis might be as follows (Fig. 5). During implantation and early development, the IVF placenta is smaller and functionally compromised due to the reduction in founder TE cells and the reduction in transporter gene expression. This smaller placenta appears to have compromised the early growth of the embryo/fetus so that at E12.5 the fetus is smaller. Alternatively, or in addition, the decreased fetal size may be due to a direct effect of embryo culture on the inner cell mass cells developmental and proliferation potential. At E12.5, the equal size of the IVF and FB placenta and the greater labeling index seen in the IVF placenta indicate that the IVF placenta had been growing to compensate for its earlier deficiency in size (16). This increased placental growth continues until E18.5, at which time the IVF placenta is larger than controls but still functionally compromised. The fetus also grows faster than the controls in mid to late gestation and catches up to the controls by birth. The fact that the placenta is larger in the IVF group is likely to have contributed to the compensatory growth of the fetus, despite the functional limitations of the placenta. It is unknown whether the placenta possesses a mechanism for sensing its own size or the size of the fetus (31). However, it is well established that maternal-fetal transport interface depends on a coordinated interaction among genetic, epigenetic, and physiological cues as a function of gestational age (32). It has been shown that large placentae can modify their nutrient transfer capacity to regulate fetal nutrient acquisition (11, 31).
Additionally, it is also plausible that the maternal physiological adaptations in early pregnancy are different in dams receiving IVF embryos as opposed to control embryos. This could help to explain the difference in intrauterine growth patterns between groups. For example, it has been described that the endometrial transcriptome is different in bovine receiving IVF or cloned embryos (33). Future investigations should evaluate all aspects of the placental exchange pathways (including lipid, ions, and water) to better understand intrauterine “catch-up” growth after IVF and its long-term implications for IVF offspring.
Finally, it is also possible that alteration of selected imprinted genes could result in the observed phenotype. Interestingly, placental-specific Igf2P0 mRNA expression was down-regulated only at E15.5. This transcript is only expressed in the placenta, and its deletion has profound effects on placental and fetal growth (31). In particular, Igf2P0 regulates in a time-dependent manner the placental expression and activity of selected glucose and amino acid transporters (34). Our findings that IVF Igf2P0 transcripts were down-regulated at E15.5 while placental Igf2 and H19 transcripts were down-regulated at E18.5 suggest that their time-dependent regulation might be involved in the mechanisms leading to a decrease in transporter activity. Consistent with this, a modulation of placental imprinted gene expression at E10.5 (Igf2, Igf2R, Snat4, and H19 included) was demonstrated after IVF and has been suggested to be an adaptation to adverse in vitro conditions (13). Furthermore, it has been previously demonstrated that IVF-derived mouse embryos and embryonic stem cells derived from IVF blastocysts show abnormal Igf2/H19 imprinting (35). It is unclear why there is a time-specific decrease in the expression of Igf2P0 and Igf2 within an enlarged placenta.
Differences in placental steroid metabolism between pregnancies conceived naturally or by IVF and intracytoplasmic sperm injection at E18 have been demonstrated, with ART-generated fetuses having higher levels of steroid metabolites (14). The fact that 11βHSD2 protein expression was not different in our experiments suggests that this enzyme is not involved in the functional alterations found in IVF placentae at E18.5. It is difficult to explain why 11βHsd2 mRNA was down-regulated while 11βHsd2 protein was not different between IVF and FB placentae. It is possible that a posttranscriptional regulation exists or that the decrease in mRNA level will be mirrored by a reduced protein level at a later gestational time.
Limitations of the study include the lack of transport study at E15.5. The availability of functional studies at an earlier age would have allowed estimating whether there was a relationship between increasing placental size and decreased placental function at different gestational ages. In addition, we used a relatively small sample size, although not different from previous publications from other groups (36). To mitigate the possible effects of superovulation, yet to maximize oocyte and blastocyst retrieval, only the egg donor mice were superovulated. The recipient mice were not. Previous studies suggest that the effects of superovulation occur mainly in the uterus (37). As is always the case with the use of model organisms, the differences in placentation, gestational endocrinology, and development between humans and mice must be kept in mind when judging the clinical relevance of these studies.
In summary, we provide direct evidence, for the first time, that placental nutrient transport is impaired in IVF conceptuses cultured in optimized conditions. Despite impaired placental neutral amino acids transport, IVF placentae are able to support the achievement of normal birth weight of IVF offspring. However, the decreased amino acid nutrient transport and the altered fetal and placental growth curves suggest that IVF conceptuses have been growing with a modified nutrient mixture and may have undergone reprogramming (Fig. 5). Therefore, long-term health follow-up studies are warranted as suggested by developmental origins of health and adult disease.
Supplementary Material
Acknowledgments
We thank Chia-Ning Kao for his help in statistical analysis.
This work was funded by National Institute of Child and Human Development Grant R01 062803 - 01A1 to (P.R.).
Disclosure Summary: The authors have nothing to disclose.
Footnotes
- ART
- Assisted reproductive technology
- E
- embryonic day
- FB
- flushed blastocyst
- F:P
- fetal to placenta
- Gapdh
- glyceraldehyde 3-phosphate dehydrogenase
- Glut3
- facilitated glucose transporter, member 3
- H&E
- hematoxylin and eosin
- 11β-Hsd2
- 11β-hydroxysteroid dehydrogenase type 2
- IVC
- in vitro culture
- IVF
- in vitro fertilization
- Snat
- sodium-coupled neutral amino acid transporter
- Slc7a3
- solute carrier family 7 (cationic amino acid transporter, y+ system), member 3
- TBST
- Tris-buffered saline with 0.1% Tween 20
- TE
- trophectoderm.
References
- 1. SB 2011. ART success rates have reached a plateau. In: Focus on reproduction: European society of human reproduction and embryology; 13–14 [Google Scholar]
- 2. Jackson RA, Gibson KA, Wu YW, Croughan MS. 2004. Perinatal outcomes in singletons following in vitro fertilization: a meta-analysis. Obstet Gynecol 103:551–563 [DOI] [PubMed] [Google Scholar]
- 3. Schieve LA, Meikle SF, Ferre C, Peterson HB, Jeng G, Wilcox LS. 2002. Low and very low birth weight in infants conceived with use of assisted reproductive technology. N Engl J Med 346:731–737 [DOI] [PubMed] [Google Scholar]
- 4. Ceelen M, van Weissenbruch MM, Vermeiden JP, van Leeuwen FE, Delemarre-van de Waal HA. 2008. Cardiometabolic differences in children born after in vitro fertilization: follow-up study. J Clin Endocrinol Metab 93:1682–1688 [DOI] [PubMed] [Google Scholar]
- 5. Bertolini M, Mason JB, Beam SW, Carneiro GF, Sween ML, Kominek DJ, Moyer AL, Famula TR, Sainz RD, Anderson GB. 2002. Morphology and morphometry of in vivo- and in vitro-produced bovine concepti from early pregnancy to term and association with high birth weights. Theriogenology 58:973–994 [DOI] [PubMed] [Google Scholar]
- 6. Giritharan G, Talbi S, Donjacour A, Di Sebastiano F, Dobson AT, Rinaudo PF. 2007. Effect of in vitro fertilization on gene expression and development of mouse preimplantation embryos. Reproduction 134:63–72 [DOI] [PubMed] [Google Scholar]
- 7. Fernández-González R, de Dios Hourcade J, López-Vidriero I, Benguría A, De Fonseca FR, Gutiérrez-Adán A. 2009. Analysis of gene transcription alterations at the blastocyst stage related to the long-term consequences of in vitro culture in mice. Reproduction 137:271–283 [DOI] [PubMed] [Google Scholar]
- 8. Fernández-Gonzalez R, Moreira P, Bilbao A, Jiménez A, Pérez-Crespo M, Ramírez MA, Rodríguez De Fonseca F, Pintado B, Gutiérrez-Adán A. 2004. Long-term effect of in vitro culture of mouse embryos with serum on mRNA expression of imprinting genes, development, and behavior. Proc Natl Acad Sci USA 101:5880–5885 [DOI] [PMC free article] [PubMed] [Google Scholar]
- 9. Ecker DJ, Stein P, Xu Z, Williams CJ, Kopf GS, Bilker WB, Abel T, Schultz RM. 2004. Long-term effects of culture of preimplantation mouse embryos on behavior. Proc Natl Acad Sci USA 101:1595–1600 [DOI] [PMC free article] [PubMed] [Google Scholar]
- 10. Barker DJ. 1998. Mothers, babies and health in later life. 2nd ed Glasgow, United Kingdom: Churchill Livingstone [Google Scholar]
- 11. Fowden AL, Ward JW, Wooding FP, Forhead AJ, Constancia M. 2006. Programming placental nutrient transport capacity. J Physiol 572:5–15 [DOI] [PMC free article] [PubMed] [Google Scholar]
- 12. Romundstad LB, Romundstad PR, Sunde A, von Düring V, Skjaerven R, Vatten LJ. 2006. Increased risk of placenta previa in pregnancies following IVF/ICSI; a comparison of ART and non-ART pregnancies in the same mother. Hum Reprod 21:2353–2358 [DOI] [PubMed] [Google Scholar]
- 13. Fauque P, Mondon F, Letourneur F, Ripoche MA, Journot L, Barbaux S, Dandolo L, Patrat C, Wolf JP, Jouannet P, Jammes H, Vaiman D. 2010. In vitro fertilization and embryo culture strongly impact the placental transcriptome in the mouse model. PLoS One 5:e9218. [DOI] [PMC free article] [PubMed] [Google Scholar]
- 14. Collier AC, Miyagi SJ, Yamauchi Y, Ward MA. 2009. Assisted reproduction technologies impair placental steroid metabolism. J Steroid Biochem Mol Biol 116:21–28 [DOI] [PMC free article] [PubMed] [Google Scholar]
- 15. Rinaudo P, Schultz RM. 2004. Effects of embryo culture on global pattern of gene expression in preimplantation mouse embryos. Reproduction 128:301–311 [DOI] [PubMed] [Google Scholar]
- 16. Delle Piane L, Lin W, Liu X, Donjacour A, Minasi P, Revelli A, Maltepe E, Rinaudo PF. 2010. Effect of the method of conception and embryo transfer procedure on mid-gestation placenta and fetal development in an IVF mouse model. Hum Reprod 25:2039–2046 [DOI] [PMC free article] [PubMed] [Google Scholar]
- 17. Perin PM, Maluf M, Nicolosi Foltran Januário DA, Nascimento Saldiva PH. 2008. Comparison of the efficacy of two commercially available media for culturing one-cell embryos in the in vitro fertilization mouse model. Fertil Steril 90:1503–1510 [DOI] [PubMed] [Google Scholar]
- 18. Fowden AL, Sferruzzi-Perri AN, Coan PM, Constancia M, Burton GJ. 2009. Placental efficiency and adaptation: endocrine regulation. J Physiol 587:3459–3472 [DOI] [PMC free article] [PubMed] [Google Scholar]
- 19. Jansson T, Powell TL. 2007. Role of the placenta in fetal programming: underlying mechanisms and potential interventional approaches. Clin Sci 113:1–13 [DOI] [PubMed] [Google Scholar]
- 20. Sibley CP, Coan PM, Ferguson-Smith AC, Dean W, Hughes J, Smith P, Reik W, Burton GJ, Fowden AL, Constância M. 2004. Placental-specific insulin-like growth factor 2 (Igf2) regulates the diffusional exchange characteristics of the mouse placenta. Proc Natl Acad Sci USA 101:8204–8208 [DOI] [PMC free article] [PubMed] [Google Scholar]
- 21. Coan PM, Vaughan OR, Sekita Y, Finn SL, Burton GJ, Constancia M, Fowden AL. 2010. Adaptations in placental phenotype support fetal growth during undernutrition of pregnant mice. J Physiol 588:527–538 [DOI] [PMC free article] [PubMed] [Google Scholar]
- 22. McArdle AM, Denton KM, Maduwegedera D, Moritz K, Flower RL, Roberts CT. 2009. Ontogeny of placental structural development and expression of the renin-angiotensin system and 11β-HSD2 genes in the rabbit. Placenta 30:590–598 [DOI] [PubMed] [Google Scholar]
- 23. Gao H, Wu G, Spencer TE, Johnson GA, Bazer FW. 2009. Select nutrients in the ovine uterine lumen. III. Cationic amino acid transporters in the ovine uterus and peri-implantation conceptuses. Biol Reprod 80:602–609 [DOI] [PubMed] [Google Scholar]
- 24. Festing MF. 2006. Design and statistical methods in studies using animal models of development. Ilar J 47:5–14 [DOI] [PubMed] [Google Scholar]
- 25. Coan PM, Angiolini E, Sandovici I, Burton GJ, Constância M, Fowden AL. 2008. Adaptations in placental nutrient transfer capacity to meet fetal growth demands depend on placental size in mice. J Physiol 586:4567–4576 [DOI] [PMC free article] [PubMed] [Google Scholar]
- 26. Lumey LH. 1998. Compensatory placental growth after restricted maternal nutrition in early pregnancy. Placenta 19:105–111 [DOI] [PubMed] [Google Scholar]
- 27. Doherty AS, Mann MR, Tremblay KD, Bartolomei MS, Schultz RM. 2000. Differential effects of culture on imprinted H19 expression in the preimplantation mouse embryo. Biol Reprod 62:1526–1535 [DOI] [PubMed] [Google Scholar]
- 28. O'Byrne KJ, Baird AM, Killmartin L, Leonard J, Sacevich C, Gray SG. 2011. Epigenetics regulation of glucose transporters in non-small cell lung cancer. Cancers 3:1550–1565 [DOI] [PMC free article] [PubMed] [Google Scholar]
- 29. Jones HN, Powell TL, Jansson T. 2007. Regulation of placental nutrient transport—a review. Placenta 28:763–774 [DOI] [PubMed] [Google Scholar]
- 30. Bauer MK, Harding JE, Bassett NS, Breier BH, Oliver MH, Gallaher BH, Evans PC, Woodall SM, Gluckman PD. 1998. Fetal growth and placental function. Mol Cell Endocrinol 140:115–120 [DOI] [PubMed] [Google Scholar]
- 31. Angiolini E, Coan PM, Sandovici I, Iwajomo OH, Peck G, Burton GJ, Sibley CP, Reik W, Fowden AL, Constância M. 2011. Developmental adaptations to increased fetal nutrient demand in mouse genetic models of Igf2-mediated overgrowth. FASEB J 25:1737–1745 [DOI] [PubMed] [Google Scholar]
- 32. Desforges M, Greenwood SL, Glazier JD, Westwood M, Sibley CP. 2010. The contribution of SNAT1 to system A amino acid transporter activity in human placental trophoblast. Biochem Biophys Res Commun 398:130–134 [DOI] [PMC free article] [PubMed] [Google Scholar]
- 33. Bauersachs S, Ulbrich SE, Zakhartchenko V, Minten M, Reichenbach M, Reichenbach HD, Blum H, Spencer TE, Wolf E. 2009. The endometrium responds differently to cloned versus fertilized embryos. Proc Natl Acad Sci USA 106:5681–5686 [DOI] [PMC free article] [PubMed] [Google Scholar]
- 34. Constância M, Hemberger M, Hughes J, Dean W, Ferguson-Smith A, Fundele R, Stewart F, Kelsey G, Fowden A, Sibley C, Reik W. 2002. Placental-specific IGF-II is a major modulator of placental and fetal growth. Nature 417:945–948 [DOI] [PubMed] [Google Scholar]
- 35. Li T, Vu TH, Ulaner GA, Littman E, Ling JQ, Chen HL, Hu JF, Behr B, Giudice L, Hoffman AR. 2005. IVF results in de novo DNA methylation and histone methylation at an Igf2–H19 imprinting epigenetic switch. Mol Hum Reprod 11:631–640 [DOI] [PubMed] [Google Scholar]
- 36. Audette MC, Challis JR, Jones RL, Sibley CP, Matthews SG. 2011. Antenatal dexamethasone treatment in midgestation reduces system A-mediated transport in the late-gestation murine placenta. Endocrinology 152:3561–3570 [DOI] [PubMed] [Google Scholar]
- 37. Pinborg A, Loft A, Aaris Henningsen AK, Rasmussen S, Andersen AN. 2010. Infant outcome of 957 singletons born after frozen embryo replacement: the Danish national cohort study 1995–2006. Fertil Steril 94:1320–1327 [DOI] [PubMed] [Google Scholar]
- 38. Feil D, Lane M, Roberts CT, Kelley RL, Edwards LJ, Thompson JG, Kind KL. 2006. Effect of culturing mouse embryos under different oxygen concentrations on subsequent fetal and placental development. J Physiol 572:87–96 [DOI] [PMC free article] [PubMed] [Google Scholar]
- 39. Loehle JA, Cornish V, Wakefield L, Doll MA, Neale JR, Zang Y, Sim E, Hein DW. 2006. N-acetyltransferase (Nat) 1 and 2 expression in Nat2 knockout mice. J Pharmacol Exp Ther 319:724–728 [DOI] [PubMed] [Google Scholar]
- 40. Huang Y, Li X, Lin H, Chu Y, Chen B, Lian Q, Ge RS. 2010. Regulation of 11beta-hydroxysteroid dehydrogenase 1 and 2 by IGF-1 in mice. Biochem Biophys Res Commun 391:1752–1756 [DOI] [PubMed] [Google Scholar]
Associated Data
This section collects any data citations, data availability statements, or supplementary materials included in this article.