

Abstract
Heat-shock proteins 70 (Hsp70s) are key molecular chaperones which assist in the folding and refolding/disaggregation of proteins. Hsp70s, which consist of a nucleotide-binding domain (NBD, consisting of NBD-I and NBD-II subdomains) and a substrate-binding domain [SBD, further split into the β-sheet (SBD-β) and α-helical (SBD-α) subdomains], occur in two major conformations having (a) a closed SBD, in which the SBD and NBD domains do not interact, (b) an open SBD, in which SBD-α interacts with NBD-I and SBD-β interacts with the top parts of NBD-I and NBD-II. In the SBD-closed conformation, SBD is bound to a substrate protein, with release occurring after transition to the open conformation. While the transition from the closed to the open conformation is triggered efficiently by binding of adenosine triphosphate (ATP) to the NBD, it also occurs, although less frequently, in the absence of ATP. The reverse transition occurs after ATP hydrolysis. Here, we report canonical and multiplexed replica exchange simulations of the conformational dynamics of Hsp70s using a coarse-grained molecular dynamics approach with the UNRES force field. The simulations were run in the following three modes: (i) with the two halves of the NBD unrestrained relative to each other, (ii) with the two halves of the NBD restrained in an “open” geometry as in the SBD-closed form of DnaK (2KHO), and (iii) the two halves of NBD restrained in a “closed” geometry as in known experimental structures of ATP-bound NBD forms of Hsp70. Open conformations, in which the SBD interacted strongly with the NBD, formed spontaneously during all simulations; the number of transitions was largest in simulations carried out with the “closed” NBD domain, and smallest in those carried out with the “open” NBD domain; this observation is in agreement with the experimentally-observed influence of ATP-binding on the transition of Hsp70’s from the SBD-closed to the SBD-open form. Two kinds of open conformations were observed: one in which SBD-α interacts with NBD-I and SBD-β interacts with the top parts of NBD-I and NBD-II (as observed in the structures of nucleotide exchange factors), and another one in which this interaction pattern is swapped. A third type of motion, in which SBD-α binds to NBD without dissociating from SBD-β was also observed. It was found that the first stage of interdomain communication (approach of SBD-β, to NBD) is coupled with the rotation of the long axes of NBD-I and NBD-II towards each other. To the best of our knowledge, this is the first successful simulation of the full transition of an Hsp70 from the SBD-closed to the SBD-open conformation.
Keywords: heat-shock proteins, protein folding, functionally-important motions, molecular simulations, free-energy landscape
1 Introduction
The 70-kDa heat-shock proteins (Hsp70s) are ubiquitous in both eukaryotic and procaryotic organisms.1,2 They appear to be the major chaperones involved in assisting the correct folding of nascent and misfolded proteins, and in preventing their aggregation in the cytosol. They also inhibit programmed cell death (apoptosis) by interacting transiently with other proteins of the apoptosis pathways.2–4 Other functions of Hsp70s include transport of polypeptides across biological membranes, biogenesis of iron-sulfur containing proteins, initiation of phage DNA replication, rearrangement of protein complexes, and protein quality control including regulated proteolysis.3,4
The structure of Hsp70s consists of a 380-residue N-terminal nucleotide-binding (ATPase) domain [NBD, with several subdomains5,6], which catalyzes ATP hydrolysis, and a 222-residue C-terminal substrate-binding domain (SBD), connected by a short linker7–9 (Figure 1A). The Hsp70s perform their functions through cycles of binding and release of unfolded polypeptide chains.2,3 The folding time depends on the frequency of these binding/release events. The binding is caused by transient interactions of the C-terminal binding domain with short hydrophobic peptide stretches within the substrate polypeptides.2,3 This interaction is regulated by the nucleotide-binding status of the ATPase domain. It was found10,11 that the SBD is close to the NBD in the ATP-bound state, while the two domains do not communicate in the nucleotide-free or ADP-bound state. The affinity for substrates is low when ATP is bound to its ATPase domain, while affinity is high when no nucleotide or ADP occupies the nucleotide-binding pocket. Thus, ATP binding to the ATPase domain controls the conformation of the substrate-binding domain, leading to a prevalence for the open state of the substrate-binding pocket.7 Conversely, substrate binding to the SBD, in synergism with a J-domain protein (the Hsp40 co-chaperone), induces a conformational change in the ATPase domain, thereby stimulating ATP hydrolysis.10 Recently it was found that the J-domain protein binds to the charged β-hairpin of ADP-bound DnaK of the IIa subomain.12 The interaction of the J-domain protein is transient, and binding of the substrate occurs in the absence of Hsp40. Mutational studies have demonstrated the importance of charged amino-acid residues in the V389–D393 interdomain-linker region for the coupling between the bound nucleotide state and peptide-binding affinity.7 Exchange of ADP by ATP is very low, and nucleotide exchange factors (NEFs) [such as Hsp1101,8] are needed to promote the release of ADP and to restart the cycle of binding/release.
Fig. 1.

(A) The experimental structure of E. coli Hsp70 chaperone (DnaK) in the ADP-bound state (2KHO).9 The substrate-binding domain (SBD) is on the top and the nucleotide-binding domain (NBD) is on the bottom of the picture. The C-terminal three-helix bundle (SBD-α; E509-Q603) part of the substrate binding domain is packed to the β-sandwich part (SBD-β; V394-N508). The subdomains of NBD5,6 are: Ia (residues I4-P37, P112-D182, and K363-T383), Ib (residues S38-A111), IIa (residues K183-L227 and D311-R362), and IIb (residues G228-E310). Subdomains Ia and Ib constitute subdomain NBD-I, of which they are the upper and lower lobes, respectively, and subdomains IIa and IIb constitute subdomain NBD-II of which they are the upper and lower lobe, respectively. The distances which were monitored experimentally11 are marked by white dashed lines and the corresponding residues are labeled; they are identified with the distances between SBD-β and SBD-α (N458···T563), between NBD-II and SBD-β (E318···V425) and between NBD-I and SBD-α (G132···A523). L denotes the linker between NBD and SBD. Helix A+B (which is split into parts A and B in DnaK) denotes the N-terminal α-helix of SBD-α. (B) The experimental structure of yeast Sse1 ATP-bound Hsp110 co-chaperone (3C7N),8 highly homologous to Hsp70, which has the Hsc70 chaperone bound to the substrate-binding domain between SBD-β and SBD-α, which is a putative model of the SBD-open conformation of Hsp70s. The ADP-bound Hsc70 ligand of Hsp110 has been removed from the picture for clarity. The structure of ATP-bound Hsp110 shown in panel B can be considered as a plausible model of ATP-bound Hsp70. The drawings were done with PyMOL (http://www.pymol.org). The ribbons are colored blue to red from the N- to the C-terminus.
The structure of a complete Hsp70 chaperone from E. coli (DnaK) in the closed substrate-bound form has recently been determined by NMR [PDB ID: 2KHO9]. No experimental structure of any complete ATP-bound Hsp70 is yet available; however, analysis of the experimental structures of the Hsp110 NEF from yeast (Arabidopsis Shrunken Seed 1; Sse1) linked to the ADP-bound Hsc70 cognate chaperones [PDB IDs: 3D2E1 and 3C7N8], or forming a dimer [PBD code: 2QXL13], suggests that the experimental structures of ATP-bound Hsp110s are good models of the ATP-bound Hsp70s.5,9,13 In Hsp110, the C-terminal three-helix-bundle “lid” (hereafter referred to as SBD-α) is bound to the N-terminal section of the NBD (Figure 1B). These models are consistent with the available experimental data of ATP-bound Hsp70s because ATP binding to Hsc70 decreases its radius of gyration14 and the intrinsic tryptophan residue in the ATPase domain of DnaK is shielded from the solvent by packing against the C-terminal α-helix of the SBD upon ATP binding.10,15 The structure of ADP-bound (SBD-closed) DnaK9 and the model of an ATP-bound (SBD-open) structure provide a static picture of the conformational changes during the Hsp70 cycle;5,9 in the ADP-bound conformation, the SBD is separated from the NBD and the SBD-α closes the substrate-binding site on the β-sheet part of the SBD (hereafter referred to as SBD-β) (Figure 1A). ATP binding results in a close approach of the SBD to the NBD (interdomain communication)10,11 (Figure 1B).
Recently, by using fluorescence labeling of selected residues of Ssc1 from yeast and DnaK from E. coli, Mapa et al.11 determined that, in the ADP-bound state, the SBD is far from the NBD while, upon addition of ATP, SBD-α is far away from SBD-β, and SBD-β is close to the NBD. Also, in the ATP-bound state, SBD-α and SBD-β are separated by about an 80Å distance (which is manifested as the only peak in the distance distribution centered at 80Å) while, in the ADP-bound state, a second peak in the distance distribution centered at about 50 Å appears; the height and the surface under this peak increased when the peptide substrate and a J-protein were added. (See Figure 1A for the definition of this distance). Based on the experimental structures of apo- and nucleotide-bound forms of various Hsp70, Hsc70, and Hsp110 chaperones and their nucleotide-binding domains, as well as on the solution NMR study of the 44-kDa NBD of Hsp70 from Thermus thermophilus in the ADP- and 5′-adenylyl-β, γ-imidodiphosphate (AMPPNP)-bound states (where AMPPNP is an ATP analogue),5 Zuiderweg and coworkers5,9 concluded that rotation of NBD-II with respect to NBD-I occurs upon nucleotide binding. This rotation exposed the hydrophobic cleft between the top parts of the two sub-domains (Ia and IIa; Figure 1), where the extended linker segment that connects the SBD to the NBD joins the β-sheet at the sub-domain IIa as an additional strand. This process brings the SBD close to the NBD, which subsequently enables SBD-α to bind to NBD-I when the SBD is opened following substrate dissociation from the SBD.
The experimental studies mentioned above5,11 shed light on the conformational changes that occur during substrate or ATP/ADP binding. Molecular simulations, carried out by using a tool capable of covering a time scale long enough to observe these transitions, can enable us to put together the individual events observed experimentally and, consequently, provide a comprehensive picture of chaperone opening. Recently,6 we have carried out canonical all-atom simulations of fragments of the cycle of human Hsp70 chaperones by using all-atom molecular dynamics in explicit solvent with the GROMACS package and the GROMOS96 ffG43a1 force field16 and the Gaussian elastic network model.17,18 We found a normal mode that could initiate a transition from the closed to the open conformation. However, due to the large computational cost of all-atom simulations, the time-scale of this all-atom approach was limited to several hundred nanoseconds which was not enough to observe a transition between the closed and the open conformation, in which the rotation of the NBD-II is coupled to the opening of the SBD and to a contraction of the full structure.6 Therefore, to extend the time scale of simulations, in the present study, we carried out molecular dynamics and replica-exchange molecular dynamics simulations of the Hsp70 chaperone from E. coli (DnaK) with the use of the physics-based coarse-grained UNRES force field19–22 developed in our laboratory. Because of faster energy calculations compared to that of all-atom approaches, and the averaging out of the degrees of freedom that are not present in the united-residue representation, the molecular dynamics implementation of UNRES23,24 offers about an effectively 1000-fold extension of the time scale of simulations, compared to all-atom simulations with explicit solvent.24 The effect of ATP on the conformational dynamics was simulated by restraining the NBD in an ATP-bound or nucleotide-free/ADP-bound conformation.
2 Methods
2.1 UNRES force field
In the UNRES force field19–22 a polypeptide chain is represented by a sequence of α-carbon atoms with united side chains (SC) attached to them and peptide groups (p) positioned halfway between two consecutive α-carbons (Figure 2). The effective energy function is defined as the free energy of the chain constrained to a given coarse-grained conformation plus the surrounding solvent [this free energy is termed a restricted free energy (RFE) or a potential of mean force (PMF)19,21]. The energy of the virtual-bond chain is expressed by eq. (1).
Fig. 2.

The UNRES model of the polypeptide chain. Dark circles represent united peptide groups (p), open circles represent the Cα atoms, which serve as geometric points. Ellipsoids represent side chains, with their centers of mass at the SC’s. The p’s are located half-way between two consecutive Cα atoms. The virtual-bond angles θ, the virtual-bond dihedral angles γ, and the angles αSC and βSC that define the location of a side chain with respect to the backbone are also indicated.
| (1) |
where θi is the backbone virtual-bond angle, γi is the backbone virtual-bond-dihedral angle, αi and βi are the angles defining the location of the united side-chain center of residue i (Figure 2), and di is the length of the ith virtual bond, which is either a Cα···Cα virtual bond or Cα···SC virtual bond. Each term is multiplied by an appropriate weight, wx, and the terms corresponding to factors of order higher than 1 are additionally multiplied by the respective temperature factors which were introduced in our recent work20 and which reflect the dependence of the first generalized-cumulant term in those factors on temperature, as discussed in refs. 20 and 25. The factors fn are defined by eq. (2).
| (2) |
where T° = 300K.
The term USCiSCj represents the mean free energy of the hydrophobic (hydrophilic) inter-actions between the side chains, which implicitly contain the contributions from the interactions of the side chain with the solvent. The term USCipj denotes the excluded-volume potential of the side-chain – peptide-group interactions. The peptide-group interaction potential is split into two parts: the Lennard-Jones interaction energy between peptide-group centers ( ) and the average electrostatic energy between peptide-group dipoles ( ); the second of these terms accounts for the tendency to form backbone hydrogen bonds between peptide groups pi and pj. The terms Utor, Utord, Ub, and Urot, and Ubond are the virtual-bond-dihedral angle torsional terms, virtual-bond dihedral angle double-torsional terms, virtual-bond angle bending terms, side-chain rotamer, and virtual-bond-deformation terms; these terms account for the local propensities of the polypeptide chain. The terms represent correlation or multibody contributions from the coupling between backbone-local and backbone-electrostatic interactions, and the terms are correlation contributions involving m consecutive peptide groups; they are, therefore, termed turn contributions. The multibody terms are indispensable for reproduction of regular α-helical and β-sheet structures.19,26,27 The energy-term weights are determined by force-field calibration to reproduce the structure and folding thermodynamics of selected training proteins; in this work we used the force field calibrated with the 1GAB protein.20
2.2 Molecular dynamics and replica-exchange molecular dynamics with UNRES
The canonical molecular dynamics implementation of UNRES has been described in our earlier work.23,24,28 Briefly, the Cα···Cα and Cα···SC virtual-bond vectors (Figure 2) are gathered into a vector of generalized coordinates q = (dC°, dC1, …, dCn, dX1, dX2, …, dXn)T. The vector dC° specifies the position of the first Cα atom of the chain, dCi specifies the virtual-bond vector, while dXi specifies the virtual-bond vector. The vectors q̇ and q̈ denote generalized velocities and generalized accelerations, respectively. The virtual bonds are represented as elastic rods with mass distribution that scales with the length of a rod.28 The Cartesian coordinates of the interacting sites x = (rp1, rp1, …, rpN−1, rSC1, rSC2, …, rSCN)T are related to the generalized coordinates by a linear transformation x = Aq, where A is a constant matrix with ai(k),j = 0 [i(k) being a Cartesian coordinate of site k] if the coordinates up to j correspond to virtual-bond vectors of the part of the chain to the right of site k, ai(k),j = 1 if the coordinates correspond to the virtual-bond vectors to the left of site k or to a Cα···SC virtual bond containing the side chain with index k, and ai(k),j = 1/2 if the coordinates correspond to the virtual-bond vector containing the peptide group with index i(k). The same relationship holds between the time derivatives of x and q.
In matrix notation, the complete equations of motion for Langevin dynamics with the UNRES force field can be written as eq. (3).24
| (3) |
where M is the diagonal matrix of masses of the sites (united peptide groups and united side chains) such that mii is the mass of the site corresponding to the i-th generalized coordinate, H (a diagonal matrix) is the part of the inertia matrix corresponding to the internal stretching motion of the virtual bonds with hii = (1/12)mp (mp being the mass of a peptide group) for peptide groups and hii = (1/3)mSCj(i) (mSCj(i) being the mass of the side chain corresponding to the i-th generalized coordinates) for side chains, Γ is the diagonal friction tensor (represented by the friction matrix) acting on the interacting sites such that γii is the coefficient of the site corresponding to the i-th coordinate, frand is the vector of random forces acting on interacting sites, U is the UNRES potential energy defined by eq. (1), and ∇q denotes the gradient in q. The random forces (frand) are calculated from eq. (4).29–31
| (4) |
where is the i-th component of the random force vector frand, γi is the friction coefficient associated with the i-th coordinate of the interaction sites, R is the universal gas constant, T is the absolute temperature, δt is the integration time step, and N(0, 1) is the normal distribution with zero mean and unit variance. Together, the random and friction forces constitute a thermostat that maintains the average temperature at the pre-set value. To run canonical simulations without explicit inclusion of random forces, we implemented24,32 the Berendsen,33 Nosé-Hoover,34 and Nosé-Poincaré35 thermostats.
To sample the conformational space more efficiently than by canonical MD, we extended36,37 the UNRES/MD approach with the replica-exchange38 and multiplexing replica-exchange39 molecular dynamics method (REMD and MREMD, respectively). In the REMD method, M canonical MD simulations are carried out simultaneously, each one at a different temperature. Initially the temperatures increase with the sequential number of simulations (trajectories). After every m < M steps, an exchange of temperatures between neighboring trajectories (in the order from 1 to M) is attempted, the decision about the exchange being made based on the Metropolis criterion which, taking into account the temperature dependence of the force field, is expressed by eq. (5).
| (5) |
where βi = 1/RTi, Ti being the absolute temperature corresponding to the ith trajectory, and Xi denotes the variables of the UNRES conformation of the ith trajectory at the attempted exchange point. If Δ ≤ 0, Ti and Ti+1 are exchanged, otherwise the exchange is performed with probability exp(−Δ).
The multiplexing variant of the REMD method (MREMD)39 differs from the REMD method in that several trajectories are run at a given temperature. Each set of trajectories run at a given temperature constitutes a layer. Exchanges are attempted not only within a single layer but also between layers. In our very recent study,37 we demonstrated that such a procedure increases the power of REMD very considerably, and convergence of the thermodynamic quantities is achieved much faster. The weighted histogram analysis method (WHAM)40 was implemented20 to compute heat-capacity and ensemble averages as functions of temperature and to determine conformational ensembles at various temperatures from the UNRES/REMD and UNRES/MREMD runs.
2.3 Simulation procedures
2.3.1 UNRES/MREMD simulation of the SBD-α from DnaK
To determine if SBD-α from 2KHO can fold independently with UNRES, we ran an MREMD simulation of this subdomain (residues D530–Q603 of E. coli DnaK) at the following 32 temperatures: T = 250, 255, 260, 265, 270, 275, 280, 285, 290, 295, 300, 305, 310, 315, 320, 325, 330, 335, 340, 345, 350, 355, 360, 370, 380, 390, 400, 410, 420, 440, 460, and 480 K, respectively. Four trajectories were run at a given temperature; therefore, the total number of trajectories in the MREMD simulation was 128. Each trajectory consisted of 22,000,000 steps and exchange of replicas took place every 20,000 steps. The time step was δt = 4.89 fs. The Berendsen thermostat33 with the coupling parameter τ = 48.9 fs was used, as in our earlier work.24 No distance restraints were imposed in these calculations. All trajectories were started from an extended structure. The snapshots from the last 2,000,000 steps were used to compute averages, which was carried out with the weighted histogram analysis method (WHAM),40 as described previously.20
2.3.2 UNRES/MD canonical simulations of the conformational dynamics of DnaK
All canonical UNRES/MD simulations for the complete E. coli Hsp70 chaperone (DnaK) were started from the experimental 2KHO structure.9 Before the production simulations, 100,000 MD steps were run with a small time step (δt = 0.5 fs) and restraints imposed on all non-sequential Cα···Cα distances, in order to obtain reasonably relaxed conformations.
Because, at present, UNRES cannot handle all α +β structures, in all simulations carried out for the complete DnaK structure, very weak harmonic restraints were imposed on the α + β and β-structure domains of the protein (NBD-I, NBD-II, and SBD-β). No restraints were imposed on SBD-α because, as shown in section 3.1, UNRES is able to fold SBD-α. These restraints had the following form:
| (6) |
where dij is the distance between the Cα atoms of a pair of residues on which a restraint is imposed, is the corresponding distance in the reference structure (here the experimental structure of 2KHO), and kij is the force constant pertaining to the restraint between residues i and j, as given by eq. 7 [expressed in kcal/(mol×Å2)].
| (7) |
Canonical Langevin dynamics simulations for the E. coli Hsp70 chaperone (DnaK) were run at T = 290 K and 300 K. To accelerate simulations, the viscosity of water was scaled down by a factor of 0.01, as in our earlier work.23 Three series of 16 independent trajectories each, each trajectory lasting 36,000,000 steps, 4.89 fs per step length, were run; 8 trajectories in each series at T = 290 K and 8 at T = 300 K. For each trajectory, the total duration of the simulations was thus 0.18 μs UNRES time and about 0.2 ms real time, taking into account the effect of removing the fast degrees of freedom.23
In the first series of 16 trajectories, hereafter referred to as RI-RII, restraints [eq. (6)] were imposed on most of the NBD-I except the interdomain interface (from I4 to E171), on most of NBD-II except the interdomain interface and its C-terminal α-helix that belongs to the Ia sub-domain (Figure 1) (from G186 to N366), and on SBD-β (from V394 to S505). The residues of the inter-domain border were free of restraints to facilitate free domain motion to occur in the system. This system can be considered a model of nucleotide-free DnaK. In the second series, hereafter referred to as RI-II, almost the whole NBD domain (except for the C-terminal α-helical segment) (from I4 to N366), as well as SBD-β were restrained by all Cα···Cα distances from the 2KHO structure, i.e., these simulations were biased towards the NBD-open (SBD-closed) conformations and can be considered to model ADP-bound DnaK. Finally, in the third series of simulations, hereafter referred to as RI-II-small, the whole NBD was restrained by all Cα···Cα distances corresponding to the closed (ATP-bound) conformation. This run was carried out to simulate the presence of ATP because the present UNRES model does not yet treat protein-nucleotide interactions explicitly. To obtain the corresponding reference Cα···Cα distances, we modeled the putative SBD-open (and NBD-closed) conformation of 2KHO by using the MODELLER software41 and the Hsp110 NEF from yeast (3C7N:A) as a template. SBD-β was restrained by using the distances computed from the 2KHO structure. The restraints are illustrated in Figure 3.
Fig. 3.

Illustration of the Cα -distance restraints (B – D; the parts mostly blue-colored corresponding to NBD-I and those mostly green-colored corresponding to NBD-II) imposed on the nucleotide-binding domain (A) of DnaK from E. coli (PDB code: 2KHO). (B) The RI-RII restraint system in which only NBD-I (from I4 to E171) and NBD-II (from G186 to N366), excluding the boundary residues, are restrained to their conformations in the 2KHO structure. (C) The RI-II restraint system in which the whole NBD (from I4 to N366) excluding its C-terminal region is restrained to its conformation in 2KHO. (D) The RI-II-small restraint system in which the whole NBD is restrained to the putative ATP-bound conformation (with NBD closed), obtained with MODELLER41 using 3C7N:A as template. It should be noted that the distance restraints (from the 2KHO structure) between RI and RII were also imposed on SBD-β (from V394 to S505), not shown in this Figure.
2.3.3 UNRES/MREMD simulation of DnaK
As stated in subsection 2.2, multiplexed replica exchange molecular dynamics enables us to explore the conformational space of a system more extensively than canonical molecular dynamics does.36–39 We, therefore, carried out an MREMD simulation for the E. coli DnaK, starting from the experimental 2KHO structure. The RI-RII-type distance restraints were implemented (see subsection 2.3.2), i.e., NBD-I, NBD-II, and SBD-β were restrained but these domains, as well as the unrestrained SBD-α domain, could move relative to each other.
The MREMD simulation was run at the same 32 temperatures mentioned in section 2.3.1. Four Langevin-dynamics trajectories per temperature (128 trajectories total) and 20,000,000 steps per trajectory were run with a 4.89 fs time step. The replicas were exchanged and snapshots recorded every 20,000 steps. The snapshots from the last 2,000,000 steps (of each trajectory) were taken for further analysis, which was carried out with the weighted histogram analysis method (WHAM),40 as described previously.20
3 Results and Discussion
3.1 UNRES/MREMD simulations of SBD-α
The dependence of the heat capacity and ensemble-averaged Cα root-mean-square deviation (RMSD) from residues D530–Q603 of the experimental 2KHO structure on temperature, and the superposition of the Cα trace of the average conformation of the most probable cluster of conformations at T = 290 K on that of the D530-Q603 fragment of the experimental structure of 2KHO, are shown in Figure 4. It can be seen that the ensemble-averaged RMSD drops to about 5.2 Å at T = 310 K, and that the major drop of RMSD coincides with the major heat-capacity peak. The RMSD of the average structure of the most probable cluster of conformations (comprising 90 % of the ensemble at that temperature) is 3.3 Å. Thus, the UNRES force field is able to fold SBD-α of 2KHO in unrestricted simulations and, consequently, this part of the 2KHO structure can be maintained unrestrained during simulations of the whole chaperone, which is very important because SBD-α undergoes the largest displacement during the chaperone cycle.
Fig. 4.

Results of the UNRES/MREMD simulation of the C-terminal D530-Q603 fragment of DnaK from E. coli. (A) The heat-capacity (solid line) and ensemble-average Cα RMSD from the D530-Q603 of the 2KHO structure (dashed line) curves of the fragment studied. (B) Stereoscopic view of the Cα -trace of the average conformation of the most probable cluster of conformations at T=290 K obtained with UNRES/MREMD (thin gray cylinders) superposed on the experimental structure (thick black cylinders). The RMSD is 3.3 Å. The drawing was made with MOLMOL.42
3.2 UNRES/MD canonical simulations of the conformational dynamics of DnaK
For all three series of simulations from the relaxed native conformation of the DnaK from E. coli, we observed the opening of the SBD with subsequent binding of the separated SBD-α and SBD-β to NBD-I or NBD-II, respectively. We defined an “opening” to occur if the distance between residue N458 of SBD-β and residue T563 of SBD-α increased to more than 45 Å, and “binding” if the distance between residue G132 of NBD-I and residue A523 of SBD-α or the distance between residue V218 of NBD-II and residue K528 of SBD-α decreased below 35 Å. A trajectory was considered “opening-binding” if the two conditions defined above occurred simultaneously for at least 100,000 time steps. Similarly, a trajectory was considered as “binding-only” if the distance between the selected residues of SBD-α and NBD-I decreased below 35 Å without the concurrent “opening” of the SBD; this latter form of binding entailed binding of the closed SBD to the side of the NBD. A “closed” SBD was hence characterized by α and β sub-domains separated by distances smaller than 45 Å.
Two types of opening-binding events were observed, which are hereafter referred to as type I and type II, respectively. The trajectories corresponding to the type I event result in the final binding of SBD-α to the NBD-I, and SBD-β to the the top parts of NBD-I and NBD-II. A structure having undergone type I binding is displayed in Figure 5A: this conformation is analogous to that of the experimental open chaperone structures of Sse1 3C7N8 and 3D2E.1 For this type of opening-binding to occur, the SBD has to open, SBD-β has to bind to the top parts of NBD-I and NBD-II and helix A+B must straighten and move towards NBD-I. Snapshots from this trajectory are shown in Figure 6A. The type II opening-binding mode requires, additionally, a 180° rotation of the SBD with respect to the NBD. A representative conformation from such a type II binding event is shown in Figure 5B and a sample trajectory corresponding to this binding mode is shown in Figure 6B. The binding-only mode, in which the SBD remains closed but SBD-α binds to the NBD (Figure 5C), cannot be considered as an alternative open conformation, but only as a possible transition product towards an SBD-open structure due to the closed state of the SBD in this conformation. A sample trajectory is shown in Figure 6C.
Fig. 5.

Representative conformations of 2KHO obtained during UNRES/MD simulations, corresponding to (A) type I opening-binding, (B) type II opening binding and (C) binding only. The structure shown in panel A corresponds to a type RI-II run after 66 ns UNRES time, while the structures shown in panels B and C correspond to two separate trajectories from type RI-RII runs after 45 ns and 51 ns UNRES time, respectively. The drawings were done with PyMOL (http://www.pymol.org) and the backbones of the UNRES conformations were converted to all-atom representation by using the knowledge-based algorithm developed by Gront et al.43 to enable to draw the structures in ribbon representation.
Fig. 6.

Snapshots from representatives of the three types of canonical MD trajectories of 2KHO run with the UNRES force field that are discussed in the text. (A) type I opening-binding trajectory, in which SBD opening is accompanied by binding of SBD-α to NBD-I, resulting in conformations corresponding to that of ATP- and co-chaperone bound structures of yeast Sse1 [PDB IDs: 3C7N8 or 3D2E1],1,9 in which SBD-β binds to NBD from the back side and SBD-α runs from the back to the front of NBD, binding to NBD-I. (B) type II opening-binding trajectory which results in structures with SBD-β bound to the front side of NBD-II and SBD-α bound to the back side of NBD-I. (C) Binding-only trajectory, in which whole SBD binds to NBD without opening. It should be noted that the UNRES simulation time is about 3 orders of magnitude smaller than the actual time.24 All trajectories were obtained in the simulations with the RI-RII type restraints, i.e., without restraining the relative motion of the NBD-I and NBD-II domains. The drawings were done with PyMOL (http://www.pymol.org) and the backbones of the UNRES conformations were converted to all-atom representation by using the knowledge-based algorithm developed by Gront et al.43 to enable to draw the structures in ribbon representation.
The number of opening-binding incidences depended on the series of the simulation, and was greatest for RI-II-small (with the NBD restrained in the ATP-bound conformation), and the smallest for RI-II (with the NBD restrained in the ADP-bound conformation as in the experimental 2KHO structure). The numbers of binding incidences are summarized in Table 1. Since the RI-II-small system simulates DnaK in the presence of ATP by imposing distance restraints on the NBD, this result is in agreement with experimental observations that ATP induces the transition from the SBD-closed to the SBD-open conformation and, thereby, substrate release.7,10,11 It should also be noted that the type II opening-binding mode occurred more frequently than type I (Table 1). The approach of the whole SBD to the NBD without opening SBD (binding-only) was observed (Table 1) in all other trajectories. This is not surprising because the possibility of collision of SBD with NBD is expected to be high given that they are connected by a short linker.
Table 1.
Number of opening-binding and binding-only incidences in canonical simulations of DnaK
| System | # incidences | |||
|---|---|---|---|---|
| opening-binding | binding-only | |||
| type I | type II | total | ||
| RI-RII | 1 | 2 | 3 | 13 |
| RI-II | 1 | 1 | 2 | 14 |
| RI-II-small | 2 | 4 | 6 | 10 |
| total | 4 | 7 | 11 | 37 |
To analyze the cumulative statistics of conformational changes, we constructed histograms of the frequency of the types of conformations of 2KHO encountered during the MD simulation pathways over all 16 trajectories of each run type. The histograms are shown in Figure 7. It can be seen that the binding-only event is the most frequent for all three systems (about 60 % or higher) and opening-binding motion (both type I, type II and transitional type I+II) is the most frequent for the RI-II-small system in which the bound ATP is simulated through distance restraints imposed on NBD-I. However, the RI-II system has slightly higher opening-binding frequency (about 14 %) compared to the RI-RII system (about 12 %) and only slightly lower opening-binding frequency compared to the RI-II-small system. These data do not conform with the number of opening-binding trajectories reported in Table 1 [the number of opening-binding trajectories is 6 for the RI-II-small system, i.e., much greater than for the RI-II (2) or the RI-RII system (3)]. However, it can be seen from Figure 7 that the number of opening-only frequency (i.e., situations such that the SBD is open and its parts farther than cut-off distances from selected residues of NBD-I or NBD-II) is the greatest for the RI-II-small system (about 19 %), still remarkable for the RI-RII system (about 7 %) and very small for the RI-II system (about 1 %). It can, therefore, be concluded that, for the RI-II system, opening of the SBD always involves binding of SBD-α to the NBD, while for the RI-RII and the RI-II-small systems the SBD-α domain is more flexible with respect to the NBD after SBD opening. It can also be seen that the system remains in the open-bound state for type I for a longer time than for type II opening-binding. Because type II opening-binding occurred more frequently than type I opening-binding for the RI-II-small system, this observation explains why simultaneous opening of the SBD and binding SBD-α to the NBD is not as frequent for this system compared to the RI-II system as the difference in the number of opening-binding trajectories suggest.
Fig. 7.

Histograms of the frequency of occurrence of conformations of different types for whole sets of 16 trajectories each of RI-RII (A), RI-II (B), and RI-II-small (C) runs. Labeled bars show the percentage of the following structures: Closed: SBD closed and far from the NBD (as in 2KHO structure); Open: SBD open and far from the NBD; Closed binding or binding-only: SBD closed and docked to the NBD; Open binding: SBD open and its SBD-α and SBD-β subdomains docked to the NBD (binding mode ignored); I: type I binding (SBD open, SBD-α docked to NBD-I and SBD-β docked to NBD-II); II: type II binding (SBD-α docked to NBD-II and SBD-β docked to NBD-I); I+II: SBD-α and SBD-β docked close to the interface between NBD-I and NBD-II. See the first paragraph of section 3.2 for the distance cut-off criteria of binding.
For both type I and type II opening-binding events, the SBD-α approach towards the NBD usually begins by straightening the N-terminal segment of SBD (composed of helices A and B) (bent in Figure 1A), resulting in the formation of a long A+B helix as in the open structure of chain A of Sse1 (3C7N:A) (Figure 1B). It should be noted that, in our recent all-atom MD simulations6 of the open conformation of the human Hsp70, the chaperone model that was built from the yeast Hsp110 structure (PBD ID: 3C7N:A)8 using homology modeling, we observed breaking of helix A+B, resulting in a more tight binding of SBD-α to NBD-I. We did not observe this tight binding mode in the present UNRES simulations of DnaK for type I opening-binding trajectories, for which helix A+B is only slightly kinked in the final conformations (Figures 5A and 6A). However, the A+B helix became significantly kinked, resulting in a tighter binding for the type II opening-binding trajectory (Figures 5B and 6B).
It should be noted that the splitting of SBD into SBD-α and SBD-β, as well as the motions of the whole SBD towards NBD [for the binding-only trajectories, (Figure 6C)], occur very fast, in about 10–20 ns of UNRES simulation time. This acceleration happens because the UNRES time scale is 3–4 orders of magnitude wider than the physical time scale, due to the averaging out of the secondary degrees of freedom, including the solvent degrees of freedom23,24 and, additionally, scaling down the viscosity of water while computing the friction and random forces (eqs 3 and 4) by a factor of 0.01 (see section 2.3.2). Scaling down the viscosity of water has a major effect on the time scale of the simulated trajectories because SBD and NBD do not interact with each other in the initial structure and, consequently, their approach is delayed mostly by the friction of water.
The Hsp110s (NEFs) such as Sse1 (PBD: 3C7N:A and 3D2E) in ATP-bound SBD-open conformations are considered to model the SBD-open conformations of Hsp70s, because they share the same structural elements, even though they perform different functions.2,6,9 The structures that appear in type I opening-binding trajectories are topologically identical with those of the open conformation of Sse1, while those that appear in type II opening-binding trajectories are not. It should also be noted, though, that the type II binding mode (Figure 6B) could not be observed in the ATP-bound Hsp110 NEF structures,1,8 considered as models of ATP-bound Hsp70, because the front side of NBD, where SBD-β is bound in DnaK, is already occupied by ADP-bound Hsc70.1,8,13 Since there is no experimental structure of an ATP-bound Hsp70, the type II open-bound structure (Figure 6B) cannot be dismissed.
To quantify the conformational changes that occur during simulations, we analyzed the time evolution of the distances between NBD-II and SBD-β [Cα(E318)···Cα(V425)], between SBD-β and SBD-α [Cα (N458)···Cα (T563)], and NBD-I and SBD-α [Cα (G132)···Cα (A523)]. The first two of these distances were monitored in DnaK by Mapa et al.11 by single-molecule fluorescence spectroscopy. We also monitored the time dependence of the kink angle η6 between helices A and B (which become a long A+B helix after the transition from the SBD-closed to the SBD-open form; Figures 1 and 8A), and the angles δ and τ that describe the relative orientation of NBD-I and NBD-II. The distances are illustrated in Figure 1A and the angles in Figure 8, respectively. The variations of the above-mentioned distances and angles with time for samples type I and type II opening-binding trajectories, and a sample binding-only trajectory (without SBD opening) are shown in Figure 9.
Fig. 8.

Definitions of the distances and angles plotted in Figure 9. (A) The kink angle η between the long axes of helices A and B of SBD, computed from the Cα coordinates. Helix A extends from residue E511 to residue N522 and helix B from residue A525 to residue E551. (B) The angle δ between the center of mass of subdomain Ib, the center mass of combined subdomains Ia and IIa, and the center of mass of subdomain IIb. (C) The dihedral angle τ that specifies the displacement of NBD-I and NBD-II out of the largest plane (
 ) intersecting the whole NBD. This plane is spanned by the two shortest principal axes of NBD. The angle τ is the dihedral angle between planes 1 and 2, where plane 1 is spanned by vectors c and a and plane 2 is spanned by vectors c and b. Vectors a and b are the longest axes of NBD-I and NBD-II, respectively, while vector c is the projection of the vector linking the centers of NBD-I and NBD-II on the plane
. (D) The distances between the selected residues from NBD-I, NBD-II, SBD-α, and SBD-β discussed in the text.
) intersecting the whole NBD. This plane is spanned by the two shortest principal axes of NBD. The angle τ is the dihedral angle between planes 1 and 2, where plane 1 is spanned by vectors c and a and plane 2 is spanned by vectors c and b. Vectors a and b are the longest axes of NBD-I and NBD-II, respectively, while vector c is the projection of the vector linking the centers of NBD-I and NBD-II on the plane
. (D) The distances between the selected residues from NBD-I, NBD-II, SBD-α, and SBD-β discussed in the text.
Fig. 9.

Bottom panels: time evolution of the Cα(E318)···Cα(V425) (red), Cα(N458)···Cα (T563) (green), and Cα(G132)···Cα(A523) distances (blue), middle panels: time evolution of the angles δ (green) and τ (blue) defined in Figure 8, upper panels: time evolution of the kink angle η (red) for three representative trajectories shown in Figure 6: type I opening-binding (A), type II opening-binding (B), and binding-only (C). The circles at the start of the plots indicate the values of the distances and angles calculated from the 2KHO structure. All trajectories were obtained in the simulations with the RI-RII type restraints, i.e., without restraining the relative motion of the NBD-I and NBD-II domains.
For the type I opening-binding trajectories (Figure 6A), the Cα(E318)···Cα(V425) distance decreases with simulation time, which demonstrates the approach of SBD-β towards NBD-II, in agreement with the fluorescence study by Mapa et al.11 (Figure 9A). At the same time, the Cα(N458)···Cα(T563) distance increases, which demonstrates that SBD-α dissociates from SBD-β. Finally, the Cα(G132)···Cα(A523) distance decreases to reach the minimum after t = 13 ns, which demonstrates the binding of SBD-α to NBD-I; then the distance between the two sub-domains increases (however, still remaining small) because SBD-α moves towards the boundary between NBD-I and NBD-II, thus moving away from residue G132, which is on the left side of NBD-I. Consistent with Figure 6A, the angle η between helix A and helix B increases to an average value of about 150° in the initial phase of simulation, which reflects merging of helices A and B into the long helix A+B, characteristic of the putative SBD-open conformation (Figure 1B).
For the type II opening-binding trajectory (Figure 6B), the Cα(N458)···Cα(T563) distance increases with time and the Cα(G132)···Cα(A523) distance decreases with time, demonstrating SBD opening and binding of SBD-α to NBD-I (Figure 9B). As for the type I opening-binding trajectory (Figure 9A), the Cα(G132)···Cα(A523) distance initially decreases to about 20 Å and then, after about 18 ns of simulations starts to increase to reach an asymptotic value of about 35 Å (Figure 9B). This is caused by moving SBD-α towards the right side of NBD-II, i.e., away from residue G132. As mentioned earlier in this section, for this trajectory, the long helix has kinked again after binding of SBD-α to NBD-II to make tighter contacts with NBD-II (Figure 6B), which is reflected in Figure 9B as the decrease of the angle η after its initial increase.
For the binding-only trajectories (Figure 6C), the Cα(E318)···Cα(V425) and Cα(G132)···Cα(A523) distances decrease with time and the Cα(N458)···Cα(T563) distance does not increase with time, meaning that the whole SBD approaches NBD without opening. Consistent with this observation, helices A and B do not merge into a long helix but the angle η even decreases to maximize the contacts between SBD-α and SBD-β (Figure 9C).
According to experimental5 and all-atom molecular dynamics simulation44 studies of the dynamics of the Hsp70 NBDs, ATP binding to the NBD reduces the angle δ between NBD-I and NBD-II (Figure 8B), which results in the exposure of the hydrophobic pocket at the top of the NBD. Further, the flexible linker binds to the hydrophobic pocket to form an additional strand of the β-sheet at the top of the IIa subdomain, which results in reducing the distance between the NBD and the SBD9 and, after SBD opening, in formation of the SBD-open conformation of Hsp70. The results summarized in Table 1 demonstrate that imposing distance restraints on the NDB that correspond to the ATP-bound conformation (the RI-RII-small restraint set) increase the number of opening-binding events. To investigate in detail what conformational changes in the NBD occur during the transition from the SBD-closed to the SBD-open conformation, we monitored the angles between the subdomains of NBD. The first of these angles was the angle δ between the the center subdomain Ib, the center of combined subdomains Ia and IIa, and the center of subdomain IIb (Figure 8B). The angle δ is identical to the corresponding inter-domain angle calculated in earlier analyzes of all-atom molecular dynamics trajectories of Hsp70s6 or isolated NBD from Hsp70,44 except that we used Cα coordinates to compute the centers, while mass centers were calculated in these earlier two studies. This difference between the two procedures results only in negligible differences in the results, as shown in Table 2, where we summarized the angles calculated by both methods by using the two definitions of domain centers for four experimental structures: 2KHO (ADP-bound), 3C7N:B (ADP-bound), 1KAX (ATP-bound), and 3C7N:A (ATP-bound). Because the angle δ does not specify whether the motion of the two parts of NBD occurs mostly in the plane of the NBD (i.e., in the plane containing the largest projection of NBD) or out of this plane, we also calculated the dihedral angle τ defined in Figure 8C. Additionally, we also calculated the kink angle η between the helices A and B. The variations of the three angles defined above with time for the representatives of the three types of trajectories (type I and type II opening-binding, and binding-only) are shown in Figure 9.
Table 2.
Boundaries of the subdomains of NBD and the angles δ and τ describing the rotation of NBD-II with respect to NBD-I for two selected open (2KHO and 3C7N:B) and two closed (1KAX and 3C7N:A) experimental structures
| Structure | Subdomain boundaries
|
δ [deg]
|
τ[deg]
|
|||||||
|---|---|---|---|---|---|---|---|---|---|---|
| Ia | Ib | NBD-I (Ia+Ib) | IIa | IIb (IIa+IIb) | NBD-II | Cα | all atom | Cα | all atom | |
| 2KHO | I4–P37 | I4–D182 | K183-L227 | |||||||
| P112–D182 | S38–A111 | K363–T383 | D311–R362 | G228–E310 | K183–R362 | 60.7 | 61.0 | 49.9 | 50.0 | |
| K363–T383 | ||||||||||
|
| ||||||||||
| 3C7N:B | K3–P39 | K3–K188 | V189–L228 | |||||||
| P116–K188 | S40–Y115 | K361–K384 | A307–L359 | G229–N306 | A180–N360 | 67.6 | 67.1 | 49.8 | 48.2 | |
| K361–K384 | ||||||||||
|
| ||||||||||
| 1KAX | G4–P39 | G4–K188 | V189–L228 | |||||||
| P116–K188 | S40–Y115 | K361–S381 | A307–L359 | G229–N306 | A180–N360 | 60.0 | 58.0 | 46.7 | 45.6 | |
| K361–S381 | ||||||||||
|
| ||||||||||
| 3C7N:A | M1–V39 | M1–I184 | F185–R235 | |||||||
| I123–I184 | V40–F122 | L362–P385 | V310–P361 | D236–L309 | F185–P361 | 54.6 | 53.1 | 36.3 | 38.3 | |
| L362–P385 | ||||||||||
It can be seen from Figure 9 that both the angles δ and τ decrease with time from the starting conformation, and that this decrease correlates with the approach of SBD-β and SBD-α towards opposite faces of the NBD in type I and type II opening-binding trajectories. The change of the dihedral angle τ, which quantifies the out-of-plane motion of NBD-I with respect to NBD-II (Figure 8C), concurs with that of the angle δ between the centers of subdomains of Ib, Ia+IIa, and IIb, and demonstrates that the motion takes place out of the largest plane intersecting both NBD-I and NBD-II (as a “scissor-like” motion; see Figure 8B for illustration). On the other hand, the δ and τ angles decreased by at least 5° for all trajectories with the RI-II-small and with RI-II-type restraints; only for 4 of the trajectories run with the RI-II-type restraints (which simulate the presence of ADP), did these angles oscillate at the initial values for most of the simulations (none of the corresponding trajectories was an opening-binding trajectory). The values of δ and τ averaged over the first 25 ns over all trajectories of a set corresponding to a given type of restraints were δ̄ = 47°, τ̄ = 35° for RI-RII-restrained trajectories, δ̄ = 46°, τ̄ = 36° for the RI-II-small-restrained trajectories, and δ̄ = 50°, τ̄ = 43° for the RI-II-restrained trajectories; i.e., only the RI-II-type trajectories, in which the NBD was forced to maintain the conformation as in SBD-closed structures, differed remarkably from those run with the other type restraints. This means that the failure to open the SBD before it binds to the NBD, and not the failure to reorient NBD-I with respect to NBD-II in time, caused a low success rate of obtaining the SBD-open conformations in our simulations.
In Table 2 we summarized the δ and τ angles (computed both from Cα only, and from all atomic coordinates) for two open (ADP-bound) and two closed (ATP-bound) conformations of the NBD in the experimental structures of 2KHO, 3C7N:B, 1KAX, and 3C7N:A, respectively. It can be seen that both angles are larger in the closed and smaller in the open NBD structures. The motion of the NBD-II relative to NBD-I was also seen in the normal mode contributing to the opening of the SBD of the closed conformation in our all-atom simulations of human Hsp70.6 Our all-atom simulations of human Hsp706 and the all-atom simulations of the isolated NBD by Woo et al.44 have also shown a decrease of the angle δ upon nucleotide binding. The solution NMR study of ADP- and AMPPNP-bound 44 kDa Hsp70 from Thermus thermophilus by Zuiderweg and coworkers5 showed that the rotation of the sub-domains of the NBD occurs upon ATP binding.
By analyzing the type I and type II opening-binding trajectories, we noted that the subdomain rotation described above triggers the rotation of the α-helix which runs from E369 to G380 with respect to NBD-II, with which it is associated through interactions with the E171–Y179 α-helix. The E369 – G380 α-helix is connected to SBD-β by a linker. Consequently, its motion switches the orientation of SBD-β from the top of NBD to the back side of this domain and brings it closer to NBD-I. This process is shown in Figure 10.
Fig. 10.

Illustration of the rotation of NBD-I with respect to NBD-II which brings NBD-β close to the back side of NBD-II. (A) 2KHO structure in which NBD-I crosses NBD-II (δ = 65°), (B) 3C7N structure in which NBD-I moves closer to a parallel orientation with respect to NBD-II (δ = 47°). (C) The structure from the trajectory shown in Figure 6A after 10 ps of simulations, in which NBD-II is nearly parallel to NBD-II (δ = 26°) (where δ is the angle between the long axes of NBD-I and NBD-II). It can also be seen that the “switch” (SW) α-helix which runs from E369 to G380 rotates with respect to NBD-II, following the rotation of NBD-I, with which it is associated through interactions with the E171-Y179 “holder” (HO) α-helix. The SW α-helix is connected to SBD-β by a linker. Consequently, its motion switches the orientation of SBD-β from the top of NBD to the back side of this domain and brings it closer to NBD-I; it also brings the linker segment closer to the β-sheet of NBD-II and enables it to join it as a β-strand in the 3C7N structure, thus fixing SBD at a short distance from the NBD. The drawings were done with PyMOL (http://www.pymol.org) and the backbones of the UNRES conformations were converted to all-atom representation by using the knowledge-based algorithm developed by Gront et al.43 to enable to draw the structures in ribbon representation.
3.3 UNRES/MREMD simulations of DnaK
Based on the results of MREMD simulations carried out as described in section 2.3.3, we constructed plots of the free-energy landscapes of 2KHO at various temperatures, using the same descriptors as in Figure 9. In the MREMD simulations we observed type I and type II opening-binding modes found in canonical simulations (Figures 6A and 6B) and the binding-only mode in which SBD did not open but packed against NBD (Figure 6C).
The potentials of mean force obtained at T = 300 K are shown in Figure 11. Part A of this Figure shows the section of the PMF plotted against the Cα(E318)···Cα(V425) and Cα(N458)···Cα(T563) distances (which can be considered as the distances between NBD-II and SBD-β, and SBD-β and SBD-α, respectively). The distances between the first two pairs of residues were monitored by Mapa et al.11 in their fluorescence-spectroscopy study of DnaK. It can be seen that, in agreement with the study of Mapa et al.,11 the smallest Cα(E318)···Cα(V425) distances (about 20 Å) correspond to the largest Cα(N458)···Cα(T563) distances (more than 70 Å); however, conformations with this feature are rare and are manifested in Figure 11A as two small PMF minima in the upper left corner of the plot. The sections which include the Cα(G132)···Cα(A523) distance (which can be considered as the distance between NBD-I and SBD-α) indicate that there is a PMF minimum corresponding to small values of the Cα(G132)···Cα(A523) and Cα(E318)···Cα(V425) distances (about 30 and 20 Å, respectively; Figure 11B); however, the closest approach of SBD-α towards NBD-I [the smallest Cα(G132)···Cα(A523) distances] occurs when SBD-β is farther away from NBD-II [larger Cα(E318)···Cα(V425) distances]. The reason for this observation is that a close or moderately close approach of SBD-α to NBD-I also occurs for type II opening-binding mode and for the binding-only mode, in which SBD-β is farther away from NBD-II but close to NBD-I; these binding modes occur in UNRES simulations more frequently than the type I opening-binding mode. It can be seen from Figure 11C that SBD-β can either be close to or far from SBD-α when SBD-α is bound to NBD-I [the shallow minima at the Cα(G132)···Cα(A523) distance of about 30 Å and the Cα(N458)···Cα(T563) distance of about 80 Å and at the Cα(G132)···Cα(A523) distance of about 15 Å and the Cα(N458)···Cα(T563) distance of about 30 Å, respectively, in Figure 11C], in agreement with the frequent appearance of binding-only trajectories, such as that shown in Figure 6C in canonical simulations. It should also be noted that the very shallow minima corresponding to SBD-α bound to NBD-I arise probably because ATP was not present in our simulations.
Fig. 11.
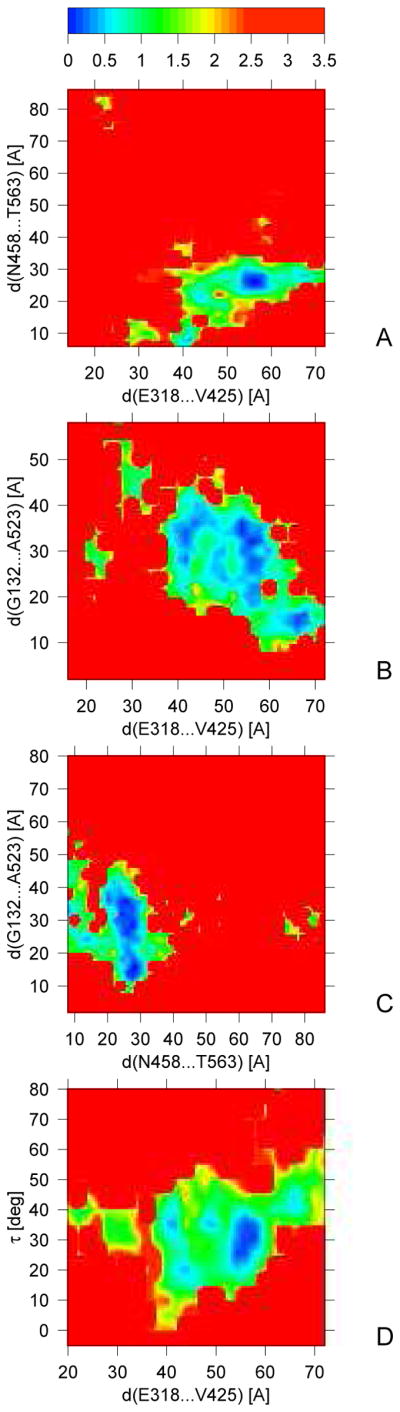
Sections of the free-energy surface of 2KHO in pairs of selected conformational descriptors at T = 300 K obtained from MREMD simulations. The color scale for energy (in kcal/mol) is shown in the upper panel.
From Figure 11D it can be concluded that, in the low PMF basin, the Cα(E318)···Cα(V425) distance increases with the dihedral angle τ between the planes of NBD-I and NBD-II, which confirms the conclusion from the canonical simulations (Figure 9) that these two structural parameters are correlated.
4 Conclusions
By using canonical and multiplexed replica exchange coarse-grained molecular dynamics with the UNRES force field in this work, we have simulated, for the first time, the complete spontaneous transition from the SBD-closed to SBD-open conformation of the Hsp70 chaperone from E. coli (DnaK). The canonical simulations were carried out in three modes corresponding to the unrestricted relative motion of subdomains NBD-I and NBD-II, restraining the relative orientation of these two domains to the ATP-bound (open) conformation, and restraining it to the ATP-bound (closed) conformation, respectively. We observed two opening-binding events (i.e., dissociation of SBD-α from SBD-β and binding of SBD-α to NBD-I): the type I event in which the resulting conformation is similar to the open conformations of Hsp110 chaperones (e.g., Sse1 chaperone from yeast; PDB structure 3C7N:A and 3D2E), which are highly homologous to Hsp70s (Figure 6A), and type II opening-binding event in which SBD-α binds to the opposite face of NBD-I [compared to that in the open structures of Hsp110s] (Figure 6B). We observed that restraining the NBD to the ATP-bound conformation increases the frequency of SBD opening and of the opening-binding transitions, in agreement with experiment.2,5,10,11
We found that the following two events occur along this transition and are very likely to facilitate or even initiate it: (i) rotation of NBD-I with respect to NBD-II from a “crossed” orientation to a more parallel orientation (Figure 10), resulting in the rotation of the “switch” α-helix (which runs from E369 to G380) towards the back side of NBD-II and (ii) straightening of helix A+B (which runs from N508 to G554 and is kinked at N522 in the closed structure), which results in the dissociation of SBD-α from SBD-β. Facilitating the transition by event (i) is also supported by the fact that it was observed more frequently in canonical simulations run with the NBD domain restrained in the conformation of similar ATP-bound structures of related chaperones than in simulations in which the relative rotation of the two subdomains of the NBD domain was unrestrained or restrained in the ADP-bound conformation (Table 1 and Figure 7).
The results of our study are consistent with the experiments performed thus far to decipher the mechanism of the action of Hsp70/Hsp110 chaperones.2,5,11 Rotation of the NBD-I and NBD-II domains with respect to each other has been observed upon the binding of AMPPNP to the Hsc70 NBD from Thermus thermophilus by Zuiderweg and coworkers.5,9 They suggested that this rotation opens the groove between the Ia and IIa sub-domains, so that the linker can bind to it to form a β-strand.9 Our results suggest that the rotation of the SW helix shown in Figure 10, which occurs together with the out-of-plane rotation of NBD-I with respect to NBD-II, is another key factor facilitating the binding because it brings the linker closer to the β-sheet of the IIa sub-domain. The rotation of the SW helix towards the back side of NBD-II after binding of an ATP analogue can be observed in Figure 4 of ref. 5.
Based on the results presented in sections 3.2 and 3.3, as well as the considerations of this section, a plausible mechanism of Hsp70 chaperone function based on ATP-induced scissor-like motion of the two parts of the NBD can be proposed (Figure 12). However, further studies, both experimental and computational, are needed to fully understand the dynamics of the opening of the Hsp70 conformation. In particular, the all-atom molecular dynamics study by Woo et al.44 of NBD in the ATP- and ADP-bound state has to be extended to the nucleotide-unbound state, and more trajectories need to be simulated to derive the statistics of motion. Moreover, the dihedral angle τ, which is a direct measure of the distortion of NBD-I and NBD-II from the mean plane of the whole NBD domain (and consequently of the extent of the scissor-like motion), as well as δ, which does not discriminate between the motion in the mean plane of the NBD domain and the scissor-like out-of plane motion of domain NBD-I with respect to NBD-II, should be monitored (Figure 9). These studies are now underway in our laboratory. Also, experiments similar to those carried out by Mapa et al.11 are required to determine the mode of the binding of SBD-α to the NBD (type I or type II). Additionally, even though the binding-only motion (Figure 5C) is not productive because it does not lead to SBD opening and substrate release, it would probably be worth designing an experiment similar to that reported in ref 11 to determine whether SBD binding to the NBD can occur without NBD opening. Even though the experiment reported in ref 11 strongly suggests that binding of SBD-β to the NBD is accompanied by SBD opening, it should be noted that it determines SBD-β ···NBD-I and SBD-α ···SBD-β distance distributions separately and not the distribution of these two distances together.
Fig. 12.

A plausible mechanism for Hsp70 chaperone opening (transition from structure 1 (SBD-closed), in which SBD-α and SBD-β are in contact, to structure 2 (SBD-open), in which SBD-α and SBD-β are far apart from each other and bind to opposite faces of the NBD) suggested by coarse-grained simulations of DnaK (PDB ID: 2KHO). NBD-I is shown as a blue transparent ellipse, NBD-II is represented as a green ellipse, SBD-β is shown as a yellow incomplete ellipse, and SBD-α is shown as a red broken L-shape in structure 1 and as a red L-shape in structure 2. The linker segment is represented as a thick black line and the substrate (S) is represented as a thin black line. The vertical sticks stretching out of the linker segment and out of the left upper corner of NBD-II represent backbone amide (with blue circles representing hydrogen atoms) and backbone carbonyl (with red half-rings representing oxygen atoms) groups, respectively. The “switch” (SW) and “holder” (HO) helices (see Figure 10 for definition) are shown as a yellow and a blue rectangle, respectively, with ragged-line borders. The subdomains, the helices, and the substrate are labeled except for subdomains Ia and IIa in structure 2. In the “closed” structure (1), NBD-I and NBD-II are in a “crossed” orientation and the three-helix-bundle “lid” (i.e., SBD-α) binds to the SBD-β, the substrate (S; thin black line) remaining trapped between the SBD-β and SBD-α. SBD-β is connected to NBD-II by a linker (black line) which is connected to the SW helix (long yellow rectangle with ragged-line border), which is held between the main body of NBD-I and its HO helix. Thus, the SW helix is quite firmly tied to NBD-I. ATP binding results in out-of-plane (scissor-like) rotation of NBD-I and NBD-II towards each other, and, consequently, in the rotation of the SW helix towards the back side of NBD-II. Following this event, the linker is moved close to the outer β-strand of the IIa subdomain so that it can join to form an additional strand of the β-sheet of IIa, which is depicted as locking the blue circles representing backbone amide protons in the half-rings. This fixes the SBD close to NBD, thus enabling interdomain communication. Simultaneously or following the above-mentioned event, helix A+B of SBD-α straightens and this domain dissociates from SBD-β, and binds to NBD-I, which leads to the formation of the “open” structure (2) and substrate release. When ATP is removed by a nucleotide-exchange factor and substrate is delivered by Hsp40 co-chaperone (the J-domain protein), the NBD-I and NBD-II domains return to the “cross” orientation and the “switch” helix rotates, peeling the linker segment off from the β-sheet, and pulling SBD-β away from NBD-II, which initiates the transition to the closed structure.
Acknowledgments
We thank Adrien Nicolaï (Laboratoire Interdisciplinaire Carnot de Bourgogne, Université de Bourgogne, Dijon) and Dr. Jarosław Marszałek (Intercollegiate Faculty of Biotechnology, University of Gdańsk and Medical University of Gdańsk, Poland) for helpful comments on the manuscript.
This work was supported by grants from the Foundation for Polish Science (grant MPD/2010/5), National Institutes of Health (GM-14312), the National Science Foundation (MCB10-19767), and the Polish Ministry of Science and Higher Education (N N204 049035). Computational resources were provided by (a) Argonne Leadership Computing Facility at Argonne National Laboratory, which is supported by the Office of Science of the U.S. Department of Energy under contract DE-AC02-06CH11357, (b) the John von Neumann Institute for Computing at the Central Institute for Applied Mathematics, Forschungszentrum Jülich, Germany, (c) the Pittsburgh Supercomputing Center, (d) the Informatics Center of the Metropolitan Academic Network (IC MAN) in Gdańsk. Our 624-processor Beowulf cluster at Baker Laboratory of Chemistry, Cornell University and our 45-processor Beowulf cluster at the Faculty of Chemistry, University of Gdańsk were used to develop and test the code.
References
- 1.Polier S, Dragovic Z, Hartl FU, Bracher A. Cell. 2008;133:1068–1079. doi: 10.1016/j.cell.2008.05.022. [DOI] [PubMed] [Google Scholar]
- 2.Kampinga HH, Craig EA. Nature Reviews, Molecular Cell Biology. 2010;11:589–591. doi: 10.1038/nrm2941. [DOI] [PMC free article] [PubMed] [Google Scholar]
- 3.Mayer MP, Bukau P. Cell Mol Life Sci. 2005;62:670–684. doi: 10.1007/s00018-004-4464-6. [DOI] [PMC free article] [PubMed] [Google Scholar]
- 4.Bukau B, Weissman J, Horwich A. Cell. 2006;125:443–451. doi: 10.1016/j.cell.2006.04.014. [DOI] [PubMed] [Google Scholar]
- 5.Bhattacharya A, Kurochkin AV, Yip GNB, Zhang Y, Zuiderweg ERP. J Mol Biol. 2009;388:475-490. doi: 10.1016/j.jmb.2009.01.062. [DOI] [PMC free article] [PubMed] [Google Scholar]
- 6.Nicolaï A, Senet P, Delarue P, Ripoll DR. J Chem Theor Comput. 2010;6:2501–2519. doi: 10.1021/ct1002169. [DOI] [PubMed] [Google Scholar]
- 7.Vogel M, Mayer MP, Bukau B. J Biol Chem. 2006;281:38705–38711. doi: 10.1074/jbc.M609020200. [DOI] [PubMed] [Google Scholar]
- 8.Schuermann JP, Jiang J, Cuellar J, Llorca O, Wang L, Gimenez LE, Jin S, Taylor AB, Demeler B, Morano KA, Hart PJ, Valpuesta JM, Lafer EM, Sousa R. Mol Cell. 2008;31:232–243. doi: 10.1016/j.molcel.2008.05.006. [DOI] [PMC free article] [PubMed] [Google Scholar]
- 9.Bertelsen EB, Chang L, Gestwick JE, Zuiderweg ERP. Proc Natl Acad Sci USA. 2009;106:8471–8476. doi: 10.1073/pnas.0903503106. [DOI] [PMC free article] [PubMed] [Google Scholar]
- 10.Swain JF, Dinler G, Sivendran R, Montgomery DL, Stotz M, Gierasch LM. Mol Cell. 2007;26:27–39. doi: 10.1016/j.molcel.2007.02.020. [DOI] [PMC free article] [PubMed] [Google Scholar]
- 11.Mapa K, Sikor M, Kudryatsev V, Waegermann K, Kalinin S, Seidel CAM, Neupert W, Lamb DC, Mokranjac D. Mol Cell. 2010;38:89–100. doi: 10.1016/j.molcel.2010.03.010. [DOI] [PubMed] [Google Scholar]
- 12.Ahmad A, Bhattacharya A, McDonald RA, Cordes M, Ellington B, Bertelsen EB, Zuiderweg ERP. Proc Natl Acad Sci USA. 2011;108:18966–18971. doi: 10.1073/pnas.1111220108. [DOI] [PMC free article] [PubMed] [Google Scholar]
- 13.Liu QL, Hendrickson WA. Cell. 2007;131:106–120. doi: 10.1016/j.cell.2007.08.039. [DOI] [PMC free article] [PubMed] [Google Scholar]
- 14.Wilbanks SM, Chen L, Tsuruta H, Hodgson KO, McKay DB. Biochemistry. 1995;34:12095–12106. doi: 10.1021/bi00038a002. [DOI] [PubMed] [Google Scholar]
- 15.Moro F, Fernández-Saiz V, Muga A. FEBS Lett. 2003;533:119–123. doi: 10.1016/s0014-5793(02)03752-3. [DOI] [PubMed] [Google Scholar]
- 16.Lindahl E, Hess B, van der Spoel D. J Mol Biol. 2001;7:306–317. [Google Scholar]
- 17.Atilgan AR, Durell SR, Jernigan RL, Demirel MC, Keskin O, Bahar I. Biophys J. 2001;80:505–515. doi: 10.1016/S0006-3495(01)76033-X. [DOI] [PMC free article] [PubMed] [Google Scholar]
- 18.Yang L, Song G, Jernigan RL. Biophys J. 2007;93:920–929. doi: 10.1529/biophysj.106.095927. [DOI] [PMC free article] [PubMed] [Google Scholar]
- 19.Liwo A, Czaplewski C, Pillardy J, Scheraga HA. J Chem Phys. 2001;115:2323–2347. [Google Scholar]
- 20.Liwo A, Khalili M, Czaplewski C, Kalinowski S, Ołdziej S, Wachucik K, Scheraga H. J Phys Chem B. 2007;111:260–285. doi: 10.1021/jp065380a. [DOI] [PMC free article] [PubMed] [Google Scholar]
- 21.Liwo A, Czaplewski C, Ołdziej S, Rojas AV, KaŸmierkiewicz R, Makowski M, Murarka RK, Scheraga HA. In: Coarse-Graining of Condensed Phase and Biomolecular Systems. Voth G, editor. Chapter 8. Taylor & Francis; 2008. pp. 107–122. [Google Scholar]
- 22.Kozłowska U, Maisuradze GG, Liwo A, Scheraga HA. J Comput Chem. 2010;31:1154–1167. doi: 10.1002/jcc.21402. [DOI] [PMC free article] [PubMed] [Google Scholar]
- 23.Liwo A, Khalili M, Scheraga HA. Proc Natl Acad Sci USA. 2005;102:2362–2367. doi: 10.1073/pnas.0408885102. [DOI] [PMC free article] [PubMed] [Google Scholar]
- 24.Khalili M, Liwo A, Jagielska A, Scheraga HA. J Phys Chem B. 2005;109:13798–13810. doi: 10.1021/jp058007w. [DOI] [PMC free article] [PubMed] [Google Scholar]
- 25.Shen H, Liwo A, Scheraga HA. J Phys Chem B. 2009;113:8738–8744. doi: 10.1021/jp901788q. [DOI] [PMC free article] [PubMed] [Google Scholar]
- 26.Kolinski A, Skolnick J. J Chem Phys. 1992;97:9412–9426. [Google Scholar]
- 27.Liwo A, KaŸmierkiewicz R, Czaplewski C, Groth M, Ołdziej S, Wawak RJ, Rackovsky S, Pincus MR, Scheraga HA. J Comput Chem. 1998;19:259–276. [Google Scholar]
- 28.Khalili M, Liwo A, Rakowski F, Grochowski P, Scheraga H. J Phys Chem B. 2005;109:13785–13797. doi: 10.1021/jp058008o. [DOI] [PMC free article] [PubMed] [Google Scholar]
- 29.de Gennes P-G. Scaling concepts in polymer physics. Chapter VI Cornell University Press; Ithaca: 1979. [Google Scholar]
- 30.Veitshans T, Klimov D, Thirumalai D. Fold Des. 1996;2:1–22. doi: 10.1016/S1359-0278(97)00002-3. [DOI] [PubMed] [Google Scholar]
- 31.Cieplak M, Hoang TX, Robbins MO. Proteins: Struct, Funct, Genet. 2002;49:104–113. doi: 10.1002/prot.10188. [DOI] [PubMed] [Google Scholar]
- 32.Kleinerman DS, Czaplewski C, Liwo A, Scheraga HA. J Chem Phys. 2008;128:245103. doi: 10.1063/1.2943146. [DOI] [PMC free article] [PubMed] [Google Scholar]
- 33.Berendsen HJC, Postma JPM, van Gunsteren WF, DiNola A, Haak JR. J Chem Phys. 1984;81:3684–3690. [Google Scholar]
- 34.Nosé S. Mol Phys. 1984;52:255–268. [Google Scholar]
- 35.Nosé S. J Phys Soc Jpn. 2001;70:75–77. [Google Scholar]
- 36.Nanias M, Czaplewski C, Scheraga HA. J Chem Theor Comput. 2006;2:513–528. doi: 10.1021/ct050253o. [DOI] [PMC free article] [PubMed] [Google Scholar]
- 37.Czaplewski C, Kalinowski S, Liwo A, Scheraga HA. J Chem Theor Comput. 2009;5:627–640. doi: 10.1021/ct800397z. [DOI] [PMC free article] [PubMed] [Google Scholar]
- 38.Hansmann UHE, Okamoto Y. Physica A. 1994;212:415–437. [Google Scholar]
- 39.Rhee YM, Pande VS. Biophys J. 2003;84:775–786. doi: 10.1016/S0006-3495(03)74897-8. [DOI] [PMC free article] [PubMed] [Google Scholar]
- 40.Kumar S, Bouzida D, Swendsen RH, Kollman PA, Rosenberg JM. J Comput Chem. 1992;13:1011–1021. [Google Scholar]
- 41.Eswar N, Webb B, Marti-Renom MA, Madhusundhan MS, Eramian D, Shen MY, Pieper U, Sali A. Curr Protocols Bioinf. 2006;5.6:5.6.1–5.6.30. doi: 10.1002/0471250953.bi0506s15. [DOI] [PMC free article] [PubMed] [Google Scholar]
- 42.Koradi R, Billeter M, Wüthrich K. J Mol Graphics. 1996;14:51–55. doi: 10.1016/0263-7855(96)00009-4. [DOI] [PubMed] [Google Scholar]
- 43.Gront D, Kmiecik S, Kolinski A. J Comput Chem. 2007;28:1593–1597. doi: 10.1002/jcc.20624. [DOI] [PubMed] [Google Scholar]
- 44.Woo HJ, Jiang J, Lafer EM, Sousa R. Biochemistry. 2009;48:11470–11477. doi: 10.1021/bi901256y. [DOI] [PMC free article] [PubMed] [Google Scholar]