High-spatial-resolution MR microangiography of the eye allows visualization of small angiographic details of the ocular circulation and hemodynamic changes in arteries and veins, which may prove useful for investigating microvascular pathologic findings in eye diseases.
Abstract
Purpose:
To develop high-spatial-resolution magnetic resonance (MR) microangiography techniques to image the rat ocular circulation.
Materials and Methods:
Animal experiments were performed with institutional Animal Care Committee approval. MR microangiography (resolution, 84 × 84 × 84 μm or 42 × 42 × 84 μm) of the rat eye (eight rats) was performed by using a custom-made small circular surface coil with an 11.7-T MR unit before and after monocrystalline iron oxide nanoparticle (MION) injection. MR microangiography measurements were made during air, oxygen, and carbogen inhalation. From three-dimensional MR microangiography, the retina was virtually flattened to enable en face views of various retinal depths, including the retinal and choroidal vascular layers. Signal intensity changes within the retinal or choroidal arteries and veins associated with gas challenges were analyzed. Statistical analysis was performed by using paired t tests, with P < .05 considered to indicate a significant difference. Bonferroni correction was used to adjust for multiple comparisons.
Results:
The central retinal artery, long posterior ciliary arteries, and choroidal vasculature could be distinguished on MR microangiograms of the eye. With MR microangiography, retinal arteries and veins could be distinguished on the basis of blood oxygen level–dependent contrast. Carbogen inhalation–enhanced MR microangiography signal intensity in both the retina (P = .001) and choroid (P = .027) compared with oxygen inhalation. Carbogen inhalation showed significantly higher signal intensity changes in the retinal arteries (P = .001, compared with oxygen inhalation), but not in the veins (P = .549). With MION administration, MR microangiography depicted retinal arterial vasoconstriction when the animals were breathing oxygen (P = .02, compared with animals breathing air).
Conclusion:
MR microangiography of the eye allows depth-resolved imaging of small angiographic details of the ocular circulation. This approach may prove useful in studying microvascular pathologic findings and neurovascular dysfunction in the eye and retina.
© RSNA, 2012
Supplemental material: http://radiology.rsna.org/lookup/suppl/doi:10.1148/radiol.12112033/-/DC1
Introduction
The ocular circulation plays a crucial role in maintaining proper function of the eye and the retina. Starting from the ophthalmic artery, the posterior ciliary artery divides into (a) the temporal and nasal long posterior ciliary arteries (LPCAs) supporting the choroid, ciliary body, and iris; and (b) the central retinal artery, which branches radially on the retinal surface supporting the inner retina (1). The retina is nourished by the retinal and choroidal circulations (2). The retinal vessels penetrate the inner portion of the retina, whereas the choroidal vessels are located outside the retina, behind the retinal pigment epithelium. The outer retina, located between these two vascular layers, is avascular (approximately 100 μm thick).
Common angiographic imaging techniques of the retina in vivo are optically based and include fluorescein angiography (3), and techniques to image the retinal and choroidal vessels include indocyanine green angiography (4) . Flow velocity of retinal surface vessels has been imaged by using scanning laser ophthalmoscopy (5) and laser speckle imaging (6,7). Optically based imaging techniques are generally depth ambiguous, resulting in difficulty in resolving signal intensities at different depths. They also require an unobstructed light pathway and are constrained by illumination angle. Diseases with media opacity, such as cataract and vitreous hemorrhage, could obstruct imaging of the retina with optics.
In contrast to optical imaging, magnetic resonance (MR) imaging offers depth-resolved information and large fields of view. MR angiography is widely used to study brain and peripheral circulations. Contrast material–enhanced MR angiography with intravascular contrast material has been used to enhance vessel contrast. With recent advances in MR imaging sensitivity, in vivo imaging of smaller vessels is becoming feasible (8,9). MR angiography of the eye remains to be validated as a result of signal-to-noise limitations in small vessels. High-spatial-resolution MR angiography has the potential for early detection of anatomic and functional abnormalities in vascular eye diseases, such as diabetic retinopathy, retinoblastoma, retinal ischemia, and choroidal melanoma. In this study, we aimed to develop high-spatial-resolution MR microangiography techniques to image the rat ocular circulation.
Materials and Methods
Animal Preparation
All animal experiments were performed with the University of Texas Health Science Center at San Antonio Institutional Animal Care and Use Committee approval and in accordance with the Association for Research in Vision and Ophthalmology Statement for the Use of Animals in Ophthalmic and Vision Research. Eight 10-week-old male Sprague-Dawley rats (Charles River Laboratories, Wilmington, Mass) were imaged with 1.2%–1.5% isoflurane (Halocarbon Products, River Edge, NJ) anesthesia and mechanically ventilated at 57–60 breaths per minute. The femoral vein was catheterized for pancuronium bromide (Hospira, Lake Forest, Ill) infusion at 4 mg/kg per hour with an infusion pump (Pico Plus; Harvard Apparatus, Holliston, Mass) and monocrystalline iron oxide nanoparticle (MION) administration (30 mg of iron per kilogram).
The animal was placed on a head holder with ear and tooth bars. To stabilize the eye, the conjunctiva was sutured to the radiofrequency coil at each quadrant. Atropine eye drops were applied topically to dilate the pupil and reduce iris motion (10). Body temperature was maintained at 37.0°C ± 0.5. End-tidal CO2 (V9004 capnograph; Surgivet, Waukesha, Wis), heart rate, and blood oxygen saturation (MouseOx; Starr Life Science, Oakmont, Pa) were monitored and kept within physiologic ranges. All animals were prepared by one author (Y.Y.I.S., with 8 years of experience).
MR imaging was performed during air, oxygen, and carbogen (5% CO2, 95% O2) ventilation. The order of gas challenges was randomized. Four repetitions were performed for each gas challenge. Gas-challenge experiments were performed before and after MION administration.
MR Image Acquisition
MR imaging studies were performed with an 11.7-T 16-cm magnet and a gradient insert (74G/cm B-GA9S; Bruker, Billerica, Mass). A custom-made small circular surface coil (inside diameter, approximately 7 mm) was placed on the left eye. Three-dimensional (3D) gradient-echo MR imaging with flow compensation was performed by using a spectral width of 60 kHz and the following parameters: repetition time msec/echo time msec, 26/4.3; field of view, 9 × 9 × 9 or 9 × 9 × 4.5 mm; zero-filling of 2.4 times in each direction; acquisition matrix, 256 × 256 × 256 (acquisition time, 5 minutes) or 512 × 512 × 256 (repetition time, 40 msec; acquisition time, 15 minutes), yielding a resolution of 84 × 84 × 84 μm or 42 × 42 × 84 μm and a nominal resolution of 35 × 35 × 35 μm or 18 × 18 × 18 μm. MION MR microangiography parameters were identical. Four repetitions were performed for each gas challenge. MR imaging data were acquired by two authors (Y.Y.I.S. and E.R.M., with 8 and 6 years of experience, respectively).
Data Analysis
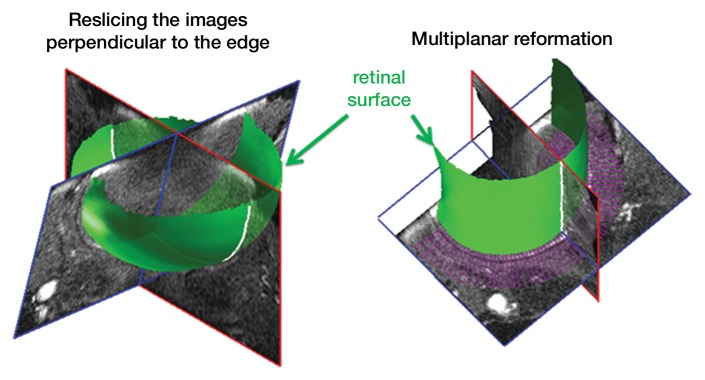
Image analysis was performed by using custom-written programs (Matlab; MathWorks, Natick, Mass) (2,11,12). Blood volume (BV) index was calculated as the change in transverse relaxivity (ΔR2*) between images obtained before and after MION administration (13). The retina was extracted from the 3D data and flattened to allow layer-specific analysis of retinal and choroidal vascular layers (performed by E.R.M., with 6 years of experience), similar to analysis of two-dimensional retinal images (2). The flattening procedure included two steps: (a) In the first step, the outline of the retina was determined from a section at the center of the eye (Movie 1 [online]). The 3D data were resectioned perpendicular to the retinal edge, producing a 3D volume of sections perpendicular to the retina (Fig 1a, 1b). (b) In the second step, from the resectioned data, retinal outlines from five to 10 sections were found and then interpolated across the entire resectioned volume to produce the 3D retinal surface (Fig 1c, Movie 2 [online]). Retinal outlines from only a small number of sections were needed because the shape, position, and size of the retina were fairly consistent across all of the sections of the resectioned volume. Finally from each section of the resectioned data, profiles perpendicular to the retinal surface were obtained with two times the spatial interpolation, giving the 3D flattened retina (Fig 1d).
Figure 1a:
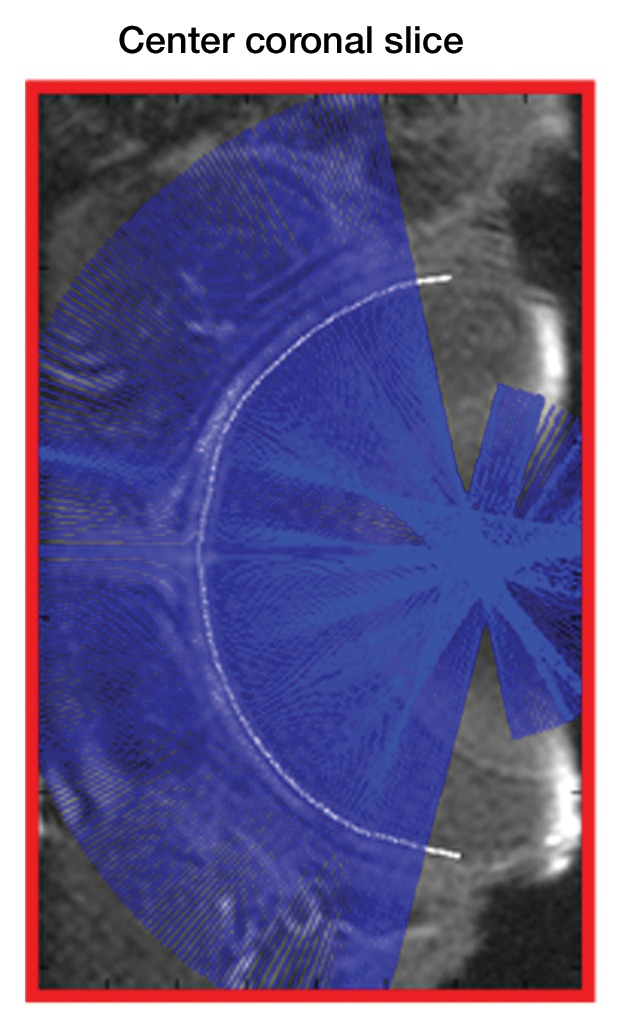
Procedure for flattening the retina. MR images (26/4.3) show steps as follows: (a) Coronal oblique image. From a central section (outlined in red), the retinal edge (white curve) is found. The 3D images are resectioned at the locations indicated by the blue lines. (b) Three-dimensional oblique view of the resectioning. The 3D retinal surface is shown in green. A single section of the resectioned data is shown (outlined in blue). (c) Oblique image is from same section as a. The resectioned data (green curve) indicate the retinal surface. From each section, profiles perpendicular to the retinal surface are found (purple lines). (d) Spatially warped image is from same section as a. The profiles produce a linearized representation of the retina (outlined in purple) from each section, resulting in a 3D flattened image of the retina.
Figure 1b:
Procedure for flattening the retina. MR images (26/4.3) show steps as follows: (a) Coronal oblique image. From a central section (outlined in red), the retinal edge (white curve) is found. The 3D images are resectioned at the locations indicated by the blue lines. (b) Three-dimensional oblique view of the resectioning. The 3D retinal surface is shown in green. A single section of the resectioned data is shown (outlined in blue). (c) Oblique image is from same section as a. The resectioned data (green curve) indicate the retinal surface. From each section, profiles perpendicular to the retinal surface are found (purple lines). (d) Spatially warped image is from same section as a. The profiles produce a linearized representation of the retina (outlined in purple) from each section, resulting in a 3D flattened image of the retina.
Figure 1c:
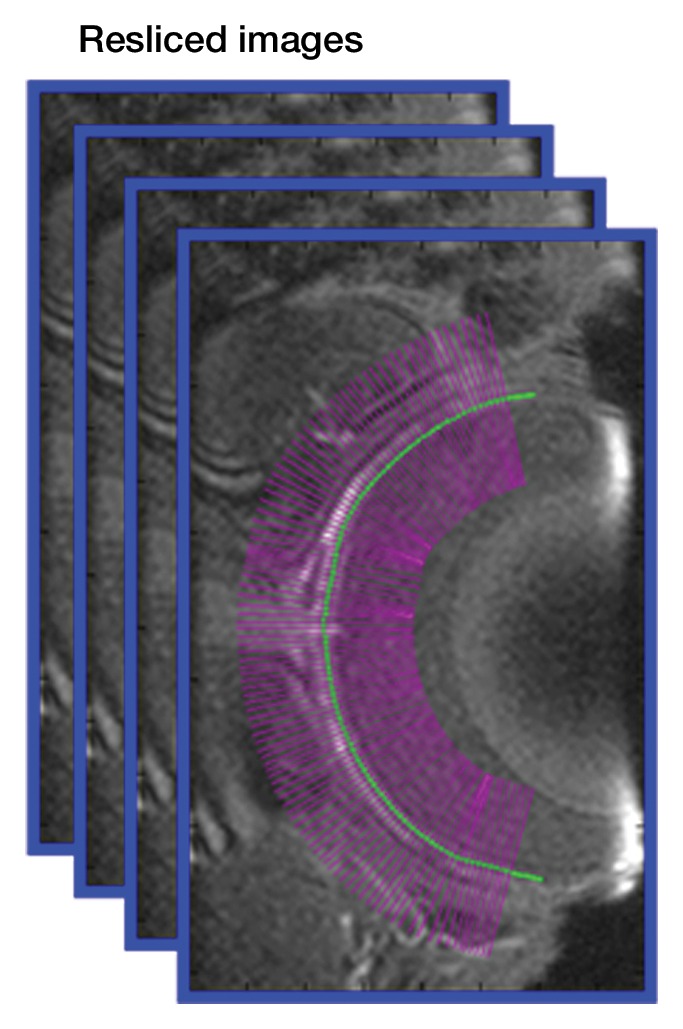
Procedure for flattening the retina. MR images (26/4.3) show steps as follows: (a) Coronal oblique image. From a central section (outlined in red), the retinal edge (white curve) is found. The 3D images are resectioned at the locations indicated by the blue lines. (b) Three-dimensional oblique view of the resectioning. The 3D retinal surface is shown in green. A single section of the resectioned data is shown (outlined in blue). (c) Oblique image is from same section as a. The resectioned data (green curve) indicate the retinal surface. From each section, profiles perpendicular to the retinal surface are found (purple lines). (d) Spatially warped image is from same section as a. The profiles produce a linearized representation of the retina (outlined in purple) from each section, resulting in a 3D flattened image of the retina.
Figure 1d:
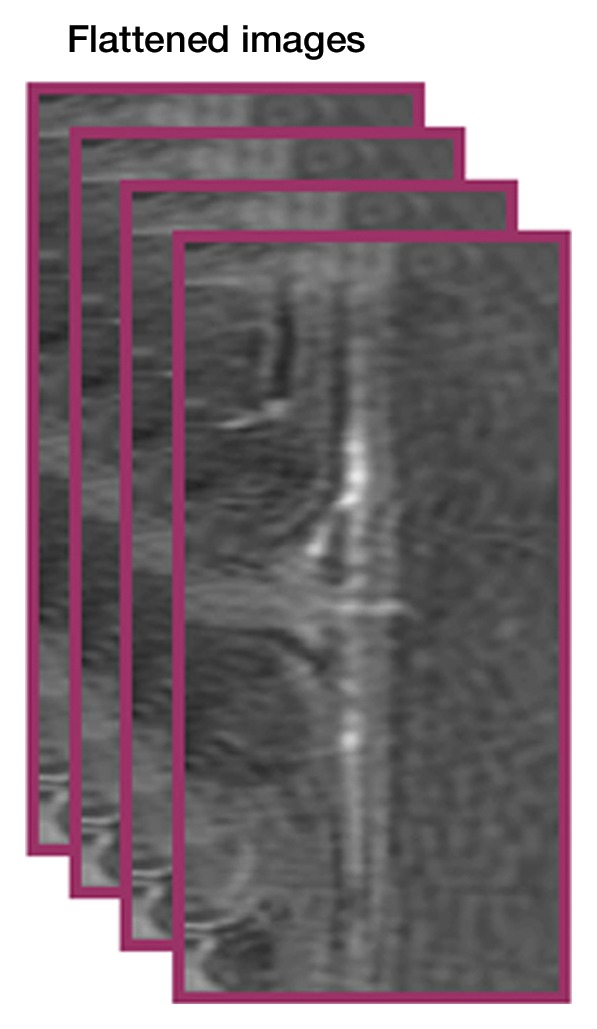
Procedure for flattening the retina. MR images (26/4.3) show steps as follows: (a) Coronal oblique image. From a central section (outlined in red), the retinal edge (white curve) is found. The 3D images are resectioned at the locations indicated by the blue lines. (b) Three-dimensional oblique view of the resectioning. The 3D retinal surface is shown in green. A single section of the resectioned data is shown (outlined in blue). (c) Oblique image is from same section as a. The resectioned data (green curve) indicate the retinal surface. From each section, profiles perpendicular to the retinal surface are found (purple lines). (d) Spatially warped image is from same section as a. The profiles produce a linearized representation of the retina (outlined in purple) from each section, resulting in a 3D flattened image of the retina.
Intensity profiles across the vessel width were obtained from the flattened images by projecting lines perpendicular to the vessel and averaging over an approximately 1-mm length of the vessel (performed by Y.Y.I.S. and G.L., with 8 and 4 years of experience, respectively) (2,12). Peak value and diameter, defined as half-height width, were determined and averaged from three to six arteries and three to six veins for each animal. All data in text were expressed as the mean ± standard deviation. Paired t tests were used to compare the oxygen and carbogen effect on percentage MR signal intensity changes, with P < .05 considered to indicate a significant difference. Data were expressed as signal intensity changes relative to air because raw MR signal intensities were not comparable. Bonferroni correction was used to adjust the data when vessel diameters during air, oxygen, and carbogen inhalation were compared, with P < .025 considered to indicate a significant difference.
Results
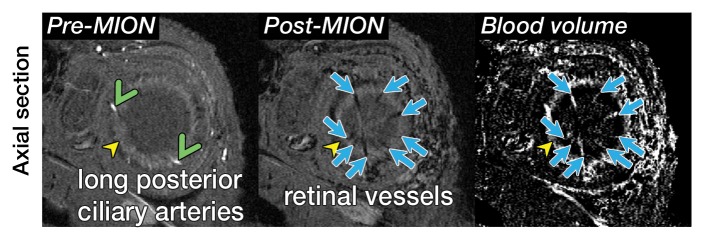
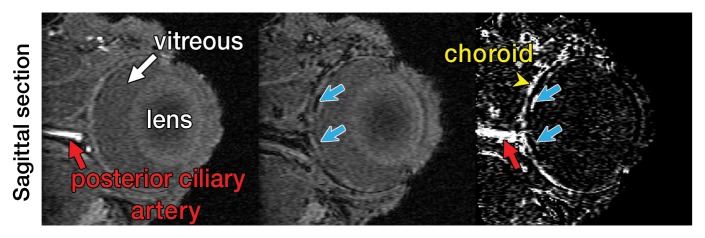
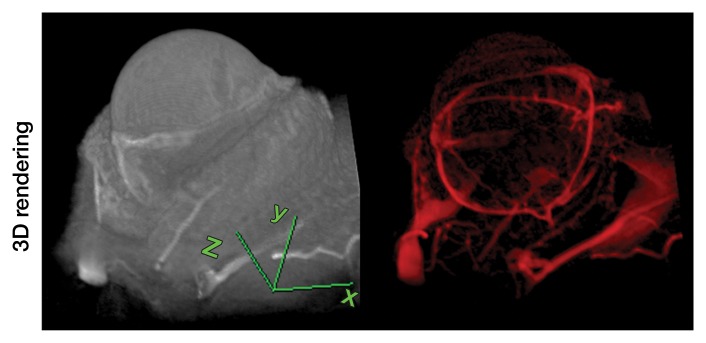
Representative 3D MR angiographic nonenhanced and MION-enhanced images and BV index of a rat eye (84 × 84 × 84-μm resolution) showed that the posterior ciliary artery and vein, LPCAs, and retinal vessels were visible (Fig 2a, 2b). The choroid had a high BV. Three-dimensional volume rendering of images obtained before and after MION administration at threshold levels show the ocular vascular structure (Fig 2c, 2d).
Figure 2a:
Three-dimensional MR microangiography and volume rendering reveal vascular morphologic features of a rat eye. (a) Oblique axial MR images (26/4.3) perpendicular to the optic nerve head show the retinal vessels (blue arrows) branching from the central retinal artery, with LPCAs (green arrowheads). (b) Oblique sagittal MR views (26/4.3) parallel to the optic nerve head of the eye depict the central retinal artery, choroid (yellow arrowheads), and the retinal vessels (blue arrows). (c) Volume-rendered 3D images show eyeball at left and vascular structure at right without MION injection. x = Readout direction, y = first phase-encoding direction, z = second phase-encoding direction. (d) Volume-rendered 3D image of the ocular BV. Post-MION = after MION injection, Pre-MION = before MION injection, green arrowheads = LPCAs, red arrows = posterior ciliary artery.
Figure 2b:
Three-dimensional MR microangiography and volume rendering reveal vascular morphologic features of a rat eye. (a) Oblique axial MR images (26/4.3) perpendicular to the optic nerve head show the retinal vessels (blue arrows) branching from the central retinal artery, with LPCAs (green arrowheads). (b) Oblique sagittal MR views (26/4.3) parallel to the optic nerve head of the eye depict the central retinal artery, choroid (yellow arrowheads), and the retinal vessels (blue arrows). (c) Volume-rendered 3D images show eyeball at left and vascular structure at right without MION injection. x = Readout direction, y = first phase-encoding direction, z = second phase-encoding direction. (d) Volume-rendered 3D image of the ocular BV. Post-MION = after MION injection, Pre-MION = before MION injection, green arrowheads = LPCAs, red arrows = posterior ciliary artery.
Figure 2c:
Three-dimensional MR microangiography and volume rendering reveal vascular morphologic features of a rat eye. (a) Oblique axial MR images (26/4.3) perpendicular to the optic nerve head show the retinal vessels (blue arrows) branching from the central retinal artery, with LPCAs (green arrowheads). (b) Oblique sagittal MR views (26/4.3) parallel to the optic nerve head of the eye depict the central retinal artery, choroid (yellow arrowheads), and the retinal vessels (blue arrows). (c) Volume-rendered 3D images show eyeball at left and vascular structure at right without MION injection. x = Readout direction, y = first phase-encoding direction, z = second phase-encoding direction. (d) Volume-rendered 3D image of the ocular BV. Post-MION = after MION injection, Pre-MION = before MION injection, green arrowheads = LPCAs, red arrows = posterior ciliary artery.
Figure 2d:
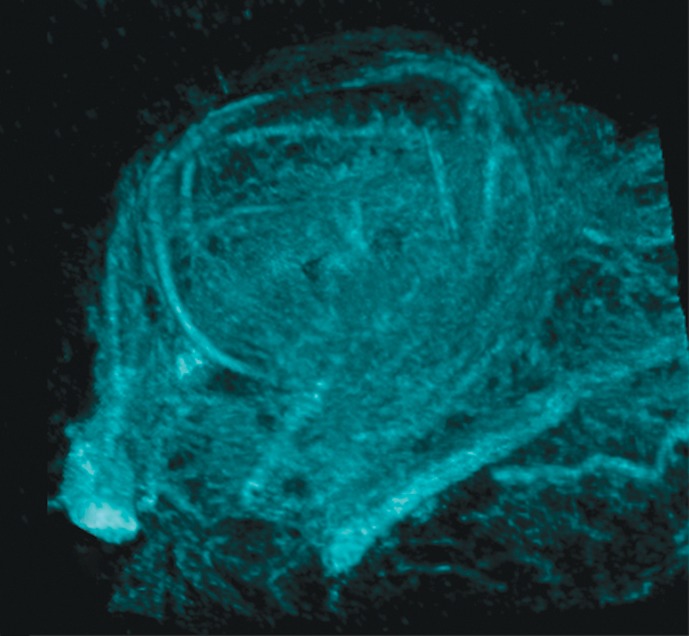
Three-dimensional MR microangiography and volume rendering reveal vascular morphologic features of a rat eye. (a) Oblique axial MR images (26/4.3) perpendicular to the optic nerve head show the retinal vessels (blue arrows) branching from the central retinal artery, with LPCAs (green arrowheads). (b) Oblique sagittal MR views (26/4.3) parallel to the optic nerve head of the eye depict the central retinal artery, choroid (yellow arrowheads), and the retinal vessels (blue arrows). (c) Volume-rendered 3D images show eyeball at left and vascular structure at right without MION injection. x = Readout direction, y = first phase-encoding direction, z = second phase-encoding direction. (d) Volume-rendered 3D image of the ocular BV. Post-MION = after MION injection, Pre-MION = before MION injection, green arrowheads = LPCAs, red arrows = posterior ciliary artery.
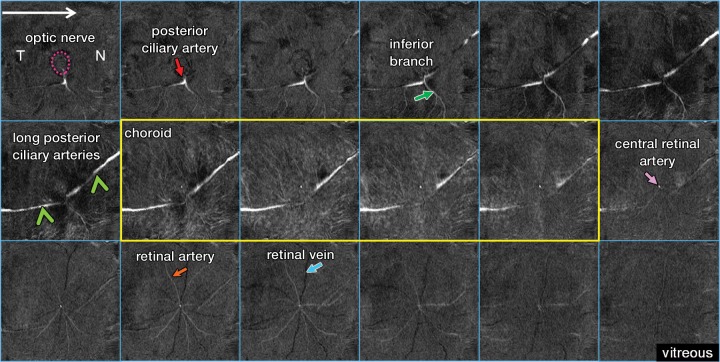
Figure 3 shows the virtually flattened ocular anatomy of the posterior eye at higher resolution (42 × 42 × 84 μm). Starting from the optic nerve head, the posterior ciliary artery divided into the temporal and nasal LPCAs, the inferior branch of the temporal LPCA, and the central retinal artery. A dense layout of smaller vessels was observed in the choroid, with high background tissue signal intensity, indicating the high vessel density of the choroid. The avascular outer retina (middle row, last image on the right) had few distinguishable vessels, albeit with some signal intensity contamination from choroidal and retinal vessels.
Figure 3:
Flattened anatomy of the posterior eye. From left to right and top to bottom, MR images (40/4.3) show sections from posterior at the top left (optic nerve) to anterior at the bottom right (vitreous). The inferior branch (green arrow) refers to the inferior branch of the posterior ciliary artery. N = nasal side, T = temporal side, purple dotted circle = optic nerve, yellow outline = choroidal vascular layer.
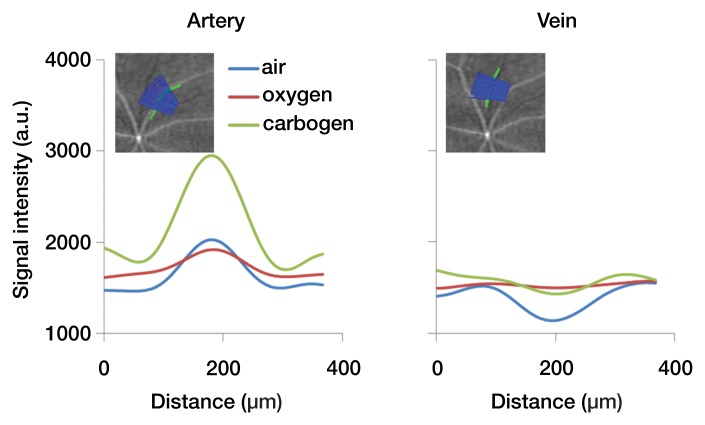
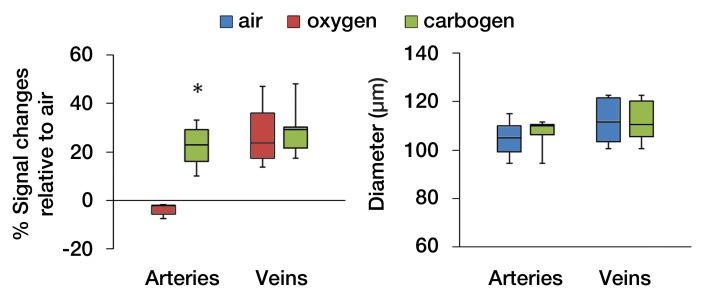
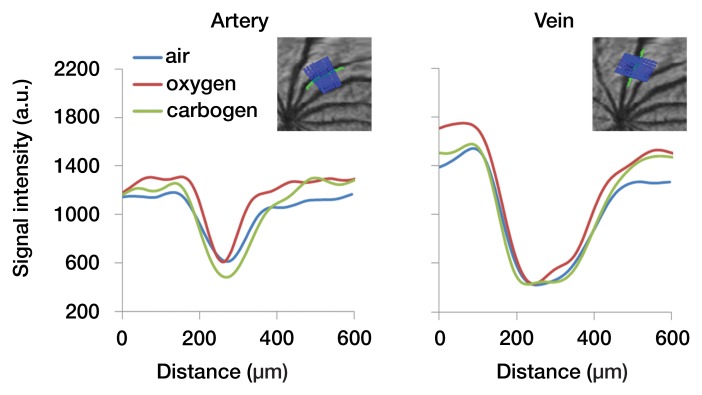
In the flattened images of retinal vessels during air ventilation, the arteries were hyperintense and the veins were hypointense as a result of blood oxygen level–dependent (BOLD) T2* contrast (Fig 4a, 4b; Movie 3 [online]). During oxygen ventilation, arterial and venous contrasts decreased. During carbogen inhalation, arterial contrast increased and venous contrast decreased. The group-averaged retinal arterial signal intensities decreased slightly during oxygen compared with air, but retinal venous signal intensities showed strong increases (Fig 4c). Carbogen strongly increased both arterial and venous signal intensities relative to air. Carbogen ventilation gave significantly different arterial signal intensity changes (P = .001), but not venous signal intensity changes (P = .549), compared with oxygen ventilation. The group-averaged retinal vessel diameters showed no significant change in the arterial (P = .413) and venous (P > .99) diameter between air and carbogen ventilation. The effect of oxygen ventilation on diameter was not analyzed because of weak vessel contrast.
Figure 4a:
Time-of-flight MR angiographic images (26/4.3) of retinal vascular layer during gas challenges. (a) Images show flattened vascular structures during air, oxygen, and carbogen inhalation. (b) Graphs show corresponding vessel profiles from single animal. Insets: Flattened MR images of retinal vascular layer show analyzed segment. (c) Graphs show vessel diameter and peak signal intensity changes in retinal vessels associated with gas challenges (n = 7). * = P < .05, significantly different from oxygen inhalation.
Figure 4b:
Time-of-flight MR angiographic images (26/4.3) of retinal vascular layer during gas challenges. (a) Images show flattened vascular structures during air, oxygen, and carbogen inhalation. (b) Graphs show corresponding vessel profiles from single animal. Insets: Flattened MR images of retinal vascular layer show analyzed segment. (c) Graphs show vessel diameter and peak signal intensity changes in retinal vessels associated with gas challenges (n = 7). * = P < .05, significantly different from oxygen inhalation.
Figure 4c:
Time-of-flight MR angiographic images (26/4.3) of retinal vascular layer during gas challenges. (a) Images show flattened vascular structures during air, oxygen, and carbogen inhalation. (b) Graphs show corresponding vessel profiles from single animal. Insets: Flattened MR images of retinal vascular layer show analyzed segment. (c) Graphs show vessel diameter and peak signal intensity changes in retinal vessels associated with gas challenges (n = 7). * = P < .05, significantly different from oxygen inhalation.
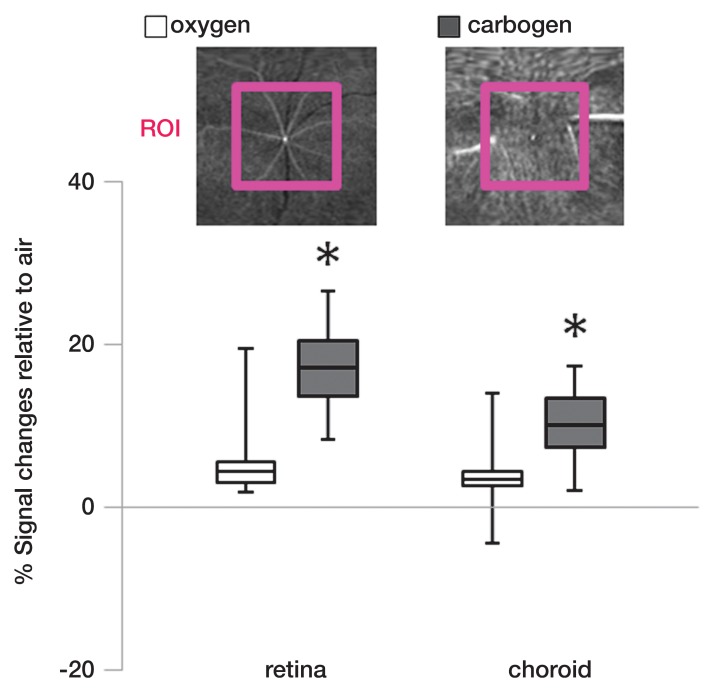
Percentage signal intensity changes from a large region of interest in the inner retina and choroid during oxygen and carbogen ventilation relative to air were analyzed (Fig 5). Carbogen ventilation showed significantly higher signal intensity changes in both the retina (P = .001) and choroid (P = .027), compared with oxygen ventilation (n = 7).
Figure 5:
Region-of-interest (ROI) analysis of the signal intensity changes in the retinal and choroidal vascular layers during gas challenges (n = 7). Insets: Flattened MR images (26/4.3) of the retinal and choroidal vascular layer show region of interest. * = P < .05, significantly different from oxygen inhalation.
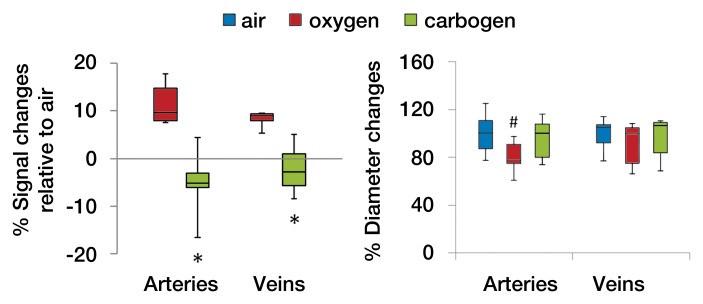
Figures 6a and 6b show the flattened images of retinal vessels and the vascular projection profiles with air, oxygen, and carbogen ventilation after MION injection. Both arteries and veins appeared hypointense relative to the background (Movie 3 [online]). Oxygen inhalation showed less vessel contrast, indicating vasoconstriction; carbogen inhalation showed enhanced vessel contrast. Background tissue signal intensities were increased during oxygen and carbogen inhalation as a result of the BOLD effect at high field strength. The group-averaged retinal arterial and venous signal intensities increased during oxygen inhalation, compared with air inhalation, indicating decreased BV, and decreased slightly during carbogen inhalation, compared with air inhalation (Fig 6c). Carbogen inhalation gave significantly different arterial (P = .009) and venous (P = .005) signal intensity changes, compared with oxygen inhalation. The group-averaged retinal vessel diameters showed decreases in arterial size (P = .02) but not venous size (P = .041, with Bonferroni correction) during oxygen inhalation compared with air inhalation. With carbogen inhalation, the vessels had similar size, compared with air inhalation (P = .451 for arteries and P = .241 for veins).
Figure 6a:
MR angiographic images (26/4.3) of the retinal vascular layer during gas challenges with 30 mg of iron per kilogram MION injection. (a) Images show flattened vascular structures during air, oxygen, and carbogen inhalation. Data were from the same subject as shown in Figure 4. (b) Graphs show linearized vessel profiles during air, oxygen, and carbogen inhalation. Insets: Flattened MR images of the retinal vascular layer show the analyzed segment. (c) Graphs show vessel diameter and signal intensity changes in the retinal vessels associated with gas challenges (n = 6). * = P < .05, significantly different from oxygen inhalation. # = P < .025, significantly different from air inhalation.
Figure 6b:
MR angiographic images (26/4.3) of the retinal vascular layer during gas challenges with 30 mg of iron per kilogram MION injection. (a) Images show flattened vascular structures during air, oxygen, and carbogen inhalation. Data were from the same subject as shown in Figure 4. (b) Graphs show linearized vessel profiles during air, oxygen, and carbogen inhalation. Insets: Flattened MR images of the retinal vascular layer show the analyzed segment. (c) Graphs show vessel diameter and signal intensity changes in the retinal vessels associated with gas challenges (n = 6). * = P < .05, significantly different from oxygen inhalation. # = P < .025, significantly different from air inhalation.
Figure 6c:
MR angiographic images (26/4.3) of the retinal vascular layer during gas challenges with 30 mg of iron per kilogram MION injection. (a) Images show flattened vascular structures during air, oxygen, and carbogen inhalation. Data were from the same subject as shown in Figure 4. (b) Graphs show linearized vessel profiles during air, oxygen, and carbogen inhalation. Insets: Flattened MR images of the retinal vascular layer show the analyzed segment. (c) Graphs show vessel diameter and signal intensity changes in the retinal vessels associated with gas challenges (n = 6). * = P < .05, significantly different from oxygen inhalation. # = P < .025, significantly different from air inhalation.
Discussion
In the current study, we demonstrated the feasibility of using MR angiography to image the ocular vasculature in rats with and without contrast agents. The major findings of the current article are that the central retinal artery and LPCAs can be detected and that the radially projecting retinal arteries and veins can be distinguished with MR microangiography. In addition, distinct responses in the retinal arteries and veins associated with oxygen or carbogen inhalation relative to air inhalation could be detected by using MR microangiography. The methods demonstrated here offer a noninvasive way to image the angiographic details of the ocular circulation.
Hyperoxia has previously been shown to decrease retinal vessel diameter by 10%–14% (14,15) and retinal blood flow by 20%–60%, measured by using optical techniques (6,7,16). Our data indicate that retinal arteries were hyperintense and veins were hypointense (because of BOLD contrast) relative to the background during air inhalation. During oxygen inhalation, arteries became slightly less hyperintense, indicating that vasoconstriction dominated over BOLD contrast. Hyperoxia would be expected to have little BOLD effect on arteries, which are close to fully oxygenated with air inhalation. By contrast, retinal veins became brighter during hyperoxia relative to air because venous oxygenation increased. Consistent findings were observed by using MION MR microangiography. Oxygen ventilation increased retinal arterial and venous signal intensities (from reduced BV and/or increased BOLD effect) and decreased retinal arterial diameter by 20% compared with air because of hyperoxia-induced vasoconstriction. These current findings are consistent with optical imaging studies.
During carbogen inhalation, retinal arteries were markedly brighter relative to air and oxygen inhalation, suggesting that the CO2-induced vasodilation and/or blood velocity increase counteracted the oxygen-induced vasoconstriction. Changes in retinal arterial and venous diameters between air and carbogen inhalation were not detected. Our findings are consistent with results in previous carbogen inhalation studies of retinal arteries and capillaries, wherein increased blood velocity with only small effects on retinal vessel diameter were reported (17,18).
Although MR microangiography provides simultaneous evaluation of retinal arterial and venous vasomotor functions and oxygenation, its application to single choroidal vessels at the current resolution is still limited because of the dense, randomly oriented choroidal vessels. It was also difficult to achieve resolution of arteries and veins on the basis of BOLD contrast because of the low arteriovenous difference (3%–5%) in O2 saturation (19,20). We also did not have a standard of reference for ocular veins versus arteries. In the present study, the choroidal signal intensities were only assessed by using region of interest analysis, and the data suggested that the 5% CO2 in carbogen inhalation had a significant effect on the choroid. This observation is consistent with data in previous studies in which researchers reported that carbogen inhalation increased choroidal blood flow by 8% in humans (21), and graded CO2 added to oxygen showed graded increases in choroidal blood velocity and blood flow relative to pure oxygen (1). In addition, translation of high-spatial-resolution ocular MR microangiography to humans will need to overcome low signal-to-noise ratios and eye motion artifacts.
In conclusion, MR microangiography depicted detailed vascular structure in the rat eye and reliably demonstrated corresponding hemodynamic responses to different gas challenges. High-spatial-resolution MR microangiography of the eye allows visualization of small angiographic details of the ocular circulation and hemodynamic changes in arteries and veins, which may prove useful for investigating microvascular pathologic findings in eye diseases.
For correspondence about ocular MR imaging, address the last author (T.Q.D.) (e-mail: duongt@uthscsa.edu), and for correspondence about MR imaging acquisition and data processing, address the second author (E.R.M.) (e-mail: muire@uthscsa.edu).
Advances in Knowledge.
• In the rat, the central retinal artery, long posterior ciliary arteries, and radially projecting retinal arteries and veins can be imaged by using high-spatial-resolution MR microangiography.
• The avascular layer between the retinal and choroidal vascular layers is readily resolved.
• Functional MR microangiography depicts distinct responses in the retinal arteries and veins associated with inhalation of oxygen or carbogen.
Disclosures of Potential Conflicts of Interest: Y.Y.I.S. No potential conflicts of interest to disclose. E.R.M. Financial activities related to the present article: salary during some of the work has been partially paid by a stipend from the National Institutes of Health training grant 5T32HL007446-29. Financial activities not related to the present article: none to disclose. Other relationships: none to disclose. G.L. No potential conflicts of interest to disclose. B.H.D.L.G. No potential conflicts of interest to disclose. T.Q.D. No potential conflicts of interest to disclose.
Supplementary Material
Acknowledgments
We sincerely thank Jeffery W. Kiel, PhD, Department of Ophthalmology, University of Texas Health Science Center at San Antonio (San Antonio, Tex), for his insightful comments.
Received September 30, 2011; revision requested November 9; final revision received December 5; accepted December 29; final version accepted January 13, 2012.
Supported in part by the American Heart Association (10POST4290091) and the Clinical Translational Science Award (parent grant UL1RR025767). Y.Y.I.S. supported in part by the San Antonio Area Foundation. E.R.M. supported in part by National Institutes of Health training grant T32HL007446-29. T.Q.D. supported in part by the MERIT Award from the Department of Veterans Affairs and San Antonio Life Science Institute.
Funding: This research was supported by the National Eye Institute (grants R01 EY014211, EY018855), the National Institute of Neurological Disorders and Stroke (grant R01-NS45879), and the National Institutes of Health (grant T32HL007446-29).
Abbreviations:
- BOLD
- blood oxygen level dependent
- BV
- blood volume
- LPCA
- long posterior ciliary artery
- MION
- monocrystalline iron oxide nanoparticles
- 3D
- three-dimensional
References
- 1.Geiser MH, Riva CE, Dorner GT, Diermann U, Luksch A, Schmetterer L. Response of choroidal blood flow in the foveal region to hyperoxia and hyperoxia-hypercapnia. Curr Eye Res 2000;21(2):669–676 [PubMed] [Google Scholar]
- 2.Cheng H, Nair G, Walker TA, et al. Structural and functional MRI reveals multiple retinal layers. Proc Natl Acad Sci U S A 2006;103(46):17525–17530 [DOI] [PMC free article] [PubMed] [Google Scholar]
- 3.Preussner PR, Richard G, Darrelmann O, Weber J, Kreissig I. Quantitative measurement of retinal blood flow in human beings by application of digital image-processing methods to television fluorescein angiograms. Graefes Arch Clin Exp Ophthalmol 1983;221(3):110–112 [DOI] [PubMed] [Google Scholar]
- 4.Guyer DR, Yannuzzi LA, Slakter JS, Sorenson JA, Orlock S. The status of indocyanine-green videoangiography. Curr Opin Ophthalmol 1993;4(3):3–6 [DOI] [PubMed] [Google Scholar]
- 5.Lorentz K, Zayas-Santiago A, Tummala S, Kang Derwent JJ. Scanning laser ophthalmoscope-particle tracking method to assess blood velocity during hypoxia and hyperoxia. Adv Exp Med Biol 2008;614:253–261 [DOI] [PubMed] [Google Scholar]
- 6.Cheng H, Duong TQ. Simplified laser-speckle-imaging analysis method and its application to retinal blood flow imaging. Opt Lett 2007;32(15):2188–2190 [DOI] [PMC free article] [PubMed] [Google Scholar]
- 7.Cheng H, Yan Y, Duong TQ. Temporal statistical analysis of laser speckle images and its application to retinal blood-flow imaging. Opt Express 2008;16(14):10214–10219 [DOI] [PMC free article] [PubMed] [Google Scholar]
- 8.Bolan PJ, Yacoub E, Garwood M, Ugurbil K, Harel N. In vivo micro-MRI of intracortical neurovasculature. Neuroimage 2006;32(1):62–69 [DOI] [PubMed] [Google Scholar]
- 9.Lin CY, Lin MH, Cheung WM, Lin TN, Chen JH, Chang C. In vivo cerebromicrovasculatural visualization using 3D DeltaR2-based microscopy of magnetic resonance angiography (3DDeltaR2-mMRA). Neuroimage 2009;45(3):824–831 [DOI] [PubMed] [Google Scholar]
- 10.De La Garza BH, Muir ER, Li G, Shih YY, Duong TQ. Blood oxygenation level-dependent (BOLD) functional MRI of visual stimulation in the rat retina at 11.7 T. NMR Biomed 2011;24(2):188–193 [DOI] [PMC free article] [PubMed] [Google Scholar]
- 11.Duong TQ, Pardue MT, Thulé PM, et al. Layer-specific anatomical, physiological and functional MRI of the retina. NMR Biomed 2008;21(9):978–996 [DOI] [PMC free article] [PubMed] [Google Scholar]
- 12.Muir ER, Duong TQ. Layer-specific functional and anatomical MRI of the retina with passband balanced SSFP. Magn Reson Med 2011;66(5):1416–1421 [DOI] [PMC free article] [PubMed] [Google Scholar]
- 13.Shih YY, De la Garza BH, Muir ER, et al. Lamina-specific functional MRI of retinal and choroidal responses to visual stimuli. Invest Ophthalmol Vis Sci 2011;52(8):5303–5310 [DOI] [PMC free article] [PubMed] [Google Scholar]
- 14.Tomic L, Bjärnhall G, Mäepea O, Sperber GO, Alm A. Effects of oxygen and carbon dioxide on human retinal circulation: an investigation using blue field simulation and scanning laser ophthalmoscopy. Acta Ophthalmol Scand 2005;83(6):705–710 [DOI] [PubMed] [Google Scholar]
- 15.Pakola SJ, Grunwald JE. Effects of oxygen and carbon dioxide on human retinal circulation. Invest Ophthalmol Vis Sci 1993;34(10):2866–2870 [PubMed] [Google Scholar]
- 16.Riva CE, Grunwald JE, Sinclair SH. Laser Doppler velocimetry study of the effect of pure oxygen breathing on retinal blood flow. Invest Ophthalmol Vis Sci 1983;24(1):47–51 [PubMed] [Google Scholar]
- 17.Arend O, Harris A, Martin BJ, Holin M, Wolf S. Retinal blood velocities during carbogen breathing using scanning laser ophthalmoscopy. Acta Ophthalmol (Copenh) 1994;72(3):332–336 [DOI] [PubMed] [Google Scholar]
- 18.Sponsel WE, DePaul KL, Zetlan SR. Retinal hemodynamic effects of carbon dioxide, hyperoxia, and mild hypoxia. Invest Ophthalmol Vis Sci 1992;33(6):1864–1869 [PubMed] [Google Scholar]
- 19.Bill A, Sperber GO. Aspects of oxygen and glucose consumption in the retina: effects of high intraocular pressure and light. Graefes Arch Clin Exp Ophthalmol 1990;228(2):124–127 [DOI] [PubMed] [Google Scholar]
- 20.Stone J, Valet K. Roles of oxygen in the stability of photoreceptors. In: Chalupa LM, Williams RW, eds. Eye, retina, and visual system of the mouse. Cambridge, Mass: MIT Press, 2008; 559–572 [Google Scholar]
- 21.Kergoat H, Faucher C. Effects of oxygen and carbogen breathing on choroidal hemodynamics in humans. Invest Ophthalmol Vis Sci 1999;40(12):2906–2911 [PubMed] [Google Scholar]
Associated Data
This section collects any data citations, data availability statements, or supplementary materials included in this article.


