Figure 4b:
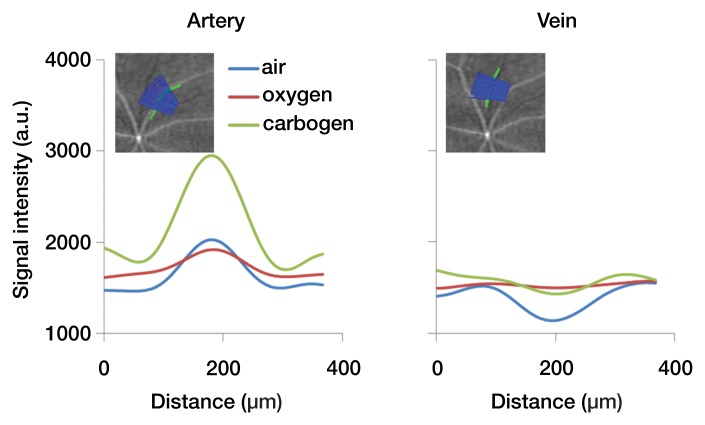
Time-of-flight MR angiographic images (26/4.3) of retinal vascular layer during gas challenges. (a) Images show flattened vascular structures during air, oxygen, and carbogen inhalation. (b) Graphs show corresponding vessel profiles from single animal. Insets: Flattened MR images of retinal vascular layer show analyzed segment. (c) Graphs show vessel diameter and peak signal intensity changes in retinal vessels associated with gas challenges (n = 7). * = P < .05, significantly different from oxygen inhalation.

