Ultrashort echo time–based MR imaging sequences allow both morphologic and quantitative assessment of meniscal calcifications by facilitating the acquisition of signal from calcifications and surrounding meniscal tissues, both with short T2* values.
Abstract
Purpose:
To assess the ability of ultrashort echo time (UTE) magnetic resonance (MR) imaging techniques to enable morphologic assessment of different types of meniscal calcifications, to compare these sequences with standard clinical sequences, and to perform T2* measurements of meniscal calcifications.
Materials and Methods:
This study was exempted by the institutional review board, and informed consent was not required. Ten human cadaveric menisci were imaged with high-spatial-resolution radiography and 3.0-T MR imaging by using morphologic (T1-weighted fast spin-echo [FSE], T2-weighted FSE, proton density [PD]-weighted FSE, two-dimensional [2D] fast spoiled gradient-echo [FSPGR], three-dimensional [3D] FSPGR, and 3D UTE) and quantitative (2D inversion-recovery [IR] UTE and 3D UTE) sequences. The menisci were divided into thirds for regional analysis. Morphologic assessment was performed with MR imaging; MR imaging findings were correlated with radiographs. Calcifications were classified as punctate, linear, or globular. T2* measurements were performed by manual placement of regions of interest (ROIs) in calcifications and by automatically creating ROIs in the surrounding tissues. Mixed-effects linear regression was used to determine variations in T2* as a function of region, morphology, and tissue type.
Results:
The two globular calcifications were visualized with all sequences. For punctate (n = 21) and linear (n = 21) calcifications, respectively, visibility rates were as follows: 9.5% for both with the T1-weighted FSE sequence, 0% for both with the T2-weighted FSE sequence, 19.0% and 23.8% with the PD-weighted FSE sequence, 0% for both with the 2D IR UTE sequence, 100% for both with the 3D UTE sequence, and 100% for both with the 3D FSPGR sequence. T2* values were significantly lower for calcifications than for the surrounding meniscal tissue (P < .001). There was a trend of globular calcifications having lower T2* values than other morphologies (P = .08). With the 2D IR UTE technique, the T2* of the globular calcifications tended to be lower than with the 3D UTE technique (0.13–0.16 vs 1.32–3.03 msec) (P = .14, analysis of variance).
Conclusion:
UTE MR imaging sequences may allow morphologic as well as quantitative evaluation of meniscal calcifications.
© RSNA, 2012
Introduction
The prevalence of meniscal calcifications may be as high as 5.6% (1). Meniscal calcifications can be due to trauma, degenerative disease, or crystal arthropathies such as calcium pyrophosphate crystal deposition disease (1–4). The presence of meniscal calcifications is of clinical importance because several authors (5–10) have suggested that they are associated with knee osteoarthritis. However, the causative relation between these two disorders is still debated.
Radiography is the most commonly used imaging technique for the evaluation of knee disease. It allows the identification of calcifications and has been successfully used to morphologically analyze meniscal calcifications, which have been categorized into punctate, linear, and globular (4,11,12). However, the sensitivity of radiography for the depiction of meniscal calcification is low. Fisseler and Müller (3) found a sensitivity of 35.3% for the depiction of macroscopically and microscopically proved calcifications for radiography of 3350 menisci. Computed tomography is likely the method of choice for the study of meniscal calcifications, but its use for the evaluation of knee disorders is limited by the exposure of patients to ionizing radiation and the relatively restricted range of image contrast in the soft tissues (4,13).
Although magnetic resonance (MR) imaging is the noninvasive technique of choice for the evaluation of knee, and more specifically meniscal, disease, it does not allow facile identification of meniscal calcifications (13,14). This is due in part to a lack of contrast between the meniscal tissue and calcifications, both of which are hypointense on images obtained with clinical sequences because of their relatively short intrinsic T2 relaxation times (13). In addition, the lack of spatial resolution with standard clinical sequences provides an additional challenge for the visualization of small punctate calcifications.
Furthermore, the signal characteristics of meniscal calcifications are not well understood. Even though they are often hypointense, it has been shown that calcifications can sometimes appear hyperintense with clinical MR imaging sequences and be mistaken for meniscal tears (15). The diagnostic performance of MR imaging in the detection of meniscal tears has been shown to decrease in the presence of chondrocalcinosis (16).
The ability to noninvasively measure magnetic properties of meniscal calcifications such as T2* values might result in a better understanding of the previously described signal variations and the pathophysiology of calcium deposits in menisci. It would have the potential to help us solve some controversies, such as the causative relationship between meniscal calcifications and degenerative joint disease, as well as serve as a potential biomarker for osteoarthritis.
We sought to assess the ability of two-dimensional (2D) and three-dimensional (3D) ultrashort echo time (UTE) MR imaging sequences to allow visualization and morphologic evaluation of different types of meniscal calcifications compared with the ability of more standard clinical sequences. Using the UTE-based sequences, we also attempted to quantitate these calcifications.
Materials and Methods
Meniscal Specimens and Imaging Technique
This study was exempted by the institutional review board, and informed consent was not required. We analyzed 10 human cadaveric menisci (average age of cadaver at death, 79.5 years ± 4) with documented calcifications on high-spatial-resolution radiographs (Faxitron HP 43805N X-ray System; Hewlett-Packard, Palo Alto, Calif [tube current, 25 kV; exposure time, 45 seconds]). During the dissection, the femorotibial cartilage of the knees, from which the menisci were harvested, was visually inspected and graded according to the Outerbridge system (17) (W.C.B., with 7 years of experience). All knees had osteoarthritic degeneration of the articular surface (one sample had grade III femoral and tibial surfaces; all others had grade IV surfaces).
Imaging was performed with a 3.0-T clinical imaging unit (Signa TwinSpeed; GE Healthcare, Waukesha, Wis) by using a single-channel 3-inch receive-only coil (a body coil was used for signal transmission). The specimens were placed in perfluorooctyl bromide solution to minimize susceptibility artifacts during MR imaging. They were positioned flat with their long axes perpendicular to the bore in the isocenter of the magnet. A line extrapolated between the anterior and posterior root ligament meniscal attachments was oriented perpendicular to B0 (Fig 1a). MR imaging sequences to characterize meniscal morphology included morphologic sequences (spin-echo T1-weighted, fast spin-echo [FSE] T2-weighted, FSE proton density [PD]-weighted, 2D fast spoiled gradient-echo (FSPGR), 3D FSPGR, and 3D UTE sequences), as well as quantitative sequences based on 3D UTE and 2D inversion recovery (IR) UTE techniques (Table 1).
Figure 1a:
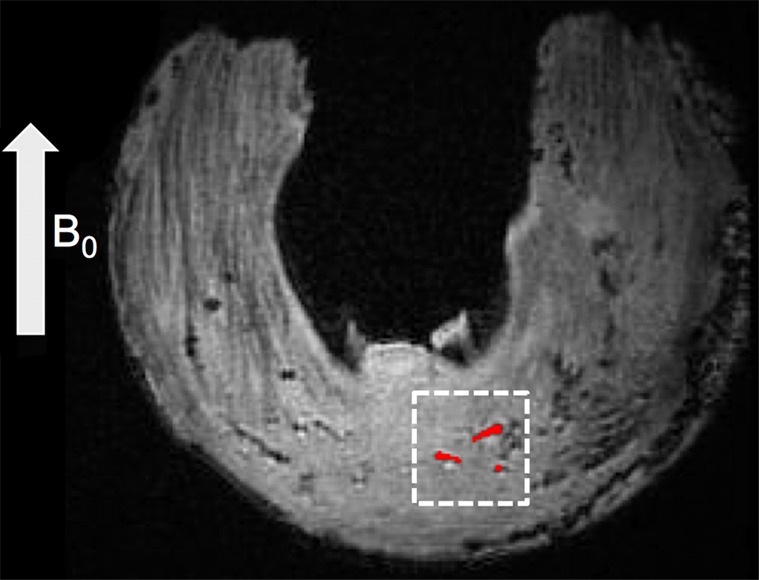
Quantitative evaluation: region-of-interest (ROI) selection on calcified zones and surrounding meniscal areas. (a) Axial 3D UTE second-echo MR image (echo time, 5 msec) shows direction of main magnetic field, B0 (arrow), along with a few calcifications (red regions inside dashed box) chosen as examples. (b) Magnified view of dashed box in a shows manually traced calcification (red) and automatically generated surrounding region (blue). The two regions are separated by an inner ring (dark area in between) that was approximately 0.25-mm wide to reduce error due to volume averaging.
Table 1.
MR Imaging Sequence Parameters
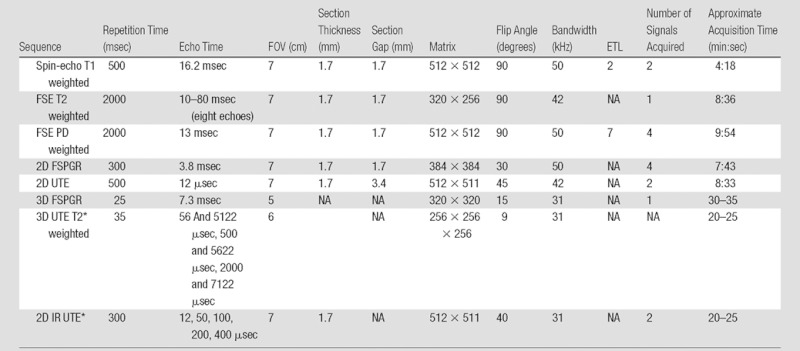
Note.—ETL = echo train length, FOV = field of view, NA = not applicable.
Inversion time for this sequence was 110 msec.
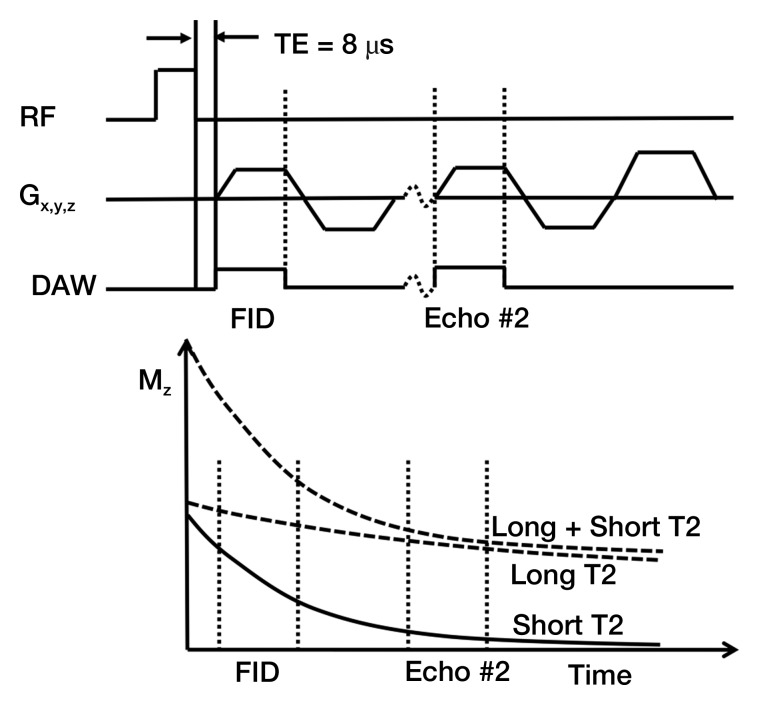
A morphologic and quantitative 3D UTE sequence was performed (Fig 2) by using a short-duration (40-μsec) rectangular radiofrequency pulse for signal excitation followed by dual-echo 3D radial ramp sampling. To quantify T2* values of the meniscal calcification, the dual-echo 3D UTE acquisition was repeated three times with paired echo times of 56 and 5122 μsec, 500 and 5622 μsec, and 2000 and 7122 μsec. Subtraction images were obtained for each pair of echo times. Other acquisition parameters for this sequence are reported in Table 1. The projection data were regridded onto a 256×256×256 matrix; this was followed by 3D Fourier transformation to produce the final 3D UTE images.
Figure 2:
Three-dimensional UTE sequence. This sequence used a short-duration (40-μsec) hard radiofrequency (RF) pulse for signal excitation, followed by dual-echo 3D radial ramp sampling. To quantify T2* values of the meniscal calcifications, the dual 3D UTE acquisition was repeated three times with paired echo times of 56 and 5122 μsec, 500 and 5622 μsec, and 2000 and 7122 μsec. The projection data were regridded onto a 256×256×256 matrix; this was followed by 3D Fourier transformation to produce the final 3D UTE images. DAW = data acquisition window, FID = free induction decay, Gx,y,z = gradients in x, y, and z axes, Mz = magnetization in z axis, TE = echo time.
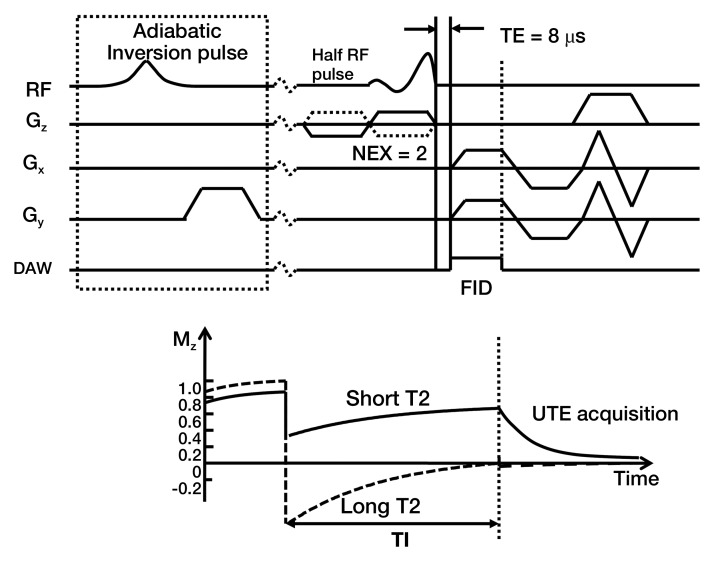
Another quantitative technique based on UTE application (Fig 3), that of IR UTE, was also performed. An adiabatic inversion pulse was used to invert the longitudinal magnetization of normal meniscal tissue and fat, while leaving the shorter T2 calcification largely unaffected (13). The inversion time (110 msec) was chosen near the null point of the longer T2 components. Other parameters for this IR UTE sequence are reported in Table 1. The contracted range of echo times from 12 to 400 μsec would target calcifications with very short T2* values, similar to those of cortical bone. Concomitantly, this range of echo times would not be sensitive to longer T2* values.
Figure 3:
IR UTE sequence. An adiabatic IR pulse was used to invert and null the relatively longer T2 signal from meniscal tissues and fat, while leaving the shorter T2 calcification largely unaffected. The inversion time (110 msec) was chosen near the null point of the longer T2 components. DAW = data acquisition window; FID = free induction decay; Gz, Gx, Gy = gradients in z, x, and y axes, respectively; NEX = number of signals acquired; RF = radiofrequency; TE = echo time.
Morphologic Assessment
Each meniscus was divided into equal thirds (anterior, central, and posterior regions) along the longitudinal axis, and the presence or absence of calcifications on high-spatial-resolution radiographs was noted by two reviewers in consensus (P.O. and C.B.C., with 2 and 12 years of experience in musculoskeletal imaging, respectively). The criteria used to define calcifications were high-density focal areas greater than 0.3 mm. Whenever present, the calcifications were classified as punctate (length ≤ three times width), linear (length > three times width), or globular (minimal width ≥ 2 mm). The MR images were viewed in the axial plane by the two musculoskeletal radiologists (P.O. and C.B.C.) in consensus. After the analysis of the MR images, the detection of calcifications was confirmed in correlation with the high-spatial-resolution radiographs. The criteria used to define calcifications on the MR images were as follows: The calcifications had to have the same morphologic pattern as on the radiographs (same shape and same spatial arrangement), and the calcifications were considered to be hypointense on images obtained with non-UTE sequences and hyperintense on 2D IR UTE images and 3D UTE subtraction images. Calcifications were differentiated from gas bubbles on the 3D UTE images because the latter were hypointense on all echo images (Fig 4).
Figure 4a:
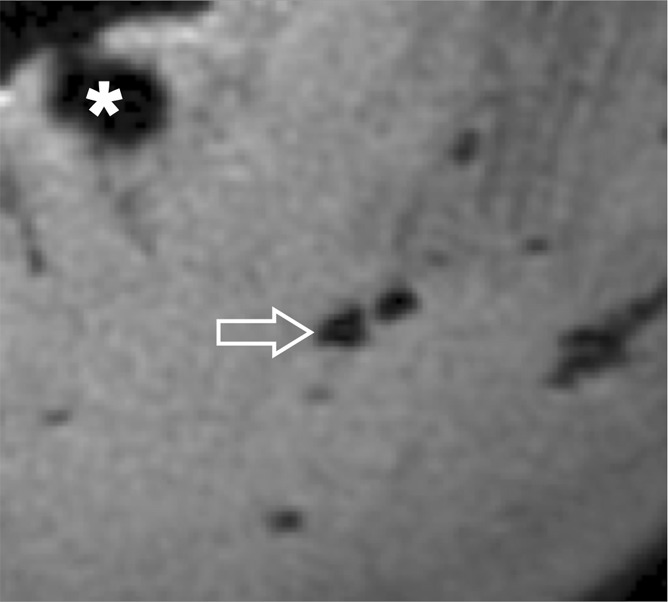
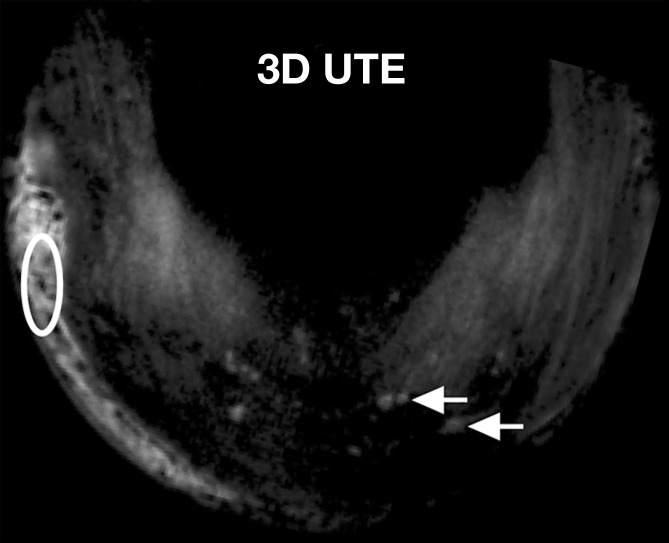
(a) Axial 3D UTE second-echo MR image (echo time, 5 msec) and (b) subtraction image (echo time, 8 μsec to 5 msec) show meniscal calcifications (arrow) in close-up. Contrast between calcifications and surrounding meniscal tissue can be created either by choosing the right echo time so that calcifications appear hypointense relative to the surrounding meniscus, or by suppressing longer T2* components with subtraction. With the latter technique, the calcifications appear hyperintense relative to the surrounding meniscal tissue, in the same fashion as with IR techniques. Note that calcifications can easily be differentiated from gas bubbles (*), which are hypointense with all echo times and hence hypointense on subtraction images as well.
Figure 4b:
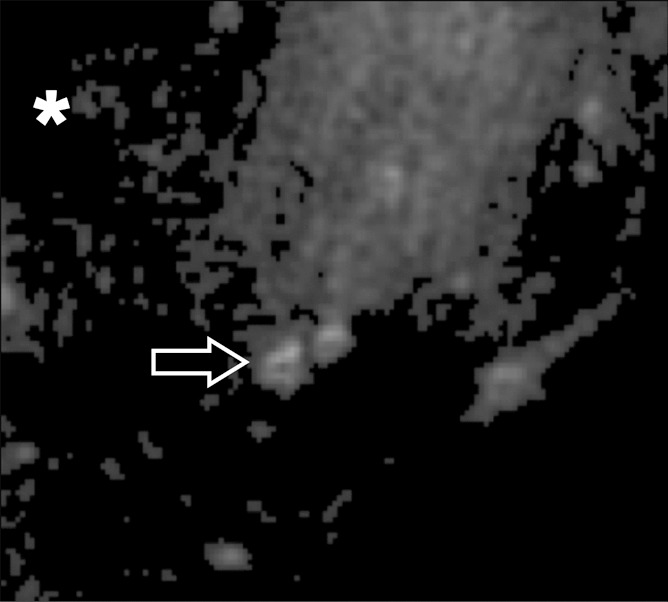
(a) Axial 3D UTE second-echo MR image (echo time, 5 msec) and (b) subtraction image (echo time, 8 μsec to 5 msec) show meniscal calcifications (arrow) in close-up. Contrast between calcifications and surrounding meniscal tissue can be created either by choosing the right echo time so that calcifications appear hypointense relative to the surrounding meniscus, or by suppressing longer T2* components with subtraction. With the latter technique, the calcifications appear hyperintense relative to the surrounding meniscal tissue, in the same fashion as with IR techniques. Note that calcifications can easily be differentiated from gas bubbles (*), which are hypointense with all echo times and hence hypointense on subtraction images as well.
Quantitative Assessment
On the images obtained with the 3D UTE sequence, ROIs were placed by using software (MATLAB, version 7.9; Mathworks, Natick, Mass) on calcifications, as well as on surrounding meniscal tissue, to determine T2* values (Fig 1). For each calcified region defined at the morphologic assessment, ROIs were selected on individual calcifications by means of dual-reader (P.O. and C.B.C.) consensus in the axial plane of the MR images and were correlated with the high-spatial-resolution radiographs. The criteria used to select the calcifications were the same as those utilized in the morphologic analysis. The ROIs of the meniscal tissue surrounding the calcification were created automatically by increasing the size of the ROIs representing the calcifications by 0.25 mm in all directions, followed by subtraction of the latter from the obtained ROIs. The resulting ROI was a 0.25-mm-wide boundary surrounding the calcification, separated by an inner ring that was also 0.25-mm wide to reduce error due to volume averaging (Fig 1b). After selection, we fit the average signal intensity of each ROI by using a monoexponential decay model and nonlinear least-squares algorithm to compute the T2* relaxation constant. ROIs were further grouped by their location within the meniscus (anterior, central, or posterior region).
Figure 1b:
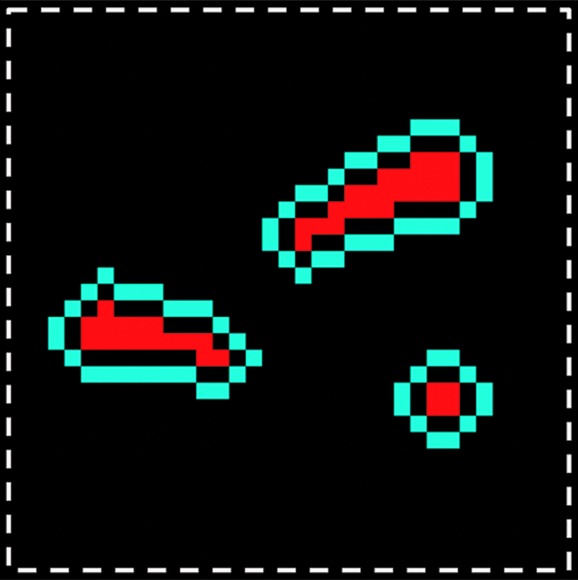
Quantitative evaluation: region-of-interest (ROI) selection on calcified zones and surrounding meniscal areas. (a) Axial 3D UTE second-echo MR image (echo time, 5 msec) shows direction of main magnetic field, B0 (arrow), along with a few calcifications (red regions inside dashed box) chosen as examples. (b) Magnified view of dashed box in a shows manually traced calcification (red) and automatically generated surrounding region (blue). The two regions are separated by an inner ring (dark area in between) that was approximately 0.25-mm wide to reduce error due to volume averaging.
Statistical Analysis
For quantitative assessment, T2* values were averaged by ROI type (calcification or surrounding) and region (anterior, central, or posterior) or morphology (punctate, linear, or globular). A linear mixed-effects model was used to determine variations in T2* as a function of region, morphology, and tissue type. Subject-specific random intercept was used in the model to account for within-subject correlation (18). The intraclass correlation coefficient of 0.70 was estimated by using variance components from the linear mixed-effects model. All statistical analyses were performed by using software (R, version 2.10.1; R Foundation for Statistical Computing, Vienna, Austria). The level of significance was set at P = .05.
Results
Morphologic Assessment
A total of 44 calcified regions were depicted with radiography and were classified into punctate (n = 21), linear (n = 21), and globular (n = 2). The distribution of the calcified regions along the meniscal axis was as follows: Ten calcified regions were located in the anterior horn; 18, in the meniscus body; and 16, in the posterior horn.
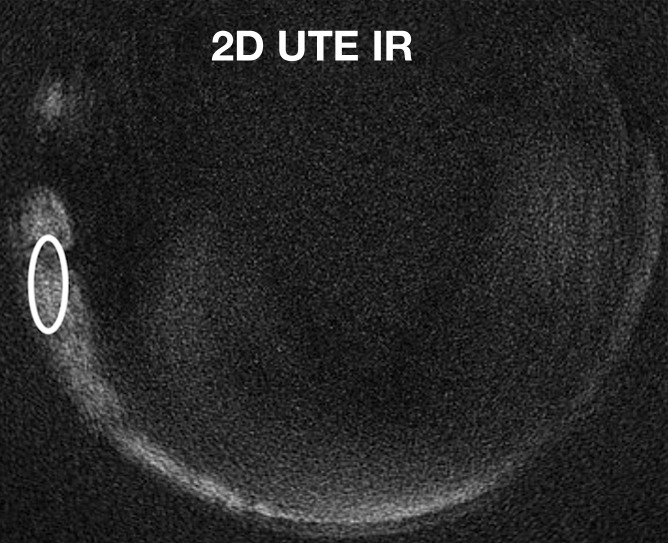
FSE T2-weighted sequences did not allow visualization of the punctate or linear calcifications. Conventional sequences with shorter echo times (FSE PD weighted and T1 weighted) allowed visualization of only 9.5%–23.8% of punctate and linear calcifications. The globular calcifications were visualized with all sequences. The 2D IR UTE technique showed only the globular calcifications, whereas the 3D FSPGR and 3D UTE sequences allowed detection of all types of calcifications (Fig 5) (Table 2).
Figure 5a:
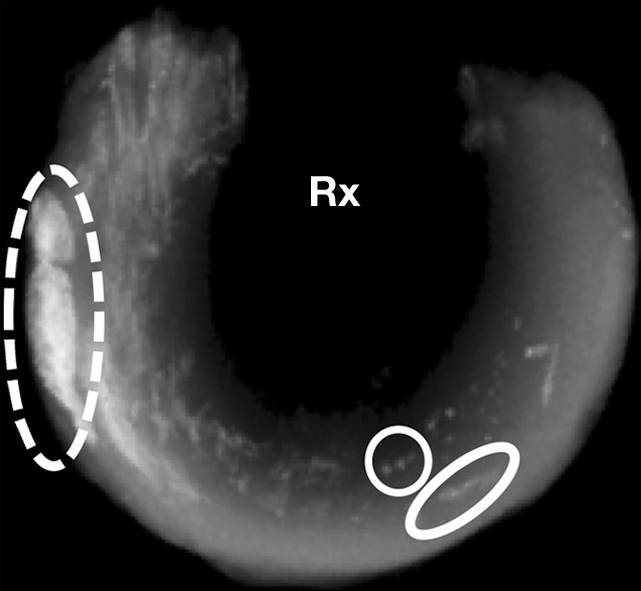
Morphologic evaluation of meniscal calcifications. (a) Axial radiograph (Rx), considered the reference standard, with which (b) axial 3D FSPGR and (c–e) axial 3D UTE MR images were correlated. Punctate (circles), linear (ovals), and globular (dashed ovals) calcifications are visible with all sequences. The calcifications show the same morphology and spatial arrangement as on a. They appear hypointense on b and hyperintense on e. Note that the signal from the calcifications decreases between the two echoes of the UTE sequences (c and d) because of their short T2* value. Also note that the areas surrounding the calcifications have lost their normal fibrillar pattern on b and d. TE = echo time.
Table 2.
Visibility Rates of Calcifications with Different MR Imaging Sequences

Note.—Data are percentages of visible calcifications, with raw numbers in parentheses. High-spatial-resolution radiography was the standard of reference.
Figure 5b:
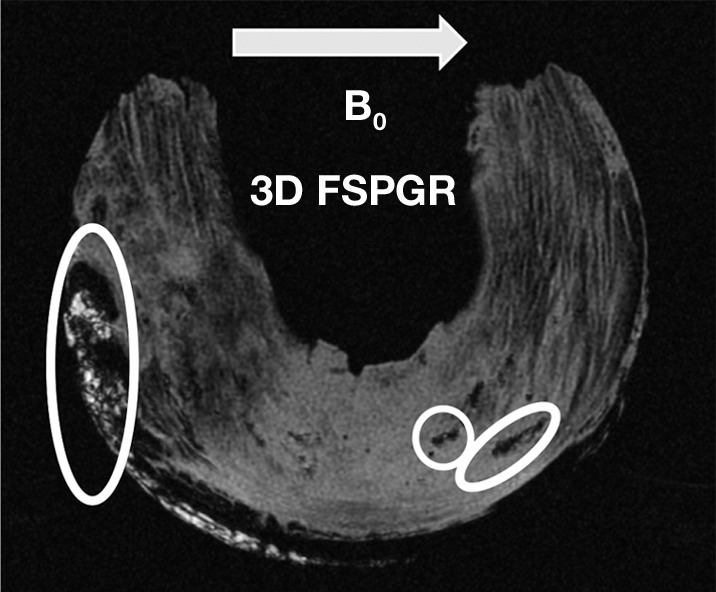
Morphologic evaluation of meniscal calcifications. (a) Axial radiograph (Rx), considered the reference standard, with which (b) axial 3D FSPGR and (c–e) axial 3D UTE MR images were correlated. Punctate (circles), linear (ovals), and globular (dashed ovals) calcifications are visible with all sequences. The calcifications show the same morphology and spatial arrangement as on a. They appear hypointense on b and hyperintense on e. Note that the signal from the calcifications decreases between the two echoes of the UTE sequences (c and d) because of their short T2* value. Also note that the areas surrounding the calcifications have lost their normal fibrillar pattern on b and d. TE = echo time.
Figure 5c:
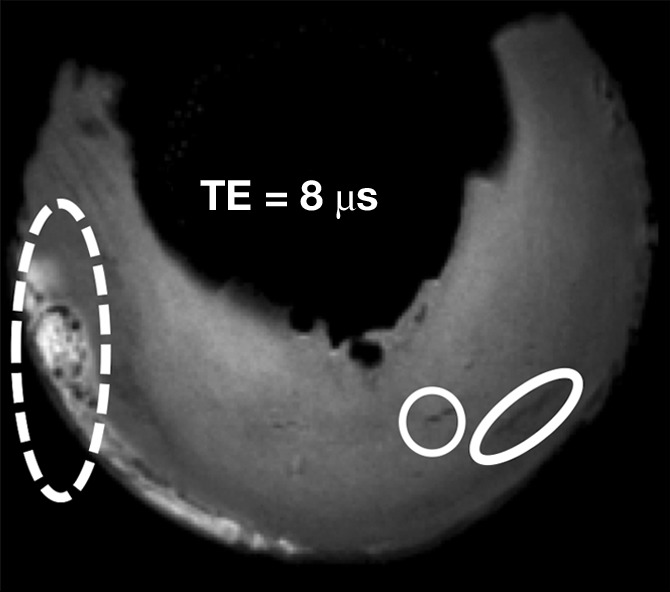
Morphologic evaluation of meniscal calcifications. (a) Axial radiograph (Rx), considered the reference standard, with which (b) axial 3D FSPGR and (c–e) axial 3D UTE MR images were correlated. Punctate (circles), linear (ovals), and globular (dashed ovals) calcifications are visible with all sequences. The calcifications show the same morphology and spatial arrangement as on a. They appear hypointense on b and hyperintense on e. Note that the signal from the calcifications decreases between the two echoes of the UTE sequences (c and d) because of their short T2* value. Also note that the areas surrounding the calcifications have lost their normal fibrillar pattern on b and d. TE = echo time.
Figure 5d:
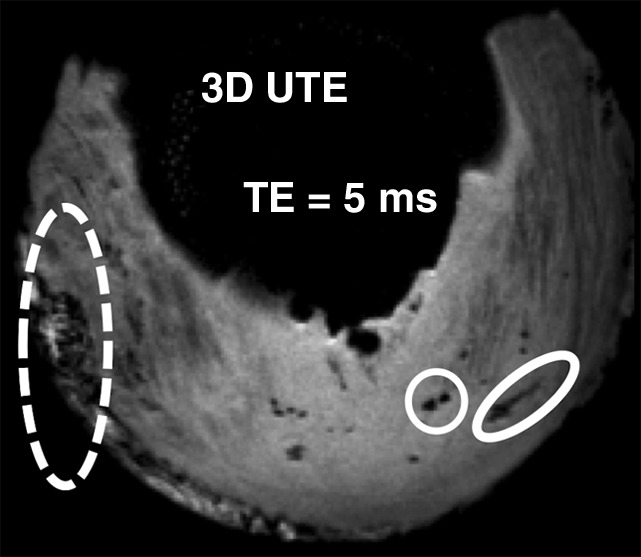
Morphologic evaluation of meniscal calcifications. (a) Axial radiograph (Rx), considered the reference standard, with which (b) axial 3D FSPGR and (c–e) axial 3D UTE MR images were correlated. Punctate (circles), linear (ovals), and globular (dashed ovals) calcifications are visible with all sequences. The calcifications show the same morphology and spatial arrangement as on a. They appear hypointense on b and hyperintense on e. Note that the signal from the calcifications decreases between the two echoes of the UTE sequences (c and d) because of their short T2* value. Also note that the areas surrounding the calcifications have lost their normal fibrillar pattern on b and d. TE = echo time.
Figure 5e:
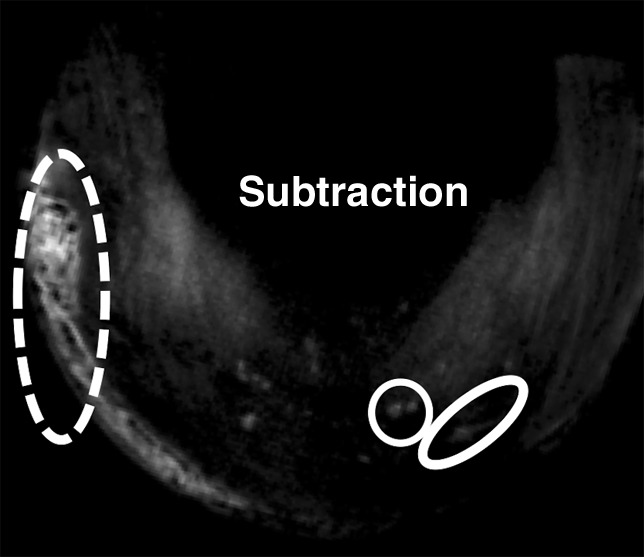
Morphologic evaluation of meniscal calcifications. (a) Axial radiograph (Rx), considered the reference standard, with which (b) axial 3D FSPGR and (c–e) axial 3D UTE MR images were correlated. Punctate (circles), linear (ovals), and globular (dashed ovals) calcifications are visible with all sequences. The calcifications show the same morphology and spatial arrangement as on a. They appear hypointense on b and hyperintense on e. Note that the signal from the calcifications decreases between the two echoes of the UTE sequences (c and d) because of their short T2* value. Also note that the areas surrounding the calcifications have lost their normal fibrillar pattern on b and d. TE = echo time.
Quantitative Assessment
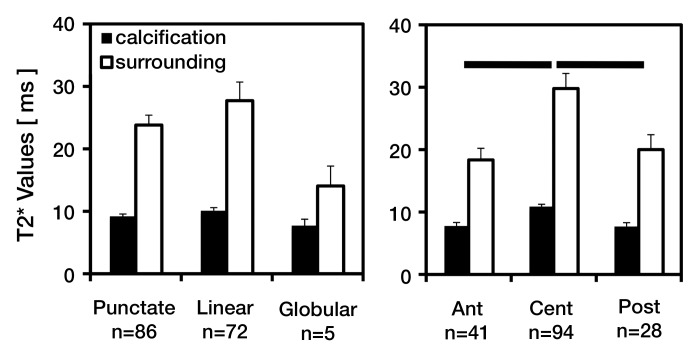
With the 3D UTE technique, a total of 162 ROIs were analyzed (Fig 6). Of these, 86 were punctate, 72 were linear, and five were globular in morphology. Ninety-four calcifications were found in the central region, 41 in the anterior region, and 28 in the posterior region of the menisci. T2* values differed significantly between tissue types (T2* of the surrounding meniscus was higher than the T2* of calcification, P < .001) but did not differ significantly between the three morphologies. However, there was a trend of globular morphology having lower T2* values than other morphologies (P = .08).
Figure 6:
Bar graphs show results of quantitative T2* assessment of meniscus calcification by using the 3D UTE technique. T2* values of calcifications and surrounding meniscal tissues averaged according to (left) calcification morphology and (right) anatomic region suggest lower T2* values for calcifications compared with their surrounding tissues and variations according to calcification morphology and anatomic region. Error bars = standard errors of the mean. Ant = anterior, Cent = central, Post = posterior.
T2* values of calcifications averaged between 8 and 10 msec—significantly lower than the 14–28 msec found in surrounding meniscal tissue (P < .001). In addition, T2* values varied with region (Fig 6b). The average T2* value of the central region (calcification, approximately 11 msec, and surrounding meniscal tissue, approximately 30 msec) was significantly higher than that of the anterior (approximately 8 and 18 msec, respectively) and posterior (approximately 8 and 20 msec, respectively) regions (P < .001 for each).
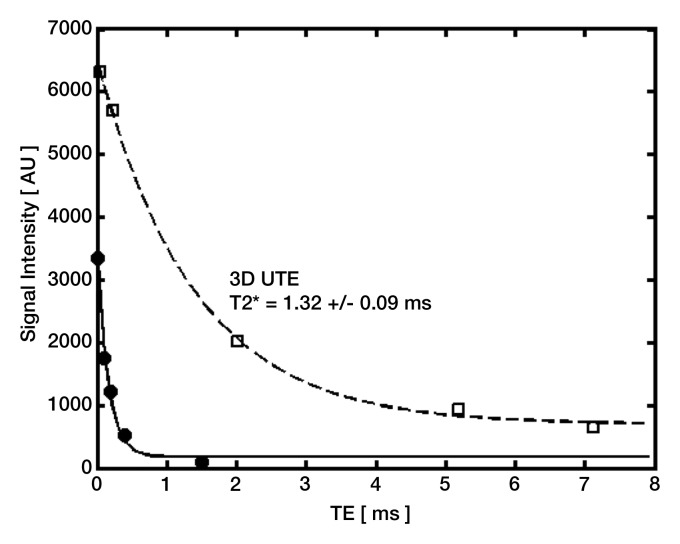
We also compared the T2* values of globular calcifications obtained by using the 2D IR UTE technique and those obtained by using the 3D UTE technique. With the 2D IR UTE technique, the T2* of the globular calcifications ranged from 0.13 to 0.16 msec, whereas with the 3D UTE technique, it tended to be higher (P = .14, analysis of variance), ranging from 1.32 to 3.03 msec (Fig 7).
Figure 7a:
Quantitative analysis (T2* measurements) of globular calcifications (ovals) on axial (a) 3D UTE subtraction image (echo time, 8 μsec to 5 msec) and (b) 2D IR UTE image. (c) Graph shows data and corresponding fitting curves. T2* values are higher with the 3D UTE technique (dashed curve) than with the 2D IR UTE technique (solid curve), which focuses on shorter T2* components. Note that only globular calcifications are visible on b, contrary to punctate calcifications (arrows in a). TE = echo time.
Figure 7b:
Quantitative analysis (T2* measurements) of globular calcifications (ovals) on axial (a) 3D UTE subtraction image (echo time, 8 μsec to 5 msec) and (b) 2D IR UTE image. (c) Graph shows data and corresponding fitting curves. T2* values are higher with the 3D UTE technique (dashed curve) than with the 2D IR UTE technique (solid curve), which focuses on shorter T2* components. Note that only globular calcifications are visible on b, contrary to punctate calcifications (arrows in a). TE = echo time.
Figure 7c:
Quantitative analysis (T2* measurements) of globular calcifications (ovals) on axial (a) 3D UTE subtraction image (echo time, 8 μsec to 5 msec) and (b) 2D IR UTE image. (c) Graph shows data and corresponding fitting curves. T2* values are higher with the 3D UTE technique (dashed curve) than with the 2D IR UTE technique (solid curve), which focuses on shorter T2* components. Note that only globular calcifications are visible on b, contrary to punctate calcifications (arrows in a). TE = echo time.
Discussion
Factors to be considered for the depiction of calcifications with MR imaging sequences are related to either the sequence (ie, ability to acquire signal from short-T2 tissues, image contrast, and spatial resolution) or the tissue to be imaged (intrinsic MR imaging properties such as the T2 value). We addressed these issues to perform high-spatial-resolution (0.15–0.23-mm) isotropic 3D sequences with echo times that are short enough to acquire signal from short-T2 tissues and create the appropriate contrast between the calcified areas and the surrounding meniscal tissue.
Two previous studies (13,14) that addressed calcium pyrophosphate crystal deposition disease of the knee failed to show meniscal calcifications with MR imaging by using conventional clinical sequences. This might be due to the relatively long echo times of the sequences used in these studies. Both calcifications and menisci have short T2 values (previous reports have found T2 values ranging from 6.5 to 12.6 msec in normal menisci) (19–21). Therefore, both tissues would appear hypointense at echo times equal to or greater than these T2 values.
We found that the UTE sequences showed a significant difference in the T2* values of the calcifications versus the surrounding tissue. Therefore, it was possible to create contrast between these tissues either by choosing the appropriate echo time, thereby unmasking the calcifications as hypointense structures surrounded by higher-intensity meniscal tissue, or by suppressing signal from the relatively longer-T2 meniscal tissue by using subtraction or IR preparation.
Another factor influencing contrast in fibrillar structures such as menisci is the magic angle phenomenon, which artifactually increases the T2 value of fibrillar tissues angled at 55° relative to B0 (19,22,23). In our study, the magic angle phenomenon mainly affected the central regions, with less effect on calcifications, and therefore led to increased contrast between the calcifications and the surrounding meniscal tissue. This could explain the greater difference between T2* values of the meniscal calcifications and the surrounding tissues in these regions.
The 2D sequences could not depict most of the linear and punctate calcifications, whereas the 3D sequences (3D SPGR and 3D UTE) showed 100% of all calcifications, including the smaller punctate and linear types. This is at least partly owing to the larger section thickness and gap (1.7 mm) of the 2D sequences, contrasting with the high-spatial-resolution isotropic 3D FSPGR and 3D UTE sequences (spatial resolution, 0.15 and 0.23 mm, respectively).
Meniscal calcifications appear to be substances that demonstrate a range of T2/T2* values that are short and require UTE techniques to acquire signal from them (19). Because of this ability to generate signal from the calcifications on shorter-echo images, UTE sequences allowed easy identification of calcified areas and their differentiation from gaseous areas, contrary to FSPGR sequences, with which both calcifications and gas were hypointense. In addition, UTE sequences allowed quantitative analysis of the meniscal calcifications. On the other hand, because of their longer echo times (≥3.8 msec), FSPGR sequences did not allow accurate quantitative assessment of shorter-T2* components of calcifications. The T2* values of the globular calcifications obtained with the 3D UTE sequence differed from those obtained with the 2D IR UTE sequence (the latter giving shorter T2* values). This can be explained by the fact that the 2D IR UTE sequence focuses on shorter T2* components of the tissue—the longer T2* components being suppressed by the IR pulse (24). Thus, the IR UTE technique might be useful for the quantitative evaluation of those calcifications with a more organized structure, which likely have shorter T2* values.
T2* values of the meniscal tissue around the calcifications (15–25 msec) were slightly higher than expected on the basis of previous data obtained in normal menisci. Gatehouse et al (20) reported values ranging from 6.5 to 12.6 msec, while Tsai et al (21) reported values ranging from 8.1 to 12.6 msec. This can be explained in part by the fact that calcifications usually occur in areas of degenerative disease or tears, which present increased T2/T2* values (25,26).
Another explanation for the relatively high T2* values of the meniscal tissue is the magic angle effect. Most of our T2* values were measured in the central regions of the menisci, which exhibited the magic angle effect (the main meniscal collagen fibers were oriented at around 55° relative to B0 in these regions) (22). This phenomenon at least partly explains the higher T2* values of the surrounding meniscal tissue in the central region compared with the values in other regions.
Our study had some limitations. We did not perform histologic correlation to confirm the presence of the calcifications. However, the accuracy of radiography in depicting calcifications in soft tissues is well accepted, and this technique has been used as a reference in several studies in the past (1,12–14,25). Our study was performed with the menisci at room temperature instead of body temperature, which might have resulted in underestimation of the T2* values, considering that T2* linearly increases with temperature (27).
Only a limited number of cadaveric menisci were studied, and we did not obtain any statistical data concerning the performance of these sequences in depicting meniscal calcifications. Although several morphologic types of calcifications were represented in our study, our work was limited to osteoarthritic knees; therefore, we may not have covered some causes of meniscal calcifications. Furthermore, this study was performed ex vivo, with long acquisition times that would require translational modifications for clinical use. However, imaging time can be reduced with further development in sampling strategies and contrast mechanisms (28,29), which may allow us to evaluate meniscal calcification in vivo.
In conclusion, UTE-based MR imaging sequences allow both morphologic and quantitative assessment of meniscal calcifications by facilitating the acquisition of signal from calcifications and surrounding meniscal tissues, both with short T2* values.
Future studies will focus on the correlation of our quantitative data with biochemical and histologic data to get a better understanding of the pathophysiology of meniscal calcifications, as well as the adaptation of existing sequences to study whole-knee specimens, getting one step closer to the in vivo evaluation of meniscal calcifications.
Advances in Knowledge.
• Ultrashort echo time (UTE) MR imaging sequences allow depiction of meniscal calcifications.
• UTE MR imaging sequences might allow quantitative evaluation of meniscal calcifications.
Implication for Patient Care.
• UTE MR imaging sequences may be helpful in the identification and characterization of meniscal calcifications, which are a known cause of false-positive meniscal tear diagnoses at MR imaging.
Disclosures of Potential Conflicts of Interest: P.O. No potential conflicts of interest to disclose. W.C.B. No potential conflicts of interest to disclose. J.D. No potential conflicts of interest to disclose. E.D. No potential conflicts of interest to disclose. S.S. No potential conflicts of interest to disclose. G.M.B. Financial activities related to the present article: none to disclose. Financial activities not related to the present article: institution has grants or grants pending with GE Healthcare. Other relationships: none to disclose. C.B.C. Financial activities related to the present article: institution has received a Veterans Administration Merit Grant. Financial activities not related to the present article: none to disclose. Other relationships: none to disclose.
Acknowledgments
We thank Tanya Wolfson, MS, for her help in the statistical analysis of the data.
Received July 10, 2011; revision requested August 21;revision received October 25; accepted November 16; final version accepted January 31, 2012.
Funding: This research was supported by the National Institutes of Health (grant R21 DE019008).
Current address: Department of Radiology, Cliniques Universitaires St Luc, Université Catholique de Louvain, Brussels, Belgium.
Abbreviations:
- FSE
- fast spin echo
- FSPGR
- fast spoiled gradient echo
- IR
- inversion recovery
- PD
- proton density
- ROI
- region of interest
- 3D
- three-dimensional
- 2D
- two-dimensional
- UTE
- ultrashort echo time
References
- 1.Mccarty DJ, Jr, Hogan JM, Gatter RA, Grossman M. Studies on pathological calcifications in human cartilage. I. Prevalence and types of crystal deposits in the menisci of two hundred fifteen cadavera. J Bone Joint Surg Am 1966;48(2):309–325 [PubMed] [Google Scholar]
- 2.Weaver JB. Calcification and ossification of the menisci. J Bone Joint Surg Am 1942;24(4):873 [Google Scholar]
- 3.Fisseler-Eckhoff A, Müller KM. Arthroscopy and chondrocalcinosis. Arthroscopy 1992;8(1):98–104 [DOI] [PubMed] [Google Scholar]
- 4.Steinbach LS. Calcium pyrophosphate dihydrate and calcium hydroxyapatite crystal deposition diseases: imaging perspectives [vii.]. Radiol Clin North Am 2004;42(1):185–205, vii. [DOI] [PubMed] [Google Scholar]
- 5.Canhão H, Fonseca JE, Leandro MJ, et al. Cross-sectional study of 50 patients with calcium pyrophosphate dihydrate crystal arthropathy. Clin Rheumatol 2001;20(2):119–122 [DOI] [PubMed] [Google Scholar]
- 6.Derfus BA, Kurian JB, Butler JJ, et al. The high prevalence of pathologic calcium crystals in pre-operative knees. J Rheumatol 2002;29(3):570–574 [PubMed] [Google Scholar]
- 7.Mitsuyama H, Healey RM, Terkeltaub RA, Coutts RD, Amiel D. Calcification of human articular knee cartilage is primarily an effect of aging rather than osteoarthritis. Osteoarthritis Cartilage 2007;15(5):559–565 [DOI] [PMC free article] [PubMed] [Google Scholar]
- 8.Fuerst M, Bertrand J, Lammers L, et al. Calcification of articular cartilage in human osteoarthritis. Arthritis Rheum 2009;60(9):2694–2703 [DOI] [PubMed] [Google Scholar]
- 9.Sun Y, Mauerhan DR, Honeycutt PR, et al. Calcium deposition in osteoarthritic meniscus and meniscal cell culture. Arthritis Res Ther 2010;12(2):R56. [DOI] [PMC free article] [PubMed] [Google Scholar]
- 10.MacMullan PA, McCarthy GM. The meniscus, calcification and osteoarthritis: a pathologic team. Arthritis Res Ther 2010;12(3):116. [DOI] [PMC free article] [PubMed] [Google Scholar]
- 11.Resnick D, Niwayama G, Goergen TG, et al. Clinical, radiographic and pathologic abnormalities in calcium pyrophosphate dihydrate deposition disease (CPPD): pseudogout. Radiology 1977;122(1):1–15 [DOI] [PubMed] [Google Scholar]
- 12.Brandes A, Müller KM. Calcinosis of the meniscus: morphologic and roentgenographic findings for zonal classification [in German]. Pathologe 1995;16(4):269–277 [DOI] [PubMed] [Google Scholar]
- 13.Beltran J, Marty-Delfaut E, Bencardino J, et al. Chondrocalcinosis of the hyaline cartilage of the knee: MRI manifestations. Skeletal Radiol 1998;27(7):369–374 [DOI] [PubMed] [Google Scholar]
- 14.Abreu M, Johnson K, Chung CB, et al. Calcification in calcium pyrophosphate dihydrate (CPPD) crystalline deposits in the knee: anatomic, radiographic, MR imaging, and histologic study in cadavers. Skeletal Radiol 2004;33(7):392–398 [DOI] [PubMed] [Google Scholar]
- 15.Burke BJ, Escobedo EM, Wilson AJ, Hunter JC. Chondrocalcinosis mimicking a meniscal tear on MR imaging. AJR Am J Roentgenol 1998;170(1):69–70 [DOI] [PubMed] [Google Scholar]
- 16.Kaushik S, Erickson JK, Palmer WE, Winalski CS, Kilpatrick SJ, Weissman BN. Effect of chondrocalcinosis on the MR imaging of knee menisci. AJR Am J Roentgenol 2001;177(4):905–909 [DOI] [PubMed] [Google Scholar]
- 17.Outerbridge RE. The etiology of chondromalacia patellae. J Bone Joint Surg Br 1961;43-B:752–757 [DOI] [PubMed] [Google Scholar]
- 18.Laird NM, Ware JH. Random-effects models for longitudinal data. Biometrics 1982;38(4):963–974 [PubMed] [Google Scholar]
- 19.Bydder GM, Chung CB. Magnetic resonance imaging of short T2 relaxation components in the musculoskeletal system. Skeletal Radiol 2009;38(3):201–205 [DOI] [PubMed] [Google Scholar]
- 20.Gatehouse PD, He T, Puri BK, Thomas RD, Resnick D, Bydder GM. Contrast-enhanced MRI of the menisci of the knee using ultrashort echo time (UTE) pulse sequences: imaging of the red and white zones. Br J Radiol 2004;77(920):641–647 [DOI] [PubMed] [Google Scholar]
- 21.Tsai PH, Chou MC, Lee HS, et al. MR T2 values of the knee menisci in the healthy young population: zonal and sex differences. Osteoarthritis Cartilage 2009;17(8):988–994 [DOI] [PubMed] [Google Scholar]
- 22.Bydder M, Rahal A, Fullerton GD, Bydder GM. The magic angle effect: a source of artifact, determinant of image contrast, and technique for imaging. J Magn Reson Imaging 2007;25(2):290–300 [DOI] [PubMed] [Google Scholar]
- 23.Du J, Pak BC, Znamirowski R, et al. Magic angle effect in magnetic resonance imaging of the Achilles tendon and enthesis. Magn Reson Imaging 2009;27(4):557–564 [DOI] [PubMed] [Google Scholar]
- 24.Du J, Carl M, Bydder M, Takahashi A, Chung CB, Bydder GM. Qualitative and quantitative ultrashort echo time (UTE) imaging of cortical bone. J Magn Reson 2010;207(2):304–311 [DOI] [PubMed] [Google Scholar]
- 25.Noble J, Hamblen DL. The pathology of the degenerate meniscus lesion. J Bone Joint Surg Br 1975;57(2):180–186 [PubMed] [Google Scholar]
- 26.Hodler J, Haghighi P, Pathria MN, Trudell D, Resnick D. Meniscal changes in the elderly: correlation of MR imaging and histologic findings. Radiology 1992;184(1):221–225 [DOI] [PubMed] [Google Scholar]
- 27.He T, Smith G, Carpenter JP, Mohiaddin R, Pennell D, Firmin D. A phantom study of temperature-dependent MRI T2* measurement. J Cardiovasc Magn Reson 2009;11(Suppl 1)P147 [Google Scholar]
- 28.Barger AV, Block WF, Toropov Y, Grist TM, Mistretta CA. Time-resolved contrast-enhanced imaging with isotropic resolution and broad coverage using an undersampled 3D projection trajectory. Magn Reson Med 2002;48(2):297–305 [DOI] [PubMed] [Google Scholar]
- 29.Du J, Bydder M, Takahashi AM, Carl M, Chung CB, Bydder GM. Short T2 contrast with three-dimensional ultrashort echo time imaging. Magn Reson Imaging 2011;29(4):470–482 [DOI] [PMC free article] [PubMed] [Google Scholar]


