Abstract
Formation of a cartilaginous soft callus at the site of a bone fracture is a pivotal stage in the healing process. Noninvasive, or even nondestructive, imaging of soft callus formation can be an important tool in experimental and pre-clinical studies of fracture repair. However, the low X-ray attenuation of cartilage renders the soft callus nearly invisible in radiographs. This study utilized a recently developed, cationic, iodinated contrast agent in conjunction with micro-computed tomography to identify cartilage in fracture calluses in the femora of C57BL/6J and C3H/HeJ mice. Fracture calluses were scanned beforeand after incubation in the contrast agent. The set of pre-incubation images was registered against and then subtracted from the set of post-incubation images, resulting in a three-dimensional map of the locations of cartilage in the callus, as labeled by the contrast agent. This map was then compared to histology from a previous study. The results showed that the locations where the contrast agent collected in relatively high concentrationswere similar to those of the cartilage. The contrast agent also identified a significant difference between the two strains of mice in the percentage of the callus occupied by cartilage, indicating that this method of contrast-enhanced computed tomography may be an effective technique for nondestructive, early evaluation of fracture healing.
Keywords: stabilized fracture, fracture callus, micro-computed tomography, contrast agent, mouse
Introduction
The formation of cartilage in a fracture callus is a crucial step in the healing process of the majority of bone fractures. The cartilaginous soft callus provides initial stability across the fracture gap (White et al., 1977) and a template for endochondral ossification (Gerstenfeld et al., 2003; Kayal et al., 2007; Scammell and Roach, 1996). Technologies that enable minimallyinvasive, low cost, and rapid three-dimensional (3D) visualization of cartilage in vivo,or even in vitro, could provide tremendous benefits in the assessment and study of fracture healing. In the clinic, these benefits include early identification of and interventionfor non-unions. In the laboratory, such technologies could reduce the reliance on destructive and time-consuming histological analysis and allow for higher throughput evaluation of healing with little to no increase in sample size.
Radiographs and computed tomography (CT) are the most commonly used technologies for the assessment of fracture healing. However, the effectiveness of these imaging modalities for visualizing the soft callus has been restricted by the low radio-opacity of cartilage, and as a result they have been largely used for assessment of only the later phases of healing. Results from imaging studies on articular cartilage suggest that CT imaging in the presence of a contrast agent may allow simultaneous visualization of mineralized tissue and the cartilaginous soft callus by exploiting electrostatic interactions between an ionic contrast agent and the negatively charged glycosaminoglycans (GAGs) in the extracellular matrix of cartilage. Negatively charged contrast agents such as gadolinium and Hexabrix (ioxaglate sodium) have been shown to accumulate in articular cartilage in inverse proportion to GAG concentration (Bashir et al., 1996; Palmer et al., 2006; Williams et al., 2004; Xie et al., 2009).Moreover, as GAG concentration is linearly correlated with elastic modulus in this tissue(Bansal et al., 2010), the concentrations of these contrast agents in a region of tissue can be an indicator of mechanical competence. Basedon these promising results, cationic contrast agents were developed to provide even better performance for both in vivo and in vitro applications of contrast-enhanced computed tomography (CECT), as the electrostatic attraction between a positively charged contrast agent and the negatively charged GAGs in cartilage results in higher intensities and bettersegmentation capabilities between cartilage and bone (Joshi et al., 2009). With an iodinated contrast agent that is sufficiently specific to cartilage, simultaneous imaging of cartilage and bone tissue in fracture calluses wouldbe possible using CECT, thus allowing for rapid quantification of many measures of healing progress, in both the early and the later phases of repair.
A recently developed, iodinated contrast agent with four formal positive charges per molecule, CA4+, has shown greater specificity for GAGs in cartilage as compared to anionic contrast agents and to other cationic contrast agents with fewer positive charges (Bansal et al., 2011; Joshi et al., 2009). CA4+ has been shown to identify articular cartilagein a CT scan of a rabbit femur, detect differences in GAG concentration among different layers of articular cartilage, and provide a significant correlation between CT attenuation and GAG concentration (Bansal et al., 2011; Joshi et al., 2009). These results suggest that CA4+ may provide a means of identifying cartilage within a fracture callus both in vivo and in vitro.
The overall goal of this study was to develop a method for quantitative visualization of cartilage in fracture calluses in vitro, using micro-computed tomography (μCT) and the cationic contrast agent, CA4+. Calluses from two strains of mice with known differences in the development of cartilage and bone during fracture healing—C57BL/6J (B6) and C3H/HeJ (C3H)—were examined. Fracture calluses in C3H mice have been found to exhibit a shorter period of chondrogenesis and an earlier onset of osteogenesis as compared to B6 calluses. Despite this more rapid endochondral progression, C3H fracture calluses regain full strength later than B6 calluses, perhaps due to their smaller callus size and later onset of bony bridging (Jepsen et al., 2008). The specific objectives of this study were (1) to use the contrast agent to characterize the morphology of the cartilaginous callus and the progress of endochondral ossification in a manner parallel to standard histomorphometric analyses of fracture healing; and (2) to compare the distributions of cartilage and newly formed bone between the C3H and B6 calluses.
Materials and Methods
Animals and Animal Protocol
All of the animal experiments were conducted according to a protocol approved by the Institutional Animal Care and Use Committee (IACUC) at the Boston University School of Medicine in Boston, MA. Sixteen B6 and eight C3H male mice, 8–10 weeks of age, were purchased from Charles River Laboratories (Wilmington, MA) and enrolled in this study. Age, sex, and genetic strains of mice were chosen based on a previous study that showed variations in the formation of cartilage and bone over the time course of fracture healing, using both histological analysis and assessment of the expression of selected candidate genes (Jepsen et al., 2008). Simple transverse, closed, unilateral fractures were made in the right femora of all mice and were stabilized by inserting an intramedullary pin retrograde through the distal condyle of the femur and anchoring the pin in the greater trochanter. This technique is a modification of the method of Bonnarens and Einhorn (1984), as described by Gerstenfeld et al. (2006).
Animals were sacrificed at post-operative day 9.5 (i.e., the evening of the ninth post-operative day), and the excised femora were cleaned of muscle tissue. A specimen was excluded if the fracture did not extend through the entire cortex (n = 1), if the fracture was not located at the mid-diaphysis (n = 4), or if the fracture was not well stabilized with the intramedullary pin (n = 5), resulting in seven specimens from each strain. An additional two calluses were excluded because of anomalous attenuation values and because of an excessive amount of deformation of a fracture callus during incubation in the contrast agent, resulting in six B6 and six C3H calluses. The harvested calluses were stored in gauze and phosphate-buffered saline (PBS), and they were kept frozen at −20 °C until imaging commenced.
Materials
The cationic iodinated contrast agent CA4+ contains four positive charges, two aromatic rings, and six iodine atoms per molecule as shown in Figure 1 (Joshi et al., 2009). Its composition is similar in size and structure to Hexabrix, which also has two aromatic rings and six iodine atoms, but contains one carboxylic acid functionality per molecule and, thus, possesses one negative charge overall. For the experiments in this study, solutions of CA4+ were diluted in PBS (pH 7.4) to a concentration of 27 mg I/mL (Bansal et al., 2011).
Fig. 1.
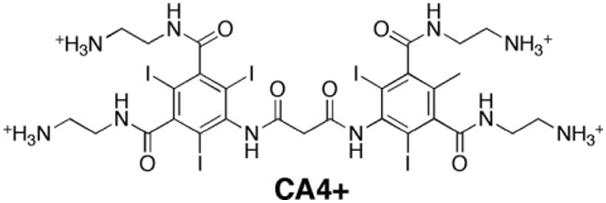
Chemical structure of the CA4+ contrast agent.
μCT Imaging
A μCT scan of each fracture callus was performed both before and after incubationwith the contrast agent using a desktop μCT system (μCT40, Scanco MedicalAG, Brüttisellen Switzerland). The region that was scanned consisted of a segmentof the callus approximately 4.8 mm long and centered around the fracture gap. The scan resolution was 6 μm/voxel, and the peak voltage, current, and integration time were70 kV, 114 mA, and 200 ms, respectively.
Incubation
Each fracture callus was fully immersed in 0.8 mL of the solution of CA4+ for 24 h at room temperature. For the first and last hour of the incubation period, the vials containing the calluses were floated in a tabletop ultrasonic chamber (model 3510; Branson Ultrasonics Corporation, Danbury, CT) to facilitate diffusion of the contrast agent into the callus.
Image Analysis
Stacks of 200 transverse tomograms from the pre-and post-incubation scans were loaded into Amira 5.2.2 (Visage Imaging, Andover, MA) and aligned using affine registration. The algorithm for affine registration that we used seeks to align a pair of volumes of image data (3D image data sets) by transforming one volume such that the differences in image intensity between the two are minimized. Affine registration can use a transformation that consists of translation, rotation, anisotropic expansion/contraction, and shear; however, in this study, we allowed only rigid transformations (no expansion/contraction or shear),and we constrained the range of intensities that were used in the matching process such that only the cortices were used to calculate the best transformation. The major limitation on the accuracy of the affine registration was the relative movement of the cortical fragments that occurred during specimen handling in between the two scans and that occurreddue to deformation of the callus during incubation in the contrast agent. This relative movement made simultaneous, perfect registration of both fragments impossible. To reduce the magnitude of this error, subsets of the images, corresponding to short, longitudinal segments of the callus that were centered on each of the 15 analyzed locations, were registered individually.
Following registration, the pre-incubation images were subtracted from the registered, post-incubation images using a simple arithmetic operation. Registration errors for this approach were estimated by deforming and rotating a representative volume, subtracting it from the original volume, and analyzing the resulting subtracted volume. The analysis indicated that approximately 1% of the voxels identified as cartilage were erroneously identified as such due to a residual mismatch in the images following registration. A lower threshold of 36 (on an 8-bit grayscale (i.e., 0–255 range)) was applied to the subtracted image to reduce background noise, and an upper threshold of 90 was applied to exclude any portions of the cortex that remained due to registration errors. The thresholds were determined by an analysis of subtracted images and examination of the histogram of the intensities within a representative subtracted volume. The histogram was deconstructed into the sum of three normal distributions: intensities that appeared to representbackground noise; those that appeared to represent PBS and noncartilaginous soft tissues;and those that appeared to represent cartilage. The lower threshold for cartilage was chosen, so that >95% of the voxels with a given intensity over the threshold werepredicted to belong to the cartilage distribution. The upper threshold was chosen visually to exclude voxels that were unambiguously occupied by diaphyseal cortical bone. The resulting binary, subtracted image was used as a 3D map of the locations of cartilage. To quantify the morphology of the cartilaginous soft callus in a manner that parallels standard histomorphometric analyses, a set of 15 transverse images, spaced 250 μm apart and collectively spanning the distance from 1750 μm proximal to 1750 μmdistal to the center of the fracture gap was identified from the 3D image set. For eachofthese 2D images, the callus area (C.Ar) (Gerstenfeld et al.,2005, 2006), the area labeled as cartilage by the contrast agent (Cg.Ar), and the percentage of the callus area labeled as cartilage(Cg.Ar/C.Ar × 100) were calculated.
Fifteen pre-incubation images were also analyzed for mineralized tissue. These 15 images were selected to correspond as closely as possible to the 15 images that were analyzed for callus area and cartilage area. The area of the newly mineralized tissue and the tissuemineral density (TMD) were determined according to previously published methods (Morgan et al., 2009). The newly mineralized tissue in the callus was identified first by manually delineating the periosteal and endosteal surfacesof the original cortex such that the cortex was excluded from analysis. A lower thresholdfor the remaining tissue was set at 45% of the attenuation value of the cortex (Morgan et al., 2009). The area of newly mineralized tissue (Md.Ar-Ct.Ar) was then computed from the number of voxels above the threshold and outside the periosteal and endosteal surfaces of the cortex. The tissue mineral density was calculated as the average mineral density of those voxels, using density calibration data obtained from scans of a hydroxyapatite (HA) phantom provided by the manufacturer of the μCT system. The area of mineralized tissue was divided by the previously measured callus area to determine the percentage of the callus area occupied by mineralized callus tissue ((Md.Ar-Ct.Ar)/C.Ar × 100). The percentage of mineralized tissue and percentage of cartilage at each location were then multiplied to compute the endochondral ossification index (Cg.Ar/C.Ar × (Md.Ar-Ct.Ar)/C.Ar × 1002) (Manigrasso and O'Connor, 2008).
Histomorphometry
Histological sections generated, but not stained and analyzed, in a previous study (Jepsen et al., 2008) were used to measure callus area, cartilage area, and cortex area. Three B6 and three C3H calluses from closed stabilized fractures harvested at POD 10 were available for analysis. The slides were stained with Safranin-O and Fast Green to distinguish the cartilage from the other tissues. The boundaries of the callus and the cortex were determined manually with Image-Pro (Image Pro, Media Cybernetics, Bethesda, MD), and the cartilage was identified with the Photoshop Color Select Tool (Adobe Photoshop, Adobe Systems, San Jose, CA) on 17 slides per callus spaced 250 μm apart.
Statistics
Callus area, area occupied by cartilage, area occupied by mineralized tissue, the percentages of the callus area occupied by cartilage and mineralized tissue, the endochondral ossification index, and the tissue mineral density were each compared between strains via anonparametric, repeated measures ANOVA that accounted for the use of data from 15 locations in each callus. Post hoc comparisons were performed using Wilcoxon tests with the significance level adjusted according to the Bonferroni correction such that the experiment-wise Type I error rate was maintained at 5%. This adjustment resulted in a significance level of 0.0033 for the comparisons between the two strains at each location. The ANOVAs and post hoc comparisons were performed for both the CECT and the histomorphometricmeasurements separately. Linear correlation analyses were conducted to compare the meancallus areas, cartilage areas, and percentages of cartilage as measured by histomorphometryvs. CECT for each genetic strain, by pairing the data from the two methods at each location along the length of the fracture callus.
Results
The CECT analyses indicated that the size of the cartilaginous soft callus was greatest adjacent to the fracture gap and tapered off proximally and distally (Figs. 2 and 3). A near absence of cartilage within the fracture gap itself was noted, and bone formation was observed at theproximal and distal margins of the callus and in the medullary canal. Cartilage appeared both as large aggregates and as diffuse collections of smaller regions that were interspersed with spicules of mineralized tissue (Fig. 2). In the post-incubation images, the boundaries of the soft callus were apparent, and some spatial variation in the attenuation values within regions identified as cartilaginous tissue was noted (Fig. 4).
Fig. 2.
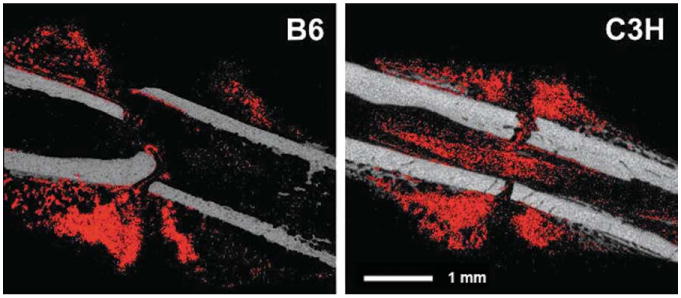
Representative, sagittal cross-sections of B6 and C3H fracture calluses: the pre-incubation image is shown in grey and the binarized subtracted image (regions identified as cartilage) is overlaid in red. [Color figure can be viewed in the online issue, which is available at wileyonlinelibrary.com.]
Fig. 3.
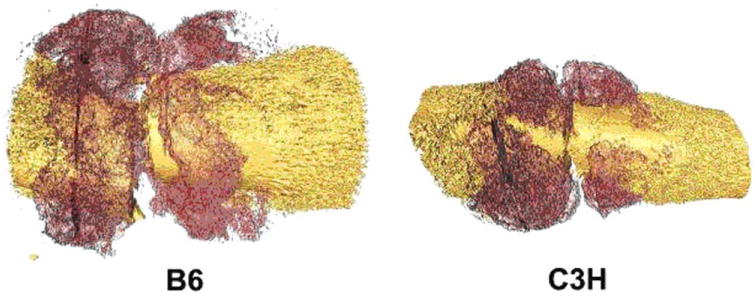
Representative 3-D reconstructions: bone tissue is shown in yellow and the regions identified as cartilage are shown in maroon. [Color figure can be viewed in the online issue, which is available at wileyonlinelibrary. com.]
Fig. 4.
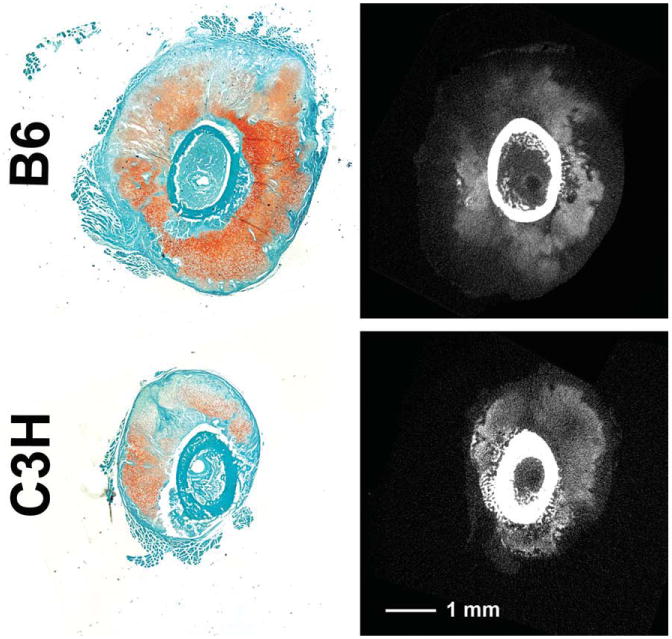
Histology of POD10 fracture calluses from a previous study (Jepsen et al., 2008) is compared to post-incubation tomograms. The histological sections (left column) were stained with Fast Green and Safranin-O, the latter coloring areas with higher GAG concentrations a darker red. In the tomograms (right column), regions of higher concentrations of GAGs would be expected to be those that are light gray (cortex and other mineralized tissue appear as white or nearly white). The presence of the contrast agent also enables clear visualization of the boundaries of the soft callus. [Color figure can be viewed in the online issue, which is available at wileyonlinelibrary.com.]
For the CECT measurements, no differences in cartilage area were found between strains (P = 0.75) (Table 1). However, cartilage area expressed as a percentage of the callus area was greater in the C3H than in the B6 calluses when all 15 locations were considered together (P = 0.03), and post hoc tests indicated a strong trend toward higher cartilage percentage in the C3H vs. B6 calluses at one location just distal to the fracture gap (Fig. 5A). In contrast, the total callusarea and mineralized tissue area were greater in the B6 than in the C3H calluses when alllocations were considered together (P < 0.001 and P = 0.002, respectively), and trends toward greater callus area and greater area ofmineralized tissue in the B6 calluses were found at multiple locations (Figs. 5B and 5C). A trend towardhigher tissue mineral density in the C3H as compared to B6 calluses was also found at thethree most proximal locations (Fig. 5D). No differences were found between strains in the percentage of callus area occupied by mineralized tissue and the endochondral ossification index (P > 0.28).
Table 1. Average values ± standard deviations of each CECT measure for each genetic strain.
| B6 | C3H | |
|---|---|---|
| Callus area (mm2) | 14.76 ± 2.29 | 8.50 ± 1.09 |
| Cartilage area (mm2) | 1.22 ± 0.71 | 1.07 ± 0.48 |
| Percent cartilage (%) | 8.12 ± 4.79 | 11.54 ± 4.64 |
| Mineralized tissue area (mm2) | 0.52 ± 0.19 | 0.29 ± 0.11 |
| Percent mineralized tissue (%) | 3.75 ± 1.65 | 4.25 ± 1.82 |
| Endochondral ossification index (% × %) | 26.38 ± 19.39 | 30.73 ± 16.96 |
| Tissue mineral density (mg HA/ccm) | 920 ± 40 | 940 ± 60 |
Values that were greater (P < 0.05) in one strain as compared to the other are in bold-face font.
Fig. 5.
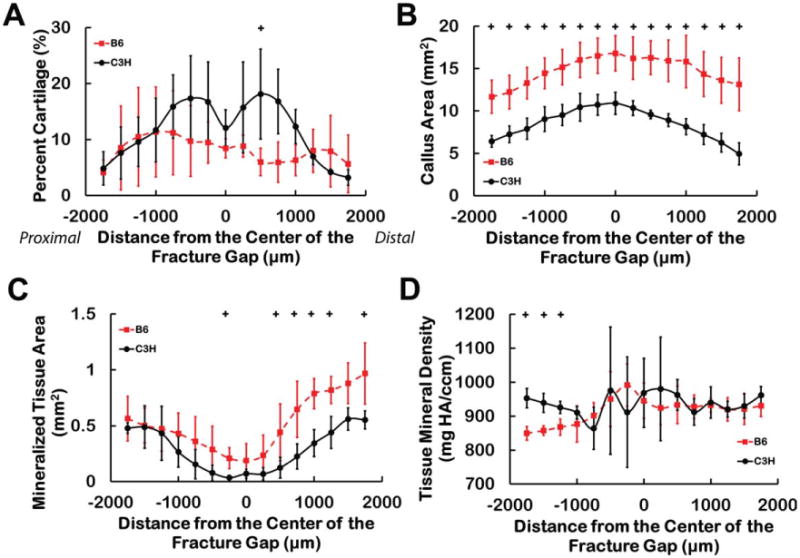
The quantitative analysis technique reveals differences in the distribution of cartilage and newly mineralized tissue in the fracture calluses. For the percentage of callus area labeled as cartilage (A), the transverse cross-sectional area of the callus (B), the area occupied by mineralized tissue (C), and the tissue mineral density of the new bone (D), trends toward differences between the B6 and C3H calluses were found at certain locations along the longitudinal axis of the callus: + 0.0033 < P < 0.0066. [Color figure can be viewed in the online issue, which is available at wileyonlinelibrary.com.]
No significant differences were found between the two strains in histomorphometric measurements of callus area, cartilage area, or the percentage of cartilage (P > 0.30), though the statistical power was low (<0.17) due to the small number of calluses that were available for analysis. Interestingly, however, the histological measurement of callus area at each location along the fracture callus was strongly correlated with the corresponding CECT measurement of callus area for both strains (P < 0.001, r ≥ 0.85) (Fig. 6). This type of correlation was also found for cartilage area and the percentage of cartilage in the C3H calluses (P < 0.001, r > 0.88) but not in the B6 calluses (P > 0.45) (Fig. 6).
Fig. 6.
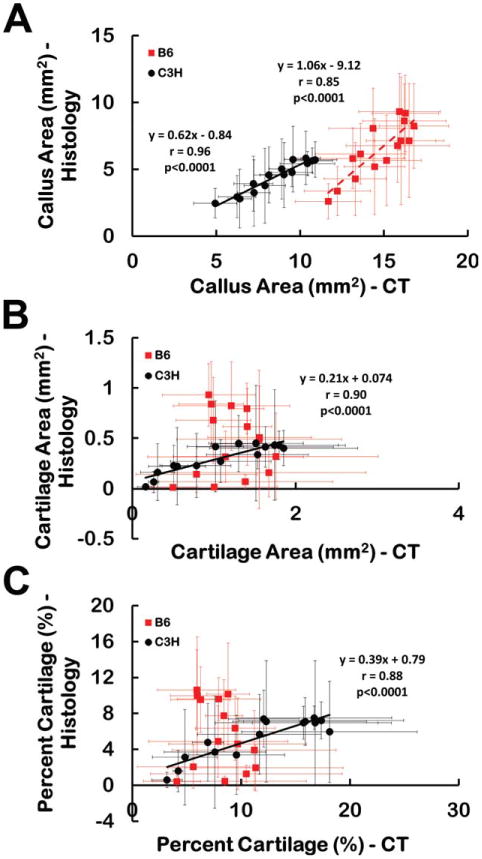
(A) Callus area, (B) cartilage area, and (C) percentage of the callus identified as cartilage as measured by CECT and histomorphometry at each location. Each data point corresponds to a particular location along the length of the callus, though the CECT and histomorphometry were performed on two different cohorts of specimens. The data point represents the mean, and the error bar one standard deviation. The areas of the callus measured by the two methods were strongly correlated for both strains. The areas of cartilage and percentage of cartilage measured by the two methods were strongly correlated for the C3H fracture calluses but were not correlated for the B6 fracture calluses. [Color figure can be viewed in the online issue, which is available at wileyonlinelibrary.com.]
Discussion
This study used the cationic contrast agent CA4+ and micro-computed tomography to create a quantitative 3D map of the cartilage in fracture calluses from two strains of mice. The overall morphology of the soft callus that was identified through the contrast-enhanced CT technique matched that previously described in the literature. Matching features included the maximum cartilage diameter immediately adjacent to the fracture gap (Einhorn, 1998; Gerstenfeld et al., 2006), tapering of the diameter of the soft callus proximally and distally (Gerstenfeld et al., 2006), and a relative paucity of cartilage along the gap line (Manigrasso and O'Connor, 2004, 2008). In addition, the contrast-enhanced CT technique allowed complementary, quantitative assessment of the mineralized tissue, and revealed the 3D, respective locations of cartilage and mineralized tissue within the callus via nondestructive means.
The spatially heterogeneous distribution of CA4+ within the cartilaginous regionsof the callus is qualitatively consistent with the nonuniform intensity of Safranin O staining that has been observed previously in fracture calluses (Jepsen et al., 2008). This agreement suggests that the contrast agent may permit not only labeling of cartilage in fracture calluses but also quantification of the GAG content within the regions of cartilage. This type of quantitative visualization, together with the relative ease with which the boundary of the soft callus could be identifiedin the presence of the contrast agent, suggests that use of contrast-enhanced CT could provide a comparably rapid alterative to standard histological assessments of callus area, cartilage area, and the area of mineralized tissue.
Significant differences were found between the B6 and C3H strains in callus area, the area of mineralized tissue, and the percentage of the callus occupied by cartilage. C3H calluses had smaller callus areas with the regions of cartilage concentrated in a narrower span around the fracture line (Figs. 2 and 3). This finding is in close agreement with a prior study that performed standard histological and μCT assessments of C3H and B6 fracture calluses at later time points (Jepsen et al., 2008). Thepresent data therefore suggest that these differences in callus size and composition are present at an earlier time point than has previously been investigated. The prior study also found the C3H calluses to have significantly higher TMD than the B6 calluses at 21 days post-fracture, and this result is consistent with the present finding of trends toward greater TMD in the C3H calluses (Fig. 5D), particularly considering that the Bonferroni correction used in the present study is known to be conservative for large numbers of comparisons. A second study in the literature also performed histomorphometric assessments of fracture calluses in C3H and B6 mice but, in contrast to our results, found at post-operative day 10 no difference between strains in the percentage of cartilage and a greater percentage of mineralized tissue and a higher endochondral ossification index in the B6 calluses (Manigrasso and O'Connor, 2008). We believe that the differences in these results as compared to ours are likely due to the fact that the prior study analyzed only one sagittal cross section for each specimen. Analysis of multiple, transverse cross sections has been shown to provide more representative, statistically robust characterization of callus composition and structure (Gerstenfeld et al., 2005). The contradictory results may also be a result of the differences in animal age between the two studies.
Although the small sample size of the histomorphometry performed in this study prevented the measurement of any differences between the strains, the correlations between the morphology of the fracture calluses, as measured by histomorphometric analysis and CECT, werestrong, particularly for the C3H strain. These correlations indicate that CECT can identify how the overall shapes of the callus and of the cartilaginous component of the calluschange along the length of the callus. It is unlikely that the finding of correlations is a product of systematic differences between the two cohorts of specimens—those used for the CECT measurements and those used for the histomorphometry—because bothour data and data published by others (Acker-Bicknell et al., 2009; Bouxsein et al., 2005; Price et al., 2005) indicate low amounts of inter-animal variability for each of the two strains. The lack of correlation for cartilage areas in the B6 calluses was most likely due to the greater variability of the cartilage distribution in the B6 calluses than in the C3H calluses.
It is of note that our values for the percentage of cartilage in the callus, as determined by CECT, are approximately two-fold lower than published values that were calculated by standard histomorphometric analysis (Manigrasso and O'Connor, 2008). This discrepancy may reflect methodological differences in that histomorphometric measurements of cartilage area include the area occupied by chondrocytes, whereas our contrast-enhanced CT technique would be expected to include only the area occupied by the cartilage extracellular matrix. In contrast, the histomorphometric analysis carried out in this study also identified only the extracellular matrix and resulted in lower areas and percentages of tissue identified as cartilage than the CECT and the standard histomorphometric analysis. Collectively, these findings suggest that in addition to variability due to labeling technique, factors such as shrinkage of the tissues during the decalcification and dehydration steps in the histological processing may contribute to the differences in values of the morphometric parameters.
This study is a preliminary investigation of CECT imaging of the soft callus, and additional studies are required to evaluate these methods fully. Principally, the lack of histological assessment on the same calluses that were imaged with CECT is a limitation of this study. Paired comparisons of CECT and histology results are necessary to test the sensitivity and specificity of CA4+ for labeling cartilage in fracture calluses. Additionally, the physical stress induced during incubation in the ultrasound chamber likely contributed to the deformation of the calluses between the pre- and post-incubation scans which inhibited accurate image registration. Our subsequent trials have indicated that complete diffusion is possible without using the ultrasound field, and hence, in future studies, the ultrasound chamber will not be used. Future work will explore the optimal incubation time, paired histology–CECT comparisons, the capabilities of CECT for in vivo assessment of the soft callus, and the use of CECT at other time points during fracture healing and in other animal models of skeletal repair. Further work is also required to quantify the kinetics of contrast agent diffusion into and out of the callus.
Taken together with recent investigations of the performance of CA4+ in CT imaging of articular cartilage (Bansal et al., 2010; Stewart et al., 2010), the present results suggest that nondestructive, 3D assessment of soft callus formation is now possible. Because the CT attenuation of CA4+ correlates well with GAG content, and GAG content correlates well with elastic modulus (Bansal et al., 2010; Zhu et al., 1993), CA4+ may allow for the estimation of callus stiffness during the soft-callus and endochondral phases of healing. Additionally, the potential of CA4+ for in vivo use (Bansal et al., 2011) supports the feasibility of longitudinal studies of the morphology and composition of the soft callus in experimental investigations of fracture repair, as well as in clinical evaluations of the progression of bone healing.
Acknowledgments
Funding for this study was provided by NIH AR053353 (EFM), NIH RR021072 (EFM), NIH AR054620 (EFM), and the Coulter Foundation (MWG). The authors thank Dr. Richard Marsell for giving his time and expertise to perform the animal surgeries.
Abbreviations used
- μCT
micro-computed tomography
- CECT
contrast-enhanced computed tomography
- CT
computed tomography
- GAG
glycosaminoglycan
- HA
hydroxyapatite
- PBS
phosphate-buffered saline
- TMD
tissue mineral density
References
- Acker-Bicknell CL, Shockley KR, Horton LG, Lecka-Czernik B, Churchill GA, Rosen CJ. Strain-specific effects of rosiglita-zone on bone mass, body composition, and serum insulin-like growth factor-I. Endocrinology. 2009;150(3):1330–1340. doi: 10.1210/en.2008-0936. [DOI] [PMC free article] [PubMed] [Google Scholar]
- Bansal PN, Joshi NS, Entezari V, Grinstaff MW, Snyder BD. Contrast enhanced computed tomography can predict the glycosaminoglycan content and biomechanical properties of articular cartilage. Osteoarthritis Cartilage. 2010;18(2):184–191. doi: 10.1016/j.joca.2009.09.003. [DOI] [PubMed] [Google Scholar]
- Bansal PN, Joshi NS, Entezari V, Malone BC, Stewart RC, Snyder BD, Grinstaff MW. Cationic contrast agents improve quantification of glycosaminoglycan (GAG) content by contrast enhanced CT imaging of cartilage. J Orthop Res. 2011;29(5):704–709. doi: 10.1002/jor.21312. [DOI] [PubMed] [Google Scholar]
- Bashir A, Gray ML, Burstein D. Gd-DTPA(2-) as a measure of cartilage degradation. Magn Reson Med. 1996;36(5):665–673. doi: 10.1002/mrm.1910360504. [DOI] [PubMed] [Google Scholar]
- Bonnarens F, Einhorn TA. Production of a standard closed fracture in laboratory animal bone. J Orthop Res. 1984;2(1):97–101. doi: 10.1002/jor.1100020115. [DOI] [PubMed] [Google Scholar]
- Bouxsein ML, Myers KS, Shultz KL, Donahue LR, Rosen CJ, Beamer WG. Ovariectomy-induced bone loss varies among inbred strains of mice. J Bone Miner Res. 2005;20(7):1085–1092. doi: 10.1359/JBMR.050307. [DOI] [PubMed] [Google Scholar]
- Einhorn TA. The cell and molecular biology of fracture healing. Clin Orthop. 1998;(355 suppl):S7–S21. doi: 10.1097/00003086-199810001-00003. [DOI] [PubMed] [Google Scholar]
- Gerstenfeld LC, Cullinane DM, Barnes GL, Graves DT, Einhorn TA. Fracture healing as a post-natal developmental process: Molecular, spatial, and temporal aspects of its regulation. J Cell Biochem. 2003;88(5):873–884. doi: 10.1002/jcb.10435. [DOI] [PubMed] [Google Scholar]
- Gerstenfeld LC, Wronski TJ, Hollinger JO, Einhorn TA. Application of histomorphometric methods to the study of bone repair. J Bone Miner Res. 2005;20(10):1715–1722. doi: 10.1359/JBMR.050702. [DOI] [PubMed] [Google Scholar]
- Gerstenfeld LC, Alkhiary YM, Krall EA, Nicholls FH, Stapleton SN, Fitch JL, Bauer M, Kayal R, Graves DT, Jepsen KJ, Einhorn TA. Three-dimensional reconstruction of fracture callus morphogenesis. J Histochem Cytochem. 2006;54(11):1215–1228. doi: 10.1369/jhc.6A6959.2006. [DOI] [PubMed] [Google Scholar]
- Jepsen KJ, Price C, Silkman LJ, Nicholls FH, Nasser P, Hu B, Hadi N, Alapatt M, Stapleton SN, Kakar S, Einhorn TA, Gerstenfeld LC. Genetic variation in the patterns of skeletal progenitor cell differentiation and progression during endochondral bone formation affects the rate of fracture healing. J Bone Miner Res. 2008 doi: 10.1359/JBMR.080317. [DOI] [PMC free article] [PubMed] [Google Scholar]
- Joshi NS, Bansal PN, Stewart RC, Snyder BD, Grinstaff MW. Effect of contrast agent charge on visualization of articular cartilage using computed tomography: Exploiting electrostatic interactions for improved sensitivity. J Am Chem Soc. 2009;131(37):13234–13235. doi: 10.1021/ja9053306. [DOI] [PubMed] [Google Scholar]
- Kayal RA, Tsatsas D, Bauer MA, Allen B, Al-Sebaei MO, Kakar S, Leone CW, Morgan EF, Gerstenfeld LC, Einhorn TA, Graves DT. Diminished bone formation during diabetic fracture healing is related to the premature resorption of cartilage associated with increased osteoclast activity. J Bone Miner Res. 2007;22(4):560–568. doi: 10.1359/jbmr.070115. [DOI] [PMC free article] [PubMed] [Google Scholar]
- Manigrasso MB, O'Connor JP. Characterization of a closed femur fracture model in mice. J Orthop Trauma. 2004;18(10):687–695. doi: 10.1097/00005131-200411000-00006. [DOI] [PubMed] [Google Scholar]
- Manigrasso MB, O'Connor JP. Comparison of fracture healing among different inbred mouse strains. Calcif Tissue Int. 2008;82(6):465–474. doi: 10.1007/s00223-008-9144-3. [DOI] [PubMed] [Google Scholar]
- Morgan EF, Mason ZD, Chien KB, Pfeiffer AJ, Barnes GL, Einhorn TA, Gerstenfeld LC. Micro-computed tomography assessment of fracture healing: Relationships among callus structure, composition, and mechanical function. Bone. 2009;44(2):335–344. doi: 10.1016/j.bone.2008.10.039. [DOI] [PMC free article] [PubMed] [Google Scholar]
- Palmer AW, Guldberg RE, Levenston ME. Analysis of cartilage matrix fixed charge density and three-dimensional morphology via contrast-enhanced microcomputed tomography. Proc Natl Acad Sci USA. 2006;103(51):19255–19260. doi: 10.1073/pnas.0606406103. [DOI] [PMC free article] [PubMed] [Google Scholar]
- Price C, Herman BC, Lufkin T, Goldman HM, Jepsen KJ. Genetic variation in bone growth patterns defines adult mouse bone fragility. J Bone Miner Res. 2005;20(11):1983–1991. doi: 10.1359/JBMR.050707. [DOI] [PubMed] [Google Scholar]
- Scammell BE, Roach HI. A new role for the chondrocyte in fracture repair: Endochondral ossification includes direct bone formation by former chondrocytes. J Bone Miner Res. 1996;11(6):737–745. doi: 10.1002/jbmr.5650110604. [DOI] [PubMed] [Google Scholar]
- Stewart RC, Bansal PN, Joshi NS, Shah SS, Snyder BD, Grinstaff MW. 56th Annual Meeting of the Orthopaedic Research Society: Poster No 855. 2010. The effect of cationic contrast agent concentration on GAG quantification using computed tomography. [Google Scholar]
- White AAr, Panjabi MM, Southwick WO. The four biomechanical stages of fracture repair. J Bone Joint Surg Am. 1977;59(2):188–192. [PubMed] [Google Scholar]
- Williams A, Gillis A, McKenzie C, Po B, Sharma L, Micheli L, Mckeon B, Burstein D. Glycosaminoglycan distribution in cartilage as determined by delayed gadolinium-enhanced MRI of cartilage (dGEMRIC): Potential clinical applications. AJR Am J Roentgenol. 2004;182(1):167–172. doi: 10.2214/ajr.182.1.1820167. [DOI] [PubMed] [Google Scholar]
- Xie L, Lin ASP, Levenston ME, Guldberg RE. Quantitative assessment of articular cartilage morphology via EPIC-microCT. Osteoarthritis Cartilage. 2009;17(3):313–320. doi: 10.1016/j.joca.2008.07.015. [DOI] [PMC free article] [PubMed] [Google Scholar]
- Zhu W, Mow VC, Koob TJ, Eyre DR. Viscoelastic shear properties of articular cartilage and the effects of glycosidase treatments. J Orthop Res. 1993;11(6):771–781. doi: 10.1002/jor.1100110602. [DOI] [PubMed] [Google Scholar]


