

Abstract
Recent discoveries characterizing the molecular basis of lung cancer brought fundamental changes in lung cancer treatment. The authors review the molecular pathogenesis of lung cancer, including genomic abnormalities, targeted therapies, and resistance mechanisms, and discuss lung cancer imaging with novel techniques. Knowledge of the molecular basis of lung cancer is essential for radiologists to properly interpret imaging and assess response to therapy. Quantitative and functional imaging helps assessing the biologic behavior of lung cancer.
Keywords: Lung cancer, targeted therapy, computed tomography, dynamic-contrast-enhanced magnetic resonance imaging, positron emission tomography
Lung cancer remains the leading cause of cancer deaths for both men and women in the United States and worldwide, accounting for 30% of estimated cancer deaths in men and 26% of estimated cancer deaths in women in the United States in 2009 (Fig 1) (1,2). In addition, the mortality rate of lung cancer is much higher than that of other top three causes of cancer death, including breast, prostate, and colon cancer (Fig 2) (1,2). Eighty-five percent of patients with lung cancer have non-small-cell lung cancer (NSCLC), for which the 5-year survival rate is only 15% (1). Two thirds of patients with NSCLC present with advanced disease and are considered incurable by surgery or radiotherapy. Platinum-based doublet chemotherapy, the standard of care for these patients, is also marginally effective. It has been clear in the past decades that more effective systemic therapy is needed for patients with advanced lung cancer (3,4).
Figure 1.
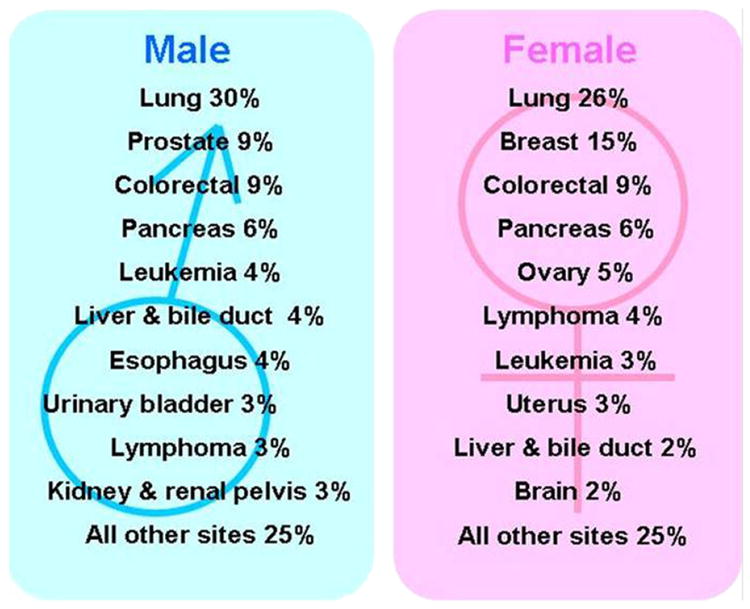
Estimated cancer deaths in women in the United States in 2009. Modified from American Cancer Society (2).
Figure 2.
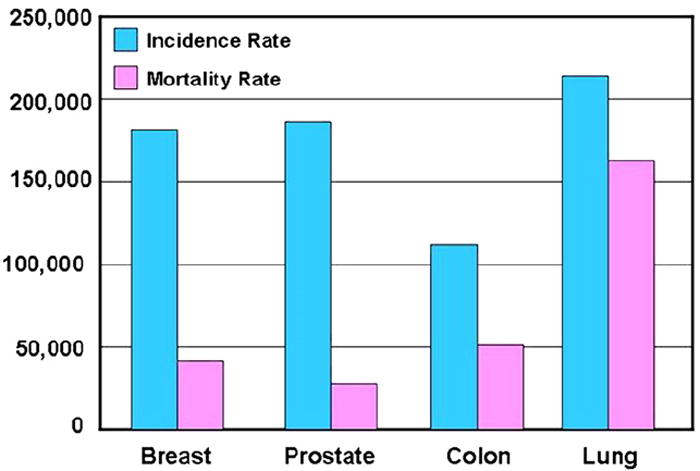
Incidence and mortality rates for four leading causes of cancer death. Modified from American Cancer Society (2).
Recent advances in molecular biology have elucidated the different molecular mechanisms of lung cancer development and progression. Some of these genetic abnormalities are specific to lung cancer, while others are present in other cancers. One of the major discoveries was the identification of somatic activating mutations of the epidermal growth factor receptor (EGFR) tyrosine kinase domain in NSCLC. The somatic mutations of EGFR are associated with a dramatic clinical response to the EGFR tyrosine kinase inhibitors (TKIs) gefitinib and erlotinib (5-7). The discovery of EGFR mutations and the clinical application of this finding for the selection of therapy have transformed the way oncologists approach lung cancer and plan treatment. It is also a pragmatic example of the contributions that advances in basic molecular research have made to patient care in clinical oncology. As radiologists involved in imaging of patients with lung cancer, we should be familiar with these molecular bases of determining therapies and applications that our oncology colleagues are using. Radiologists should become familiar with the molecular background of lung cancer and its new molecular-targeted treatment approach, to properly validate, use, and apply our advanced imaging technology to diagnose, assess response, and define progressive disease. This will help radiologists contribute in a clinically significant manner as cancer imaging specialists to the management and further progress of care for patients with lung cancer.
In this review article, we describe different molecular mechanisms of the pathogenesis of lung cancer, initially focusing on EGFR mutations in NSCLC, their therapeutic application, and current challenges. The role of histology in lung cancer assessment in current clinical oncology is also discussed. We present information on different imaging approaches to lung cancer, including conventional response assessment methods and their limitations, newer quantitative and functional imaging with multi–detector row computed tomographic (CT) imaging, dynamic contrast-enhanced (DCE) magnetic resonance imaging (MRI), and combined positron emission tomographic (PET) and CT imaging. The current status of these advanced imaging techniques in lung cancer is described, their current challenges are outlined, and future directions are proposed.
MOLECULAR MECHANISMS OF LUNG CANCER
EGFR Mutation and Its Inhibitors in NSCLC
The EGFR is a transmembrane tyrosine kinase receptor involved in signaling pathways of cells, and it regulates important tumorigenic processes, including proliferation, apoptosis, angiogenesis, and invasion (Fig 3) (8,9). Overexpression of EGFR is frequently noted in the development and progression of NSCLC, and its presence is associated with shortened survival (10-13). To specifically target this EGFR pathway in NSCLC, small-molecule inhibitors of the tyrosine kinase domain of EGFR were developed, and erlotinib and gefitinib have been approved for therapy of patients with advanced NSCLC in different parts of the world (14-16). Subsequently, activating EGFR mutations were discovered in cancer cells from patients with NSCLC who responded to the targeted therapy with gefitinib and erlotinib (5-7).
Figure 3.
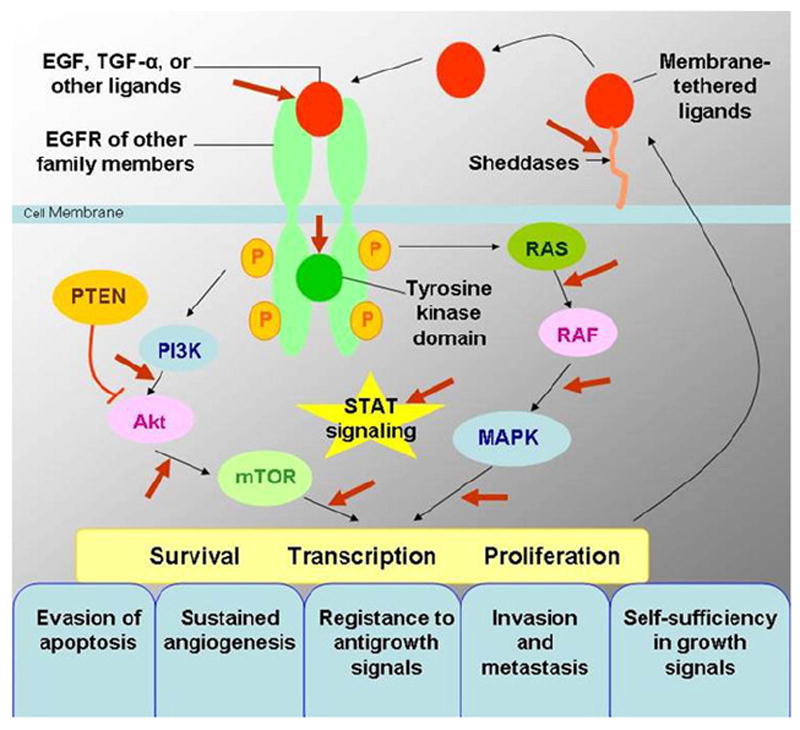
Epidermal growth factor receptor (EGFR) signaling pathways and development of cancer. EGFR signaling pathways regulate important tumorigenic processes, including proliferation, apoptosis, angiogenesis, and invasion. Modified from N Engl J Med (8). EGF, epidermal growth factor; MAPK, mitogen-activated protein kinase; mTOR, mammalian target of rapamycin; PI3K, phosphatidylinositol 3-kinase; PTEN, phosphatase and tensin homologue; RAS, rat sarcoma; STAT, signal transducer and activator of transcription; TGF-α, transforming growth factor α.
Among subtypes of NSCLC, mutation and overexpression of EGFR are frequently observed in adenocarcinoma. EGFR mutations in lung adenocarcinomas are seen in approximately in 15% of patients in the United States and in 30% to 50% of patients in Asia (8,9). Further investigations identified that 85% of EGFR mutations are either exon 19 deletions or L858R point mutations (substitution of arginine for leucine at amino acid position 858) in exon 21 (Fig 4) (8,9).
Figure 4.
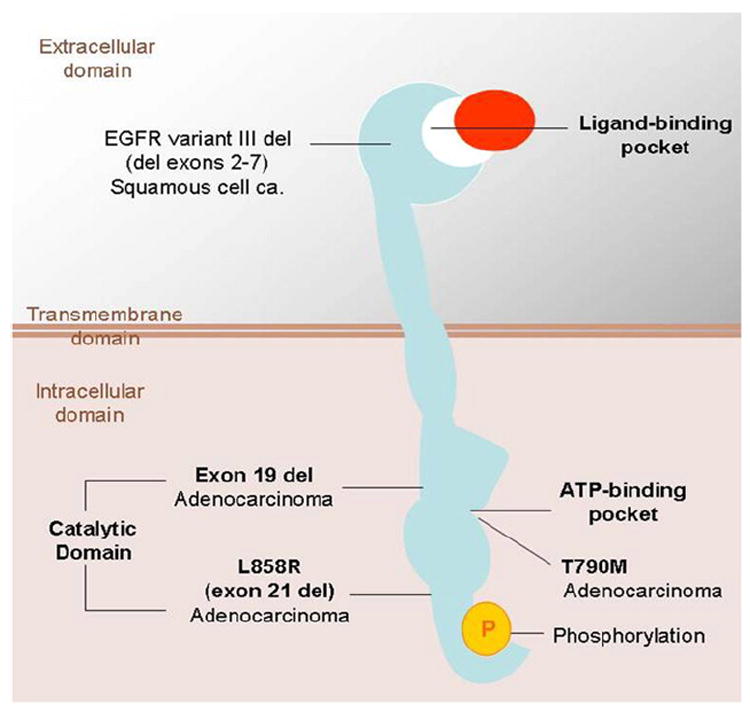
Epidermal growth factor receptor (EGFR) and its mutations in lung cancer. Note that common mutations in adenocarcinomas, exon 19 deletions, or L858R point mutation are in the intracellular catalytic domain. ATP, adenosine triphosphate; ca., carcinoma; del, deletion; L858R, substitution of arginine for leucine at amino acid position 858; T790M, substitution of methionine for threonine at amino acid position 790. Modified from N Engl J Med (9).
Sensitizing mutations in EGFR have been associated with dramatic clinical responses and prolonged time to progression in patients with NSCLC treated with the EGFR TKIs gefitinib and erlotinib (17-19). Erlotinib is an adenosine triphosphate–competitive inhibitor of EGFR tyrosine kinase and binds to the intracellular domain of the EGFR. Four single-group phase II clinical studies have shown that in patients with known EGFR mutations who received TKIs as their initial therapy, the response rates ranged from 55% to 82%, with median progression-free survival of 8.9 to 13.3 months (18,20-22). The response rate and the median progression-free survival are more favorable than those of the platinum-based chemotherapy regimens (15%–35% and 4.5–6.2 months, respectively). Patients with somatic sensitizing mutations of EGFR also have longer time to progression and survival when treated with paclitaxel and carboplatin than those given the same chemotherapy with a wild-type EGFR (22,23). Several key clinical features are known to be associated with both EGFR mutations and response to gefitinib and erlotinib, including nonsmoker status, Asian ethnicity, and female gender (Fig 5) (8,9). However, in a recent study of five clinical trials that used EGFR TKIs in chemotherapy-naive patients whose tumors were screened for EGFR and Vi-Ki-ras2 Kirsten rat sarcoma viral oncogene homolog (KRAS) mutations, Jackman et al (24) demonstrated that EGFR genotype was more effective than clinical characteristics at selecting appropriate patients for consideration of first-line therapy with an EGFR TKI. Erlotinib also appears to modestly prolong survival in virtually all clinical and histologic subgroups of patients with NSCLC (8,9,25).
Figure 5.
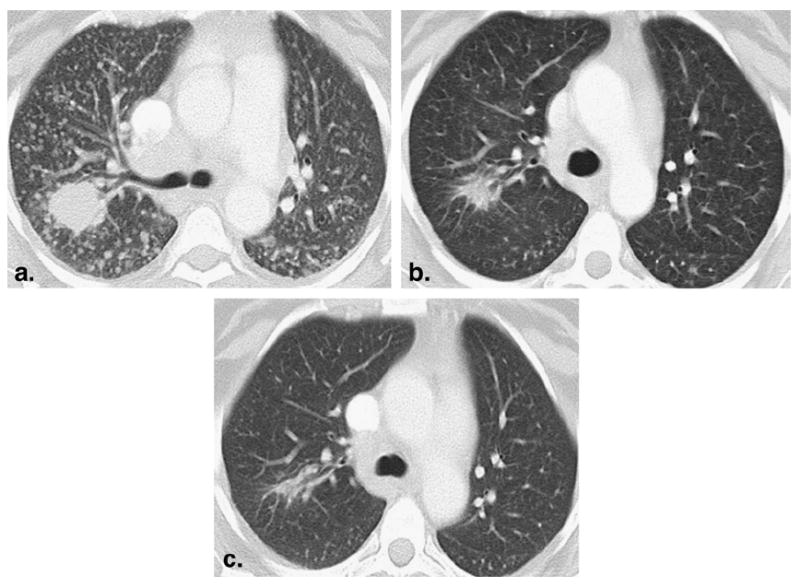
A 52-year-old female nonsmoker with lung adenocarcinoma treated with erlotinib. (a) Baseline computed tomographic scan prior to erlotinib therapy demonstrated a dominant mass in the right upper lobe with innumerable metastatic nodules. Epidermal growth factor receptor (EGFR) gene sequencing of the tumor showed EGFR mutation with exon 19 deletion. (b) After one cycle (2 months) of therapy, the mass was significantly decreased in size, and the nodules were markedly decreased in size and number, representing partial response. (c) After two cycles (4 months) of therapy, a further decrease in size of the mass was noted. The nodules had mostly resolved. The patient remained progression free after 2.5 years, with a minimal amount of residual disease at the site of the dominant mass.
Rat Sarcoma (RAS) Mutations in NSCLC
RAS is another important oncogene in lung cancer that transduces EGFR activation signal to multiple downstream pathways. Three RAS genes that are well characterized, V-Ha-ras Harvey rat sarcoma viral oncogene homolog, KRAS, and neuroblastoma rat sarcoma viral oncogene homolog, belong to a superfamily of genes encoding small monomeric guanosine-5′-triphosphate (GTP)–binding proteins (26). These RAS proteins have intrinsic GTPase activity, which switch off RAS-GTP. RAS mutations result in the inhibition of this GTPase activity and therefore lead to the constitutive activation of RAS protein, which stimulates cell growth and transforms cells from normal to a malignant phenotype (Fig 6) (27).
Figure 6.
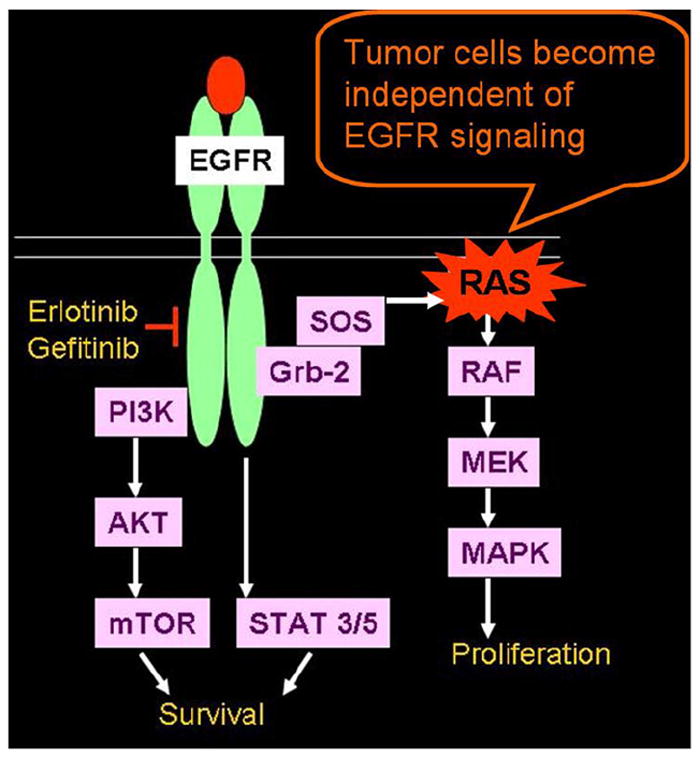
Rat sarcoma (RAS) mutation in non-small-cell lung cancer. RAS mutations result in inhibition of this guanosine-5′-triphosphate (GTP)–ase activity, which normally switches off RAS-GTP and leads to the constitutive activation of RAS protein and subsequent tumor cell proliferation. EGFR, epidermal growth factor receptor. Modified from Proc Am Thorac Soc (27). EGFR, epidermal growth factor receptor; Grb-2, growth factor receptor-bound protein 2; MAPK, mitogen-activated protein kinase; MEK, mitogen-activated protein kinase kinase; mTOR, mammalian target of rapamycin; PI3K, phosphatidylinositol 3-kinase; STAT, signal transducer and activator of transcription; SOS, son of sevenless homolog; RAS, rat sarcoma.
Activating RAS mutations in lung cancer are limited to NSCLC, mostly adenocarcinomas, and most frequently involve codon 12 of the KRAS gene (26). KRAS mutations occur in 10% to 30% of lung adenocarcinomas and are associated with poor prognosis (24). KRAS mutations are nearly always mutually exclusive of EGFR mutations and are associated with clinical resistance to EGFR TKIs, monoclonal antibodies, and chemotherapy (Fig 7). It is also known that most of the KRAS mutations are smoking related and that they are rarely found in lifelong nonsmokers (28).
Figure 7.
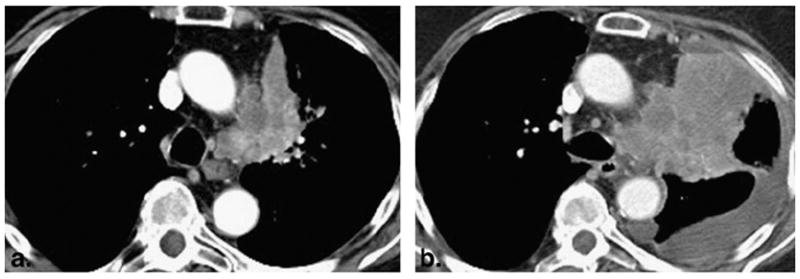
A 77-year-old woman with poorly differentiated adenocarcinoma of the lung. (a) An irregular and heterogeneous left upper lobe mass with invasion to the mediastinal fat was noted on the baseline study. (b) Follow-up computed tomographic scan of the chest after one cycle of erlotinib therapy demonstrated marked increase in size with new pleural effusion, representing progressive disease. Genomic testing of the tumor was negative for epidermal growth factor receptor mutation and positive for Vi-Ki-ras2 Kirsten rat sarcoma viral oncogene homolog mutation.
The molecular basis of NSCLC provides clinical and molecular predictors of sensitivity to the TKIs gefitinib and erlotinib to improve the correct selection of agents among the different therapeutic options to improve response rates, progression-free survival, and overall survival (Table 1) (5-7,14,15,25,29-41). Correlation between these clinical and molecular predictors and the radiologic response of tumors will help radiologists to achieve in-depth understanding of lung cancer biology and its radiologic behavior.
TABLE 1.
Predictors of Sensitivity to Erlotinib Therapy in Non-Small-Cell Lung Cancer
| Positive Predictors
| |
|---|---|
| Clinical (14,15,25,30) | Molecular |
| Nonsmoker status | EGFR mutations (exon 19 deletions, L858R point mutations) (5-7,31) |
| Asian ethnicity | EGFR gene amplification (FISH or CISH) (32,33) |
| Female gender | EGFR protein expression on immunohistochemistry (32,34) |
| Adenocarcinoma/BAC histology | MALDI-ToF algorithm (35) |
|
| |
| Negative predictors | |
|
| |
| KRAS mutations (36-38) | |
| T790M mutations (39-41) | |
| Exon 20 insertion mutations (38) | |
BAC, bronchioloalveolar cell carcinoma; CISH, chromogenic in situ hybridization; FISH, fluorescence in situ hybridization; KRAS, Vi-Ki-ras2 Kirsten rat sarcoma viral oncogene homolog; L858R, substitution of arginine for leucine at amino acid position 858; MALDI-ToF, matrix-assisted laser desorption/ionization–time of flight; T790M, substitution of methionine for threonine at amino acid position 790.
Modified from Mol Oncol Rep (29).
Acquired Resistance to Erlotinib
Although gefitinib and erlotinib provide dramatic clinical response in patients with NSCLC with EGFR mutations, the vast majority of patients with initial responses eventually develop tumor progression because of acquired resistance (9,42,43). Further investigations of acquired resistance to gefitinib and erlotinib in NSCLC have revealed at least two distinct mechanisms. A second-site acquired EGFR T790M mutation (substitution of methionine for threonine at amino acid position 790), which modifies the drug-binding pocket of EGFR, is seen in approximately 50% of the patients with acquired resistance (Fig 4) (39-41,43). The other mechanism is amplification of the tyrosine kinase receptor mesenchymal-epithelial transition factor, seen in 5% to 20% of patients, which provides redundant cell growth signaling so that the ongoing EGFR inhibition does not cause cell cycle arrest and death (Fig 8) (42,43). The preclinical characterization of erlotinib resistance mechanisms has led to even newer targeting therapies being developed in clinical trials, such as kinase inhibitors with potent activity against mesenchymal-epithelial transition factor in combination with the EGFR erlotinib to prolong progression-free survival (42,43). An accurate radiologic method for response assessment and definition of radiographic criteria for clinical are needed to define the correct time for therapy change (Fig 9).
Figure 8.
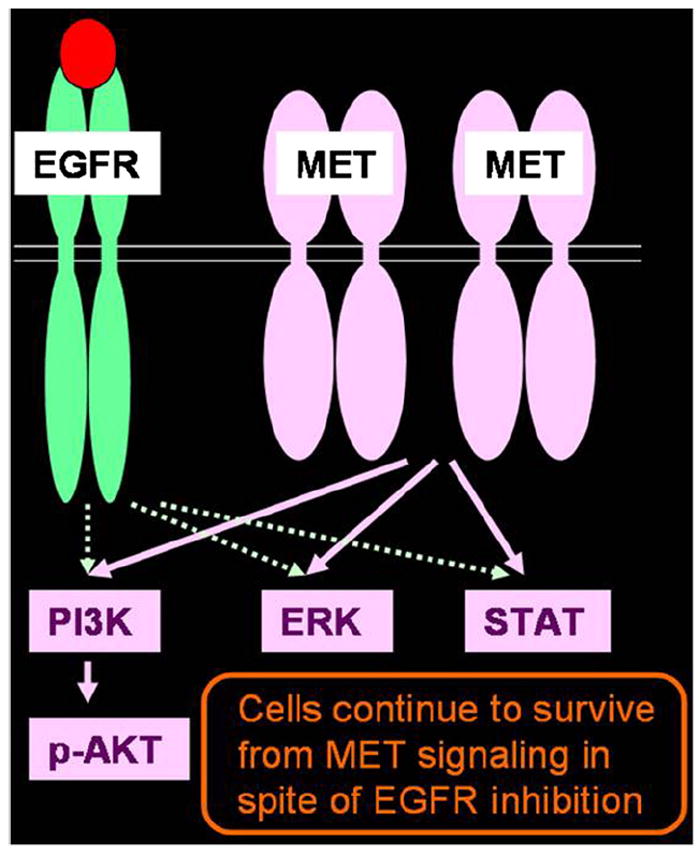
Mechanism of acquired resistance to erlotinib: mesenchymal-epithelial transition factor (MET) amplification. Amplification of MET provides redundant signaling, and tumor cells survive despite epidermal growth factor receptor (EGFR) inhibition. EGFR, epidermal growth factor receptor; ERK, extracellular-signal-regulated kinase; MET, mesenchymal-epithelial transition factor; PI3K, phosphatidylinositol 3-kinase; STAT, signal transducer and activator of transcription.
Figure 9.
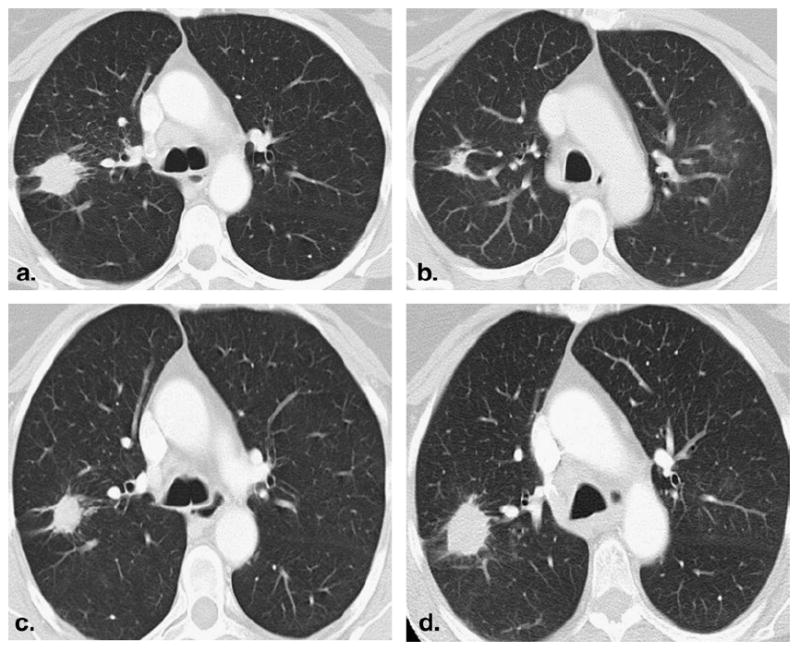
A 55-year-old lifelong female nonsmoker with advanced lung adenocarcinoma. (a) Baseline computed tomographic (CT) scan of the chest demonstrated a spiculated mass in the right upper lobe. (b) CT scan after 2 months of erlotinib therapy showed a significant decrease in size of the lesion, demonstrating response to erlotinib. (c) The patient continued on erlotinib therapy. After 38 months, a slight increase in size of the tumor was noted. However, the change in tumor size did not meet the criteria for progressive disease by the Response Evaluation Criteria in Solid Tumors (RECIST). (d) After 44 months of therapy, the size increase of the lesion met the criteria for progressive disease of RECIST. Genomic testing of the recurrent tumor showed T790M (substitution of methionine for threonine at amino acid position 790) mutation.
Jackman et al (44) recently proposed a relatively simple clinical definition of acquired resistance to TKIs in NSCLC for a more uniform approach to investigating the problems of acquired resistance. It is time for radiologists to improve and refine the imaging aspects of the criteria in collaboration with oncologists to characterize and help provide additional methods to define acquired resistance and appropriately modify therapy.
HISTOLOGY AND GENOMIC MUTATION AS MARKERS FOR THERAPY
Assessment of Lung Cancer in the New Era of Molecular Medicine
The discoveries made in the understanding of the molecular and genomic mechanisms of lung cancer dramatically changed clinicians’ approach to lung cancer. Conventionally, patients with lung cancer were simply classified into two groups, those with NSCLC and those with small-cell lung cancer, on the basis of histology. Patients with NSCLC are treated with therapeutic regimens that are fundamentally similar to those for patients with small-cell lung cancer. In the new era of evolving molecular medicine, the key component of lung cancer assessment is genomic mutation testing and genomic characterization, which identifies subsets of patients who will likely respond to a specific therapy targeting the mutation (Fig 10) (45,46).
Figure 10.
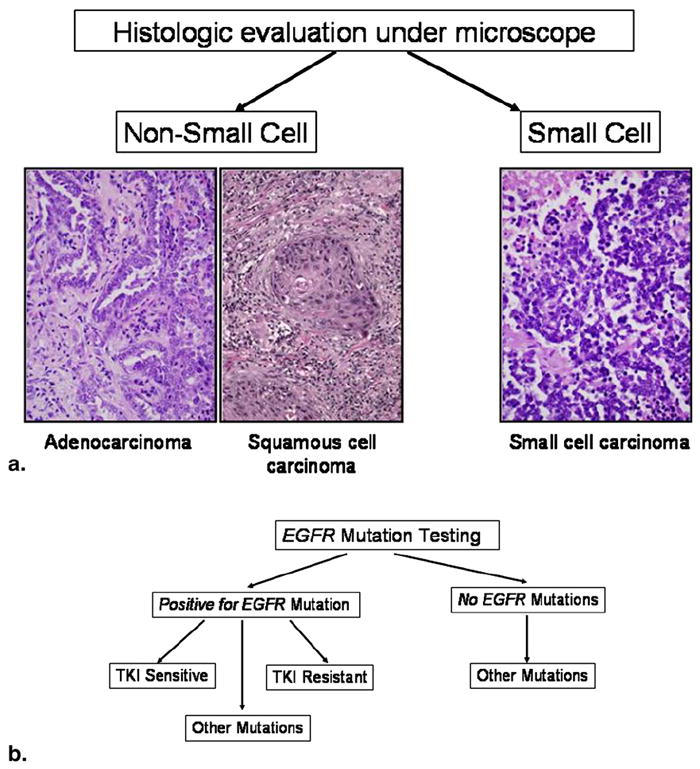
Assessment of lung cancer in the era of molecular medicine. (a) Conventional assessment was based on histology, simply dividing tumors into small-cell and non-small-cell categories. For advanced non-small-cell cancer, the therapeutic regimen was essentially the same despite various subtypes. (b) In the current era of molecular medicine, the assessment of lung cancer starts with mutation testing to determine if the patient can be treated with specific targeted therapy. EGFR, epidermal growth factor receptor; TKI, tyrosine kinase inhibitor.
Histology as a Marker for Therapy
However, histology continues to provide information needed to select different genomic testing and to select treatments. Histologic subtypes help predict the different genomic mutations and changes in lung cancer (Table 2) (47-52). One example is a study performed by Zakowski et al (53), who evaluated the histologic features of lung adenocarcinoma in patients responding and those not responding to TKI therapy (erlotinib or gefitinib). In this study, the histology in the responder group showed better differentiation, bronchioloalveolar cell carcinoma component, less heterogeneity, no necrosis, and very little solid pattern. In contrast, the histology of the tumors in the group of nonresponders demonstrated heterogeneous morphology, higher grade, and solid growth and contained more subtypes compared to that of responders (53). The investigators also noted that a mucinous variant of bronchioloalveolar cell carcinoma, which often harbors KRAS mutations, did not show clinical response to erlotinib or gefitinib. This study demonstrated that the histologic-genomic association correlated well with clinical outcome and provided insight into how morphology can contribute to lung cancer assessment and patient management in the current era of molecular medicine.
TABLE 2.
Histology and Genomic Mutations in Lung Cancer
| Histology | Genomic Mutations |
|---|---|
| Adenocarcinoma (50%) | EGFR, KRAS, TP53, STK11, CDKN2A, ERBB-2 (47) |
| Squamous cell carcinoma (20%) | SOX2 amplification (48), EGFR VIII (49) |
| Small-cell lung cancer (15%) | TP53 (50,51), RB1 (50,51), Myc gene amplification (52), nontargetable oncogene |
CDKN2A, cyclin-dependent kinase inhibitor 2A; ERBB-2, erythroblastic leukemia viral oncogene homolog 2; RB1, retinoblastoma 1; SOX2, sex-determining region Y–box 2; STK11, serine/threonine kinase 11; TP53, tumor protein 53.
Genomewide Approach to Characterize Lung Cancer Genomes
The discoveries of EGFR mutations and clinical application of the EGFR inhibitors in NSCLC have led to efforts to identify larger number of genomic mutations in lung cancer and study agents directed against these activated pathways so that more patients can be treated with target-specific therapy (54). A collaborative study by Ding et al (47) was performed to discover somatic mutations in 188 human lung adenocarcinomas. Deoxyribonucleic acid sequencing of 623 genes revealed >1,000 somatic mutations and that 26 genes were mutated at significantly high frequencies. Tumor suppressor genes known in other cancers are frequently mutated in lung adenocarcinoma as well. The investigators concluded that these findings shed further light on several important signaling pathways involved in lung adenocarcinoma and suggested new molecular targets for treatment (47,54). With extensive genome analysis and the identification of more targetable genomic abnormalities in lung cancer and the concordant development of agents directed against these changes, more patients will likely be treated by agents targeting the abnormalities specific to the tumor.
LUNG CANCER IMAGING IN ASSESSMENT OF RESPONSE TO THERAPY
Given the increasing characterization of genomic abnormalities specific to lung cancer and the development of newer therapeutic agents to target these changes, accurate radiologic assessment of response to these therapies and duration of response is crucially important. Conventional anatomy-based imaging alone does not meet all the needs of oncologists who are delivering state-of-the-art clinical care for patients with lung cancer. In this review, conventional response assessment on the basis of size measurements using the Response Evaluation Criteria in Solid Tumors (RECIST), its limitations, newer quantitative and functional imaging techniques being investigated to improve response assessment in lung cancer using multidetector CT imaging, and DCE MRI and PET/CT imaging are discussed.
Response Assessment on the Basis of Size Measurement
The conventional response assessment criteria used in patients treated for lung cancer and other solid tumors are based on size measurements, which typically include the World Health Organization (WHO) criteria and the RECIST (55-58). The WHO criteria were introduced in 1979 and use bidimensional measurements of target lesions (Fig 11) (55). RECIST, introduced in 2000 and revised in 2009, use unidimensional measurements of the longest diameters of target lesions (Fig 11) (56,57). Both the WHO criteria and RECIST assign four categories of response, including complete response, partial response, stable disease, and progressive disease (56-58). Partial response is defined as a >30% decrease by RECIST and a >50% decrease by the WHO criteria. Progressive disease is defined as a >20% increase by RECIST and a >25% increase by the WHO criteria (55). Both sets of criteria assume that tumor size changes in symmetric fashion, with tumor volume being simply related to a planar measurement, and that four discrete categories are sufficient to quantify disease response or progression in all cases (59). However, in actuality, tumors do not grow symmetrically, different portions may grow at different rates, and substantial intraobserver and interobserver variability exists in performing size measurements (59). In addition, these criteria do not incorporate the length of time over which progressive disease can take place. Given the limitations of these conventional size-based criteria, it is clear that more additional imaging methods are needed to accurately assess true change in tumor burden in response to therapy, defining when an agent is no longer effective, and accurately evaluating stable disease.
Figure 11.
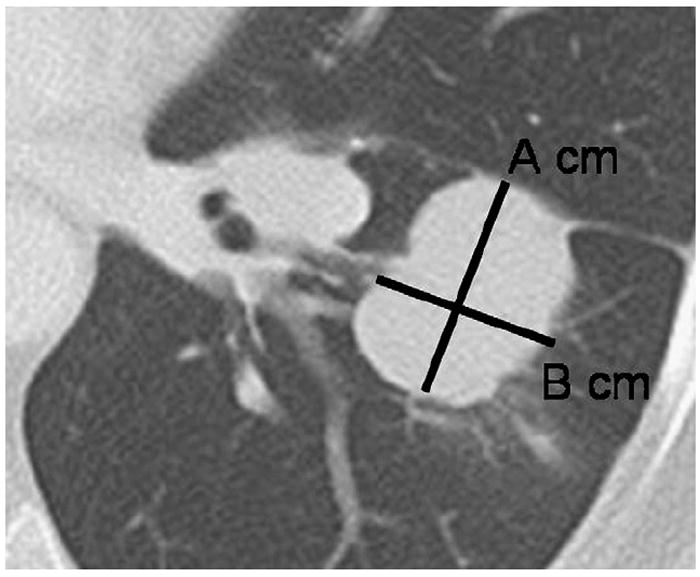
Tumor measurement by World Health Organization (WHO) criteria and Response Evaluation Criteria in Solid Tumors (RECIST). Computed tomographic scan of the chest demonstrates a lobulated mass in the left lower lobe representing lung cancer. Using the WHO criteria, the measurement for the lesion would be A × B cm2. Using RECIST, the measurement would be A cm, the longest diameter of the lesion.
Tumor Volume Measurement Using Multidetector CT Imaging
Recent rapid progress in multidetector CT technology has enabled the scanning of large anatomic volumes in a single breath-hold with isotropic voxels and high resolution (59). Three-dimensional methods for lung nodule and tumor volume measurement have been developed, aiming for more accurate and consistent tumor measurement, as well as better determination of temporal change in a shorter interval (Fig 12) (59-62). The initial application of CT volume measurement in the lung was for small lung nodules to the estimate growth rate (63,64). A recently published article from a large lung cancer screening trial used CT volume measurements to determine a volume-doubling time as a criterion for malignancy in 7,557 patients (65).
Figure 12.
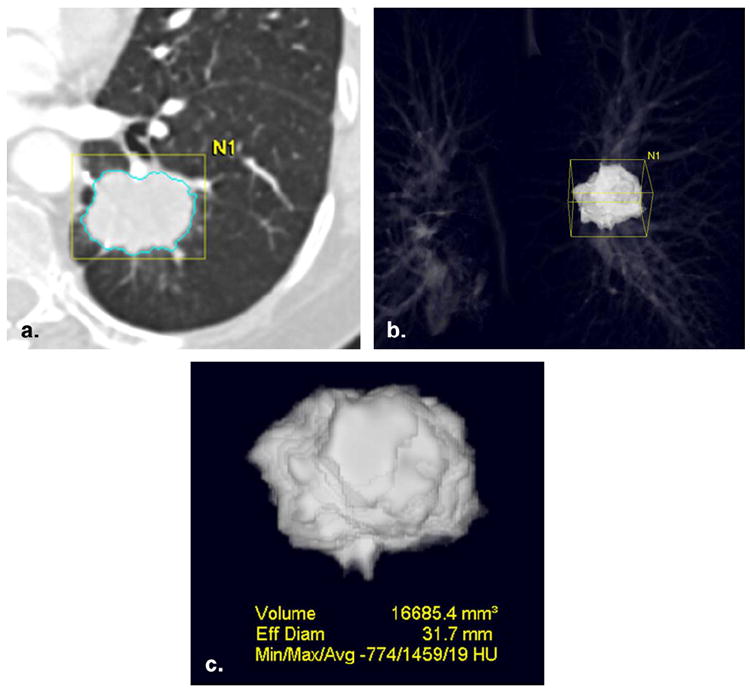
Computed tomographic (CT) volume measurement in non-small-cell lung cancer. (a) CT scan of the chest demonstrated an irregular mass in the left lower lobe. Using three-dimensional segmentation algorithm of a commercially available volume analysis software (Vitrea; Vital Images, Minnetonka, MN), the lesion was segmented from the rest of the structures. (b,c) The segmented lesion is displayed in three-dimensional manner, and the volume and CT attenuation of the tumor are obtained.
The technique has also been applied to the evaluation of lung metastasis and primary lung cancer (60,61). CT volume measurement of lung cancer before and after gefitinib therapy by Zhao et al (61) demonstrated that semiautomated tumor segmentation and volume measurement enabled the identification of a larger number of patients with absolute changes in tumor volume compared to unidimensional and bidimensional measurements. Zhao et al (62) also evaluated the reproducibility and repeatability of CT volume measurement of lung cancer using same-day repeat scans in 32 patients. CT volume measurement demonstrated high reproducibility with their own computer-assisted technique, and volume differences measured on the serial scans outside the range of −12.1% to 13.4% could be considered true changes in tumor volume (62). High reproducibility and repeatability of CT volume measurements allow radiologists to precisely evaluate small but absolute change in tumor burden. Of note, the 95% limits of agreement of volume measurement are much narrower than the cutoff values of −65% for partial response and 73% for progressive disease proposed in the original RECIST article in 2000, on the basis of a simple mathematical conversion from the diameter to a sphere (56,62). Therefore, CT volume measurements may help further differentiate patterns of response in patients who are categorized as stable disease by RECIST, particularly those patients treated with targeted therapeutic agents such as erlotinib.
As demonstrated by these studies, computer-assisted CT volume measurement is a promising tool for the precise assessment of tumor burden in lung cancer. However, further technical advances are needed to overcome some of the challenges in real life, especially in patients with advanced NSCLC. Examples of the challenges include irregular masses that need to be separated from adjacent vessels and airways (Fig 13) and cavitary lesions that can be seen either at baseline or following therapy, especially using antiangiogenic agents (66) (Fig 14). Standardization and widespread availability of the volume measurement method are also needed to establish volumetric response assessment criteria and include this method in routine clinical oncoradiology practice (57). The precise assessment of tumor volume change after therapy will contribute to further assessment of the impact of different genotypes on sensitivity to targeted therapy by using “waterfall plots,” which visually display percentage change from the baseline in each patient with the genotype, and to predict the treatment outcome early by correlating the changes in volume with the duration of response or time to progression (24).
Figure 13.
Irregular lung mass abutting vessels and bronchi. Computed tomographic scans of the chest in a patient with advanced non-small-cell lung cancer demonstrate an irregular mass closely abutting vessels and bronchi in the lung. To measure the volume of the mass, it is necessary to separate the tumor from adjacent vessels and bronchi.
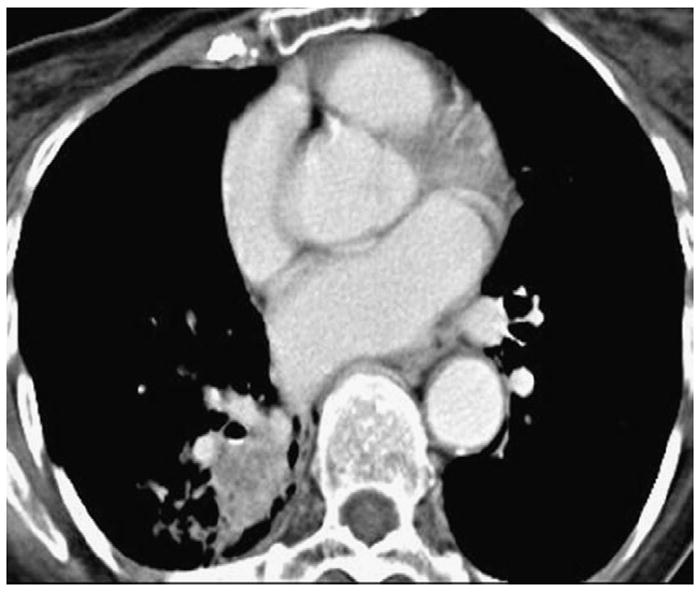
Figure 14.
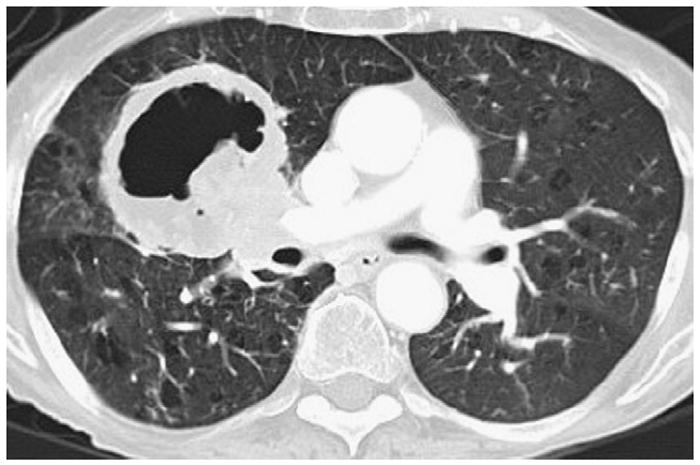
Cavitary lung lesion. Cavitation in lung lesions can be seen at the baseline or after therapy and presents significant technical challenges for volume measurement software.
DCE MRI
DCE MRI provides noninvasive assessment of tumor perfusion and vascularity, as well as quantitative pharmacokinetic parameters that are attracting attention as a potential marker for tumor genotype and phenotype, response to therapy, and prognosis in different types of cancers, including lung cancer (Fig 15) (67). DCE MRI in the lung was initially used to evaluate pulmonary perfusion, and then was applied to characterize solitary pulmonary nodules (SPNs) using a mean relative enhancement ratio, a mean slope of enhancement, or time-signal intensity curves (68-73). A few studies applied DCE MRI in the assessment of lung cancer, focusing on its value as a prognostic indicator. Fujimoto et al (74) studied the correlation between the DCE MRI parameters, tumor vascularity, and prognosis in small peripheral pulmonary carcinomas and demonstrated that the DCE MRI parameters significantly correlated with microvessel counts. Ohno et al (75) also evaluated the role of DCE MRI as a prognostic indicator in 114 patients with NSCLC treated with chemotherapy using cisplatin and vincristine. In their study, the maximum relative enhancement ratio and the slope of enhancement in the local control group were significantly lower than those in the local failure group (P < .05), and the mean survival period of the group of patients with a slope of enhancement ≤0.08/s was significantly longer than that seen in the group with a slope of enhancement >0.08/s (P < .0001) (75). These studies provide promising preliminary data for the application of DCE MRI in response assessment in lung cancer to chemotherapy and targeted therapy, and extensive investigations are under way to introduce criteria of therapy response using DCE MRI parameters.
Figure 15.
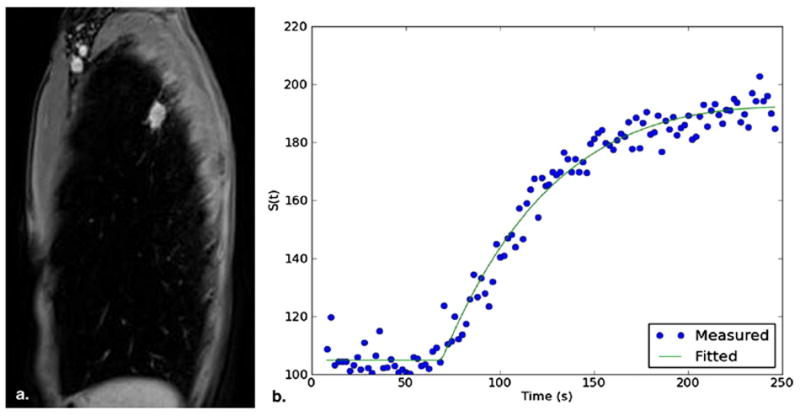
Dynamic contrast-enhanced magnetic resonance imaging of a lung nodule representing non-small-cell lung cancer. (a) Sequential images of the nodule were acquired on sagittal plane (1 image/2 s). (b) Enhancement measured on signal intensity was plotted over time as a time-intensity curve.
PET/CT Imaging
Warburg (76) first observed in 1931 that malignant tumors had an increased rate of aerobic glycolysis compared to normal tissues. Fluorine-18–fluorodeoxyglucose (FDG) is a glucose analogue that is used as a PET tracer to evaluate the glucose metabolism of lesions. FDG is taken up by metabolically active tumor cells using a facilitated transport similar to that used by glucose, and the rate of uptake of FDG by tumor cells is proportional to their metabolic activity (76,77). Quantitative parameters derived from PET studies include the standardized uptake value (SUV) and maximum SUV, which are the most widely used parameters. These values describe the ratio between the activity concentration within the tumor relative to the activity concentration in the whole body, assuming a homogenous distribution throughout the patient (78). Other aliases, such as the differential (or dose) uptake ratio and the standardized uptake ratio, are sometimes used as well (79). For the assessment of SPNs, Patz et al (80) reported that a standardized uptake ratio <2.5 on 18F-FDG PET imaging had 100% specificity for benign lesions >1.2 cm. Similar diagnostic performance in the evaluation of lesions as small as 7 mm has been reported (81). Criteria for therapeutic response assessment have also been developed in the context of functional imaging with FDG PET imaging by the European Organization for Research and Treatment of Cancer (82).
The role of 18F-FDG PET imaging in response assessment in lung cancer has been extensively studied. A review of nine clinical studies published as of July 2006 by de Geus-Oei et al (83) summarized the findings in these studies as follows: (1) a considerable reduction in SUV was associated with a pathologic response and proved to be a better predictor of long-term survival than anatomy-based criteria in patients with NSCLC who underwent neoadjuvant therapy, followed by complete resection; (2) a decrease in SUV >20% after one cycle of chemotherapy was associated with a longer time to progression and a longer median overall survival time in stage IIIB or IV NSCLC; (3) significantly longer median survival time was found in patients with complete metabolic response than in patients with incomplete metabolic response in stage IIIA-N2 disease; and (4) a larger decrease in SUV was observed in responding patients than in nonresponders on CT imaging (Fig 16). There has been increasing interest in response assessment at an early time point during therapy to predict outcome as early as possible and switch therapy if needed. Nahmias et al (84) studied the time course of early response to chemotherapy in advanced NSCLC using 18F-FDG PET/CT imaging and demonstrated that 18F-FDG PET studies performed at 1 and 3 weeks after the initiation of chemotherapy allowed prediction of the response to therapy determined by the slope of regression of metabolic activity over seven weekly PET /CT studies. It should also be noted that the initial maximum SUV measurement is particularly important to assess prognosis in patients who are undergoing neoadjuvant therapy and following surgical resection.
Figure 16.
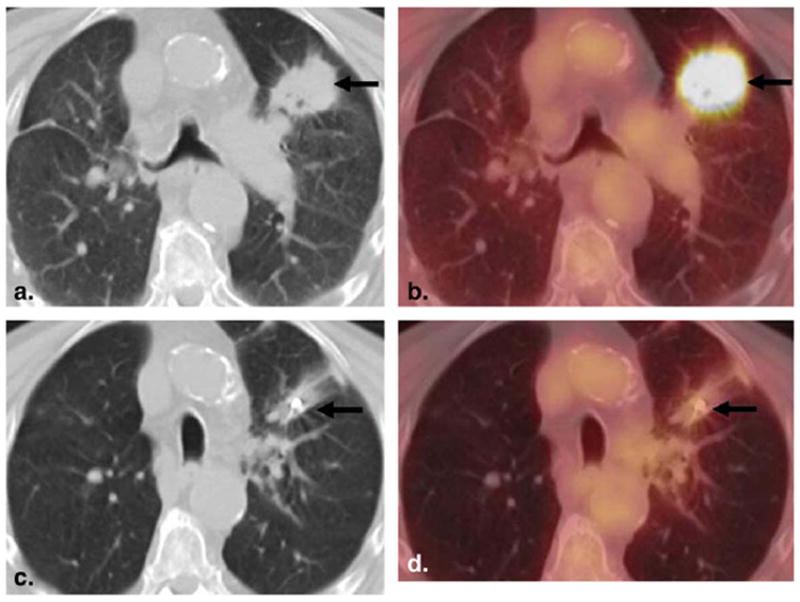
An 82-year-old man with squamous cell lung cancer. (a,b) Baseline 18F–fluorodeoxyglucose (FDG) positron emission tomographic (PET)/computed tomographic (CT) imaging demonstrated a spiculated mass in the left upper lobe with intense FDG uptake. (c,d) Follow-up 18F-FDG PET/CT imaging after CyberKnife therapy showed significant decreases in size and FDG uptake of the lesion.
To supplement the limitations of anatomic criteria of therapy response, Wahl et al (85) recently proposed a new response criteria using 18F-FDG PET imaging called PERCIST, for Positron Emission Tomography Response Criteria in Solid Tumors. PERCIST use SUV normalized to lean body mass (SUL), and response to therapy is assessed as a continuous variable and expressed as percentage change in peak SUL (or the sum of lesion SULs) between the pretreatment and posttreatment scans. The quantitative criteria proposed in PERCIST include more than a 30% and a 0.8-unit decline in peak SUL between the most intense lesion before treatment and the most intense lesion after treatment for a partial response, and more than a 30% and a 0.8-unit increase in peak SUL or new lesions, if confirmed, for progressive disease (85).
In addition to 18F-FDG, newer PET tracers are becoming available to evaluate other biologic characteristics of tumors besides glucose metabolism, such as hypoxia, apoptosis, and endocrine status (86,87). Fluoride-18-fluorothymidine (FLT) is one such PET tracer and is used for the noninvasive measurement of tumor proliferation. Evaluation of the proliferation rate of 30 SPNs by Buck et al (88) demonstrated that 18F-FLT uptake was specific for malignant lesions and that there was a significant correlation between 18F-FLT uptake and proliferative activity. Although 18F-FLT is not yet approved by the US Food and Drug Administration, 18F-FLT PET imaging may have a potential role in the evaluation of response assessment in lung cancer, particularly when the treatment approach includes inhibitors of proliferative activity such as cyclin-dependent kinase inhibitors.
Multiparametric Approach for Tumor Response Assessment
Until recently, the newer quantitative and functional imaging techniques discussed in this article have been used in isolation (89). However, given the rapidly advancing molecular and genomic discoveries in clinical cancer research, multiparametric assessment of tumors using these imaging techniques in combination is becoming more and more important (89). One of such example is the recently introduced capability to perform DCE CT imaging in combination with 18F-FDG PET imaging to assess metabolic and vascular parameters in breast cancer (90). Because DCE CT imaging has been used in the lung for the characterization of SPNs as well as treatment planning and monitoring of NSCLC (91-94), this hybrid technique of DCE CT and 18F-FDG PET imaging may be applied to lung cancer imaging in future.
Combined assessment of volume and 18F-FDG uptake by a tumor is another example of multiparametric approach, which is particularly useful when evaluating new phenomena in response to targeted therapy, because observed changes of volume and 18F-FDG uptake canvalidate each other (95). Using this approach, Riely et al (96) demonstrated that in patients with NSCLC with acquired resistance to erlotinib or gefitinib, discontinuation of erlotinib or gefitinib resulted in symptomatic progression and increases in tumor size, volume, and 18F-FDG uptake, representing the so-called flare phenomenon. Subsequent reintroduction of erlotinib or gefitinib resulted in symptomatic improvement and decreases in tumor size, volume, and 18F-FDG uptake, suggesting that some tumor cells remain sensitive to EGFR blockade (84). Combined morphologic and functional imaging incorporating changes over time will be more important as newer therapeutic agents become available.
CONCLUSIONS
Major advances have been made in the elucidation of the molecular mechanisms of lung cancer, including the discovery of EGFR mutation and its inhibitors, which lead to a new targeted therapy with dramatic clinical response. Knowledge of the molecular basis of lung cancer and its treatment is helpful for radiologists to interpret imaging studies and assess response to therapy. A multimodality imaging approach with advanced imaging technology contributes to the noninvasive in vivo characterization of lung cancer and the assessment of its behavior before, during, and after therapy.
Acknowledgments
The investigators were supported by 2009-11 Agfa Healthcare/RSNA Research Scholar Grant (M.N.), grants 1RO1CA114465-01 (B.E.J., P.A.J.) and 5R21 CA11627-02 (H.H.) from the National Institutes of Health (Bethesda, MD), grant 2P50CA090578-06 (B.E.J., P.A.J.) from the National Cancer Institute (Bethesda, MD) Specialized Program of Research Excellence in Lung Cancer, and a grant from Genentech, Inc. (South San Francisco, CA), as well as by the Doris and William Krupp Research Fund in Thoracic Oncology
References
- 1.Jemal A, Siegel R, Ward E, et al. Cancer statistics, 2009. CA Cancer J Clin. 2009;59:225–249. doi: 10.3322/caac.20006. [DOI] [PubMed] [Google Scholar]
- 2.American Cancer Society. [December 22, 2010];Cancer facts and figures. 2009 Available at: http://ww3.cancer.org/downloads/STT/500809web.pdf.
- 3.Non-Small Cell Lung Cancer Collaborative Group. Chemotherapy in non-small cell lung cancer: a meta-analysis using updated data on individual patients from 52 randomised clinical trials. BMJ. 1995;311:899–909. [PMC free article] [PubMed] [Google Scholar]
- 4.Breathnach OS, Freidlin B, Conley B, et al. Twenty-two years of phase III trials for patients with advanced non-small-cell lung cancer: sobering results. J Clin Oncol. 2001;19:1734–1742. doi: 10.1200/JCO.2001.19.6.1734. [DOI] [PubMed] [Google Scholar]
- 5.Lynch TJ, Bell DW, Sordella R, et al. Activating mutations in the epidermal growth factor receptor underlying responsiveness of non-small-cell lung cancer to gefitinib. N Engl J Med. 2004;350:2129–2139. doi: 10.1056/NEJMoa040938. [DOI] [PubMed] [Google Scholar]
- 6.Paez JG, Janne PA, Lee JC, et al. EGFR mutations in lung cancer: correlation with clinical response to gefitinib therapy. Science. 2004;304:1497–1500. doi: 10.1126/science.1099314. [DOI] [PubMed] [Google Scholar]
- 7.Pao W, Miller V, Zakowski M, et al. EGF receptor gene mutations are common in lung cancers from “never smokers” and are associated with sensitivity of tumors to gefitinib and erlotinib. Proc Natl Acad Sci USA. 2004;101:13306–13311. doi: 10.1073/pnas.0405220101. [DOI] [PMC free article] [PubMed] [Google Scholar]
- 8.Gazdar A. Personalized medicine and inhibition of EGFR signaling in lung cancer. N Engl J Med. 2009;361:1018–1020. doi: 10.1056/NEJMe0905763. [DOI] [PMC free article] [PubMed] [Google Scholar]
- 9.Herbst RS, Heymach JV, Lippman SM. Lung cancer. N Engl J Med. 2008;359:1367–1380. doi: 10.1056/NEJMra0802714. [DOI] [PMC free article] [PubMed] [Google Scholar]
- 10.Sun S, Schiller JH, Gazdar AF. Lung cancer in never smokers—a different disease. Nat Rev Cancer. 2007;7:778–790. doi: 10.1038/nrc2190. [DOI] [PubMed] [Google Scholar]
- 11.Sato M, Shames DS, Gazdar AF, et al. A translational view of the molecular pathogenesis of lung cancer. J Thorac Oncol. 2007;2:327–343. doi: 10.1097/01.JTO.0000263718.69320.4c. [DOI] [PubMed] [Google Scholar]
- 12.Brabender J, Danenberg KD, Metzger R, et al. Epidermal growth factor receptor and HER2-neu mRNA expression in non-small cell lung cancer is correlated with survival. Clin Cancer Res. 2001;7:1850–1855. [PubMed] [Google Scholar]
- 13.Rusch V, Klimstra D, Venkatraman E, et al. Overexpression of the epidermal growth factor receptor and its ligand transforming growth factor alpha is frequent in resectable non-small cell lung cancer but does not predict tumor progression. Clin Cancer Res. 1997;3:515–522. [PubMed] [Google Scholar]
- 14.Fukuoka M, Yano S, Giaccone G, et al. Multi-institutional randomized phase II trial of gefitinib for previously treated patients with advanced non-small-cell lung cancer (the IDEAL 1 trial) J Clin Oncol. 2003;21:2237–2246. doi: 10.1200/JCO.2003.10.038. published erratum appears in J Clin Oncol 2004; 22:4811. [DOI] [PubMed] [Google Scholar]
- 15.Kris MG, Natale RB, Herbst RS, et al. Efficacy of gefitinib, an inhibitor of the epidermal growth factor receptor tyrosine kinase, in symptomatic patients with non-small cell lung cancer: a randomized trial. JAMA. 2003;290:2149–2158. doi: 10.1001/jama.290.16.2149. [DOI] [PubMed] [Google Scholar]
- 16.Pérez-Soler R, Chachoua A, Hammond LA, et al. Determinants of tumor response and survival with erlotinib in patients with non–small-cell lung cancer. J Clin Oncol. 2004;22:3238–3247. doi: 10.1200/JCO.2004.11.057. [DOI] [PubMed] [Google Scholar]
- 17.van Zandwijk N, Mathy A, Boerrigter L, et al. EGFR and KRAS mutations as criteria for treatment with tyrosine kinase inhibitors: retro- and prospective observations in non-small-cell lung cancer. Ann Oncol. 2007;18:99–103. doi: 10.1093/annonc/mdl323. [DOI] [PubMed] [Google Scholar]
- 18.Sequist LV, Martins RG, Spigel D, et al. First-line gefitinib in patients with advanced non-small-cell lung cancer harboring somatic EGFR mutations. J Clin Oncol. 2008;26:2442–2449. doi: 10.1200/JCO.2007.14.8494. [DOI] [PubMed] [Google Scholar]
- 19.Jackman DM, Yeap BY, Sequist LV, et al. Exon 19 deletion mutations of epidermal growth factor receptor are associated with prolonged survival in non-small cell lung cancer patients treated with gefitinib or erlotinib. Clin Cancer Res. 2006;12:3908–3914. doi: 10.1158/1078-0432.CCR-06-0462. [DOI] [PubMed] [Google Scholar]
- 20.Inoue A, Suzuki T, Fukuhara T, et al. Prospective phase II study of gefitinib for chemotherapy-naive patients with advanced non-small-cell lung cancer with epidermal growth factor receptor gene mutations. J Clin Oncol. 2006;24:3340–3346. doi: 10.1200/JCO.2005.05.4692. [DOI] [PubMed] [Google Scholar]
- 21.Asahina H, Yamazaki K, Kinoshita I, et al. A phase II trial of gefitinib as first-line therapy for advanced non-small cell lung cancer with epidermal growth factor receptor mutations. Br J Cancer. 2006;95:998–1004. doi: 10.1038/sj.bjc.6603393. [DOI] [PMC free article] [PubMed] [Google Scholar]
- 22.Sequist LV, Settleman JE, Ackman JB, et al. Case records of the Massachusetts General Hospital. Case 23-2008. A 26-year-old man with back pain and a mass in the lung. N Engl J Med. 2008;359:405–414. doi: 10.1056/NEJMcpc0803971. [DOI] [PubMed] [Google Scholar]
- 23.Mok TS, Wu YL, Thongprasert S, et al. Gefitinib or carboplatin-paclitaxel in pulmonary adenocarcinoma. N Engl J Med. 2009;361:947–957. doi: 10.1056/NEJMoa0810699. [DOI] [PubMed] [Google Scholar]
- 24.Jackman DM, Miller VA, Cioffredi LA, et al. Impact of epidermal growth factor receptor and KRAS mutations on clinical outcomes in previously untreated non-small cell lung cancer patients: results of an online tumor registry of clinical trials. Clin Cancer Res. 2009;15:5267–5273. doi: 10.1158/1078-0432.CCR-09-0888. [DOI] [PMC free article] [PubMed] [Google Scholar]
- 25.Shepherd FA, Rodrigues Pereira J, Ciuleanu T, et al. Erlotinib in previously treated non-small-cell lung cancer. N Engl J Med. 2005;353:123–132. doi: 10.1056/NEJMoa050753. [DOI] [PubMed] [Google Scholar]
- 26.Rodenhuis S, Slebos RJ. Clinical significance of ras oncogene activation in human lung cancer. Cancer Res. 1992;52:2665s–2669s. [PubMed] [Google Scholar]
- 27.Riely GJ, Marks J, Pao W. KRAS mutations in non-small cell lung cancer. Proc Am Thorac Soc. 2009;6:201–205. doi: 10.1513/pats.200809-107LC. [DOI] [PubMed] [Google Scholar]
- 28.Jänne PA, Engelman JA, Johnson BE. Epidermal growth factor receptor mutations in non-small-cell lung cancer: implications for treatment and tumor biology. J Clin Oncol. 2005;23:3227–3234. doi: 10.1200/JCO.2005.09.985. [DOI] [PubMed] [Google Scholar]
- 29.Jackman DM. EGFR biomarkers: predicting sensitivity to therapy. Mol Oncol Rep. 2006;1:31–36. [Google Scholar]
- 30.Thatcher N, Chang A, Parikh P, et al. Gefitinib plus best supportive care in previously treated patients with refractory advanced non-small-cell lung cancer: results from a randomised, placebo-controlled, multicentre study (Iressa Survival Evaluation in Lung Cancer) Lancet. 2005;366:1527–1537. doi: 10.1016/S0140-6736(05)67625-8. [DOI] [PubMed] [Google Scholar]
- 31.Shigematsu H, Lin L, Takahashi T, et al. Clinical and biological features associated with epidermal growth factor receptor gene mutations in lung cancers. J Natl Cancer Inst. 2005;97:339–346. doi: 10.1093/jnci/dji055. [DOI] [PubMed] [Google Scholar]
- 32.Tsao MS, Sakurada A, Cutz JC, et al. Erlotinib in lung cancer—molecular and clinical predictors of outcome. N Engl J Med. 2005;353(2):133–144. doi: 10.1056/NEJMoa050736. published erratum appears in N Engl J Med 2006; 355:1746. [DOI] [PubMed] [Google Scholar]
- 33.Hirsch FR, Varella-Garcia M, McCoy J, et al. Increased epidermal growth factor receptor gene copy number detected by fluorescence in situ hybridization associates with increased sensitivity to gefitinib in patients with bronchioloalveolar carcinoma subtypes: a Southwest Oncology Group study. J Clin Oncol. 2005;23:6838–6845. doi: 10.1200/JCO.2005.01.2823. [DOI] [PubMed] [Google Scholar]
- 34.Cappuzzo F, Hirsch FR, Rossi E, et al. Epidermal growth factor receptor gene and protein and gefitinib sensitivity in non-small-cell lung cancer. J Natl Cancer Inst. 2005;97:643–655. doi: 10.1093/jnci/dji112. [DOI] [PubMed] [Google Scholar]
- 35.Solomon B, Gregorc V, Taguchi F, et al. Prediction of clinical outcome in non-small-cell lung cancer (NSCLC) patients treated with gefitinib using matrix-assisted laser desorption/ionization-time of flight mass spectrometry (MALDI-ToF) of serum. J Clin Oncol. 2006;24:7004. [Google Scholar]
- 36.Pao W, Wang TY, Riely GJ, et al. KRAS mutations and primary resistance of lung adenocarcinomas to gefitinib or erlotinib. PLoS Med. 2005;2:e17. doi: 10.1371/journal.pmed.0020017. [DOI] [PMC free article] [PubMed] [Google Scholar]
- 37.Eberhard DA, Johnson BE, Amler LC, et al. Mutations in the epidermal growth factor receptor and in KRAS are predictive and prognostic indicators in patients with non-small-cell lung cancer treated with chemotherapy alone and in combination with erlotinib. J Clin Oncol. 2005;23:5900–5909. doi: 10.1200/JCO.2005.02.857. [DOI] [PubMed] [Google Scholar]
- 38.Han SW, Kim TY, Jeon YK, et al. Optimization of patient selection for gefitinib in non-small cell lung cancer by combined analysis of epidermal growth factor receptor mutation, K-ras mutation, and Akt phosphorylation. Clin Cancer Res. 2006;12:2538–2544. doi: 10.1158/1078-0432.CCR-05-2845. [DOI] [PubMed] [Google Scholar]
- 39.Kobayashi S, Boggon TJ, Dayaram T, et al. EGFR mutation and resistance of non-small-cell lung cancer to gefitinib. N Engl J Med. 2005;24(352):786–792. doi: 10.1056/NEJMoa044238. [DOI] [PubMed] [Google Scholar]
- 40.Pao W, Miller VA, Politi KA, et al. Acquired resistance of lung adenocarcinomas to gefitinib or erlotinib is associated with a second mutation in the EGFR kinase domain. PLoS Med. 2005;2:e73. doi: 10.1371/journal.pmed.0020073. [DOI] [PMC free article] [PubMed] [Google Scholar]
- 41.Bell DW, Gore I, Okimoto RA, et al. Inherited susceptibility to lung cancer may be associated with the T790M drug resistance mutation in EGFR. Nat Genet. 2005;37:1315–1316. doi: 10.1038/ng1671. [DOI] [PubMed] [Google Scholar]
- 42.Engelman JA, Zejnullahu K, Mitsudomi T, et al. MET amplification leads to gefitinib resistance in lung cancer by activating ERBB3 signaling. Science. 2007;316:1039–1043. doi: 10.1126/science.1141478. [DOI] [PubMed] [Google Scholar]
- 43.Bean J, Brennan C, Shih JY, et al. MET amplification occurs with or without T790M mutations in EGFR mutant lung tumors with acquired resistance to gefitinib or erlotinib. Proc Natl Acad Sci U S A. 2007;104:20932–20937. doi: 10.1073/pnas.0710370104. [DOI] [PMC free article] [PubMed] [Google Scholar]
- 44.Jackman D, Pao W, Riely GJ, et al. Clinical definition of acquired resistance to epidermal growth factor receptor tyrosine kinase inhibitors in non-small-cell lung cancer. J Clin Oncol. 2010;28:357–360. doi: 10.1200/JCO.2009.24.7049. [DOI] [PMC free article] [PubMed] [Google Scholar]
- 45.McDermott U, Settleman J. Personalized cancer therapy with selective kinase inhibitors: an emerging paradigm in medical oncology. J Clin Oncol. 2009;27:5650–5659. doi: 10.1200/JCO.2009.22.9054. [DOI] [PubMed] [Google Scholar]
- 46.Rosell R, Moran T, Queralt C, et al. Screening for epidermal growth factor receptor mutations in lung cancer. N Engl J Med. 2009;361:958–967. doi: 10.1056/NEJMoa0904554. [DOI] [PubMed] [Google Scholar]
- 47.Ding L, Johnson BE, Meyerson M, et al. Somatic mutations affect key pathways in lung adenocarcinoma. Nature. 2008;455:1069–1075. doi: 10.1038/nature07423. [DOI] [PMC free article] [PubMed] [Google Scholar]
- 48.Bass AJ, Watanabe H, Mermel CH, et al. SOX2 is an amplified lineage-survival oncogene in lung and esophageal squamous cell carcinomas. Nat Genet. 2009;41:1238–1242. doi: 10.1038/ng.465. [DOI] [PMC free article] [PubMed] [Google Scholar]
- 49.Ohtsuka K, Ohnishi H, Fujiwara M, et al. Abnormalities of epidermal growth factor receptor in lung squamous-cell carcinomas, adenosquamous carcinomas, and large-cell carcinomas: tyrosine kinase domain mutations are not rare in tumors with an adenocarcinoma component. Cancer. 2007;109:741–750. doi: 10.1002/cncr.22476. [DOI] [PubMed] [Google Scholar]
- 50.Travis W, Nicholson S, Hirsch FR, et al. Pathology and Genetics. Lyon, France: IARC; 2004. Tumours of the lung. Tumours of the lung, pleura, thymus and heart World Health Organization Classification of Tumours; pp. 31–34. [Google Scholar]
- 51.Kitamura H, Yazawa T, Okudela K, et al. Molecular and genetic pathogenesis of lung cancer: differences between small-cell and non-small-cell carcinomas. Open Pathol J. 2008;2:106–114. [Google Scholar]
- 52.Kim YH, Girard L, Giacomini CP, et al. Combined microarray analysis of small cell lung cancer reveals altered apoptotic balance and distinct expression signatures of MYC family gene amplification. Oncogene. 2006;25:130–138. doi: 10.1038/sj.onc.1208997. [DOI] [PubMed] [Google Scholar]
- 53.Zakowski MF, Hussain S, Pao W, et al. Morphologic features of adenocarcinoma of the lung predictive of response to the epidermal growth factor receptor kinase inhibitors erlotinib and gefitinib. Arch Pathol Lab Med. 2009;133:470–477. doi: 10.1043/1543-2165-133.3.470. [DOI] [PMC free article] [PubMed] [Google Scholar]
- 54.Weir BA, Johnson BE, Meyerson M, et al. Characterizing the cancer genome in lung adenocarcinoma. Nature. 2007;450:893–898. doi: 10.1038/nature06358. [DOI] [PMC free article] [PubMed] [Google Scholar]
- 55.World Health Organization. [December 22, 2010];WHO Handbook for Reporting Results of Cancer Treatment. Available at: http://whqlibdoc.who.int/publications/9241700483.pdf.
- 56.Therasse P, Arbuck SG, Eisenhauer EA, et al. New guidelines to evaluate the response to treatment in solid tumors: European Organization for Research and Treatment of Cancer, National Cancer Institute of the United States, National Cancer Institute of Canada. J Natl Cancer Inst. 2000;92:205–216. doi: 10.1093/jnci/92.3.205. [DOI] [PubMed] [Google Scholar]
- 57.Eisenhauer EA, Therasse P, Bogaerts J, et al. New response evaluation criteria in solid tumors: revised RECIST guideline (version 1.1) Eur J Cancer. 2009;45:228–247. doi: 10.1016/j.ejca.2008.10.026. [DOI] [PubMed] [Google Scholar]
- 58.Suzuki C, Jacobsson H, Hatschek T, et al. Radiologic measurements of tumor response to treatment: practical approaches and limitations. Radiographics. 2008;28:329–344. doi: 10.1148/rg.282075068. [DOI] [PubMed] [Google Scholar]
- 59.Gavrielides MA, Kinnard LM, Myers KJ, et al. Noncalcified lung nodules: volumetric assessment with thoracic CT. Radiology. 2009;251:26–37. doi: 10.1148/radiol.2511071897. [DOI] [PMC free article] [PubMed] [Google Scholar]
- 60.Zhao B, Schwartz LH, Moskowitz CS, et al. Pulmonary metastases: effect of CT section thickness on measurement—initial experience. Radiology. 2005;234:934–939. doi: 10.1148/radiol.2343040020. [DOI] [PubMed] [Google Scholar]
- 61.Zhao B, Schwartz LH, Moskowitz CS, et al. Lung cancer: computerized quantification of tumor response—initial results. Radiology. 2006;241:892–898. doi: 10.1148/radiol.2413051887. [DOI] [PubMed] [Google Scholar]
- 62.Zhao B, James LP, Moskowitz CS, et al. Evaluating variability in tumor measurements from same-day repeat CT scans of patients with non-small cell lung cancer. Radiology. 2009;252:263–272. doi: 10.1148/radiol.2522081593. [DOI] [PMC free article] [PubMed] [Google Scholar]
- 63.Yankelevitz DF, Reeves AP, Kostis WJ, et al. Small pulmonary nodules: volumetrically determined growth rates based on CT evaluation. Radiology. 2000;217:251–256. doi: 10.1148/radiology.217.1.r00oc33251. [DOI] [PubMed] [Google Scholar]
- 64.Kostis WJ, Yankelevitz DF, Reeves AP, et al. Small pulmonary nodules: reproducibility of three-dimensional volumetric measurement and estimation of time to follow-up CT. Radiology. 2004;231:446–452. doi: 10.1148/radiol.2312030553. [DOI] [PubMed] [Google Scholar]
- 65.van Klaveren RJ, Oudkerk M, Prokop M, et al. Management of lung nodules detected by volume CT scanning. N Engl J Med. 2009;361:2221–2229. doi: 10.1056/NEJMoa0906085. [DOI] [PubMed] [Google Scholar]
- 66.Marom EM, Martinez CH, Truong MT, et al. Tumor cavitation during therapy with antiangiogenesis agents in patients with lung cancer. J Thorac Oncol. 2008;3:351–357. doi: 10.1097/JTO.0b013e318168c7e9. [DOI] [PubMed] [Google Scholar]
- 67.Choyke PL, Dwyer AJ, Knopp MV. Functional tumor imaging with dynamic contrast-enhanced magnetic resonance imaging. J Magn Reson Imaging. 2003;17:509–520. doi: 10.1002/jmri.10304. [DOI] [PubMed] [Google Scholar]
- 68.Hatabu H, Gaa J, Kim D, et al. Pulmonary perfusion: qualitative assessment with dynamic contrast-enhanced MRI using ultra-short TE and inversion recovery turbo FLASH. Magn Reson Med. 1996;36:503–508. doi: 10.1002/mrm.1910360402. [DOI] [PubMed] [Google Scholar]
- 69.Hatabu H, Tadamura E, Levin DL, et al. Quantitative assessment of pulmonary perfusion with dynamic contrast-enhanced MRI. Magn Reson Med. 1999;42:1033–1038. doi: 10.1002/(sici)1522-2594(199912)42:6<1033::aid-mrm7>3.0.co;2-7. [DOI] [PubMed] [Google Scholar]
- 70.Ohno Y, Hatabu H, Takenaka D, Adachi S, Kono M, Sugimura K. Solitary pulmonary nodules: potential role of dynamic MR imaging in management initial experience. Radiology. 2002;224:503–511. doi: 10.1148/radiol.2242010992. [DOI] [PubMed] [Google Scholar]
- 71.Schaefer JF, Vollmar J, Schick F, et al. Solitary pulmonary nodules: dynamic contrast-enhanced MR imaging—perfusion differences in malignant and benign lesions. Radiology. 2004;232:544–553. doi: 10.1148/radiol.2322030515. [DOI] [PubMed] [Google Scholar]
- 72.Donmez FY, Yekeler E, Saeidi V, Tunaci A, Tunaci M, Acunas G. Dynamic contrast enhancement patterns of solitary pulmonary nodules on 3D gradient-recalled echo MRI. AJR Am J Roentgenol. 2007;189:1380–1386. doi: 10.2214/AJR.07.2429. [DOI] [PubMed] [Google Scholar]
- 73.Zou Y, Zhang M, Wang Q, Shang D, Wang L, Yu G. Quantitative investigation of solitary pulmonary nodules: dynamic contrast-enhanced MRI and histopathologic analysis. AJR Am J Roentgenol. 2008;191:252–259. doi: 10.2214/AJR.07.2284. [DOI] [PubMed] [Google Scholar]
- 74.Fujimoto K, Abe T, Müller NL, et al. Small peripheral pulmonary carcinomas evaluated with dynamic MR imaging: correlation with tumor vascularity and prognosis. Radiology. 2003;227:786–793. doi: 10.1148/radiol.2273020459. [DOI] [PubMed] [Google Scholar]
- 75.Ohno Y, Nogami M, Higashino T, et al. Prognostic value of dynamic MR imaging for non-small-cell lung cancer patients after chemoradiotherapy. J Magn Reson Imaging. 2005;21:775–783. doi: 10.1002/jmri.20297. [DOI] [PubMed] [Google Scholar]
- 76.Warburg O. On the origin of cancer cells. Science. 1956;123:309–314. doi: 10.1126/science.123.3191.309. [DOI] [PubMed] [Google Scholar]
- 77.Flier JS, Mueckler MM, Usher P, et al. Elevated levels of glucose transport and transport messenger RNA are induced by ras or src oncogenes. Science. 1987;235:1492–1495. doi: 10.1126/science.3103217. [DOI] [PubMed] [Google Scholar]
- 78.Weber WA, Figlin R. Monitoring cancer treatment with PET/CT: does it make a difference? J Nucl Med. 2007;48(suppl):36S–44S. [PubMed] [Google Scholar]
- 79.Thie JA. Understanding the standardized uptake value, its methods, and implications for usage. J Nucl Med. 2004;45:1431–1434. [PubMed] [Google Scholar]
- 80.Patz EF, Lowe VJ, Hoffman JM, et al. Focal pulmonary abnormalities: evaluation with F-18 fluorodeoxyglucose PET scanning. Radiology. 1993;188:487–490. doi: 10.1148/radiology.188.2.8327702. [DOI] [PubMed] [Google Scholar]
- 81.Lowe VJ, Fletcher JW, Gobar L, et al. Prospective investigation of positron emission tomography in lung nodules. J Clin Oncol. 1998;16:1075–1084. doi: 10.1200/JCO.1998.16.3.1075. [DOI] [PubMed] [Google Scholar]
- 82.Young H, Baum R, Cremerius U, et al. European Organization for Research and Treatment of Cancer (EORTC) PET Study Group. Measurement of clinical and subclinical tumour response using [18F]-fluorodeoxyglucose and positron emission tomography: review and 1999 EORTC recommendations. Eur J Cancer. 1999;35:1773–1782. doi: 10.1016/s0959-8049(99)00229-4. [DOI] [PubMed] [Google Scholar]
- 83.de Geus-Oei LF, van der Heijden HF, Corstens FH, et al. Predictive and prognostic value of FDG-PET in nonsmall-cell lung cancer: a systematic review. Cancer. 2007;110:1654–1664. doi: 10.1002/cncr.22979. [DOI] [PubMed] [Google Scholar]
- 84.Nahmias C, Hanna WT, Wahl LM, et al. Time course of early response to chemotherapy in non-small cell lung cancer patients with 18F-FDG PET/CT. J Nucl Med. 2007;48:744–751. doi: 10.2967/jnumed.106.038513. [DOI] [PubMed] [Google Scholar]
- 85.Wahl RL, Jacene H, Kasamon Y, et al. From RECIST to PERCIST; evolving considerations for PET response criteria in solid tumors. J Nucl Med. 2009;50:122S–150S. doi: 10.2967/jnumed.108.057307. [DOI] [PMC free article] [PubMed] [Google Scholar]
- 86.Shankar LK, Sullivan DC. Functional imaging in lung cancer. J Clin Oncol. 2005;23:3203–3211. doi: 10.1200/JCO.2005.08.854. [DOI] [PubMed] [Google Scholar]
- 87.Zhao B, Schwartz LH, Larson SM. Imaging surrogates of tumor response to therapy: anatomic and functional biomarkers. J Nucl Med. 2009;50:239–249. doi: 10.2967/jnumed.108.056655. [DOI] [PubMed] [Google Scholar]
- 88.Buck AK, Schirrmeister H, Hetzel M, et al. 3-deoxy-3-[(18)F]fluorothymidine-positron emission tomography for noninvasive assessment of proliferation in pulmonary nodules. Cancer Res. 2002;62:3331–3334. [PubMed] [Google Scholar]
- 89.Padhani AR, Miles KA. Multiparametric imaging of tumor response to therapy. Radiology. 2010;256:348–364. doi: 10.1148/radiol.10091760. [DOI] [PubMed] [Google Scholar]
- 90.Groves AM, Wishart GC, Shastry M, et al. Metabolic-flow relationships in primary breast cancer: feasibility of combined PET/dynamic contrast-enhanced CT. Eur J Nucl Med Mol Imaging. 2009;36:416–421. doi: 10.1007/s00259-008-0948-1. [DOI] [PubMed] [Google Scholar]
- 91.Jeong YJ, Lee KS, Jeong SY, et al. Solitary pulmonary nodule: characterization with combined wash-in and washout features at dynamic multi-detector row CT. Radiology. 2005;237:675–683. doi: 10.1148/radiol.2372041549. [DOI] [PubMed] [Google Scholar]
- 92.Ng QS, Goh V, Milner J, et al. Quantitative helical dynamic contrast enhanced computed tomography assessment of the spatial variation in whole tumour blood volume with radiotherapy in lung cancer. Lung Cancer. 2010;69:71–76. doi: 10.1016/j.lungcan.2009.09.002. [DOI] [PubMed] [Google Scholar]
- 93.Lazanyi KS, Abramyuk A, Wolf G, et al. Usefulness of dynamic contrast enhanced computed tomography in patients with non-small-cell lung cancer scheduled for radiation therapy. Lung Cancer. 2010;70:280–285. doi: 10.1016/j.lungcan.2010.03.004. [DOI] [PubMed] [Google Scholar]
- 94.Lind JS, Meijerink MR, Dingemans AM, et al. Dynamic contrast-enhanced CT in patients treated with sorafenib and erlotinib for non-small cell lung cancer: a new method of monitoring treatment? Eur Radiol. 2010;20:2890–2898. doi: 10.1007/s00330-010-1869-5. [DOI] [PMC free article] [PubMed] [Google Scholar]
- 95.Van Oosterom AT, Dumez H, Desai J, et al. Combination signal transduction inhibition: a phase I/II trial of the oral mTOR inhibitor everolimus (E, RAD001) and imatinib mesylate (IM) in patients (pts) with gastrointestinal stromal tumor (GIST) refractory to IM. J Clin Oncol. 2004;22:3002. [Google Scholar]
- 96.Riely GJ, Kris MG, Zhao B, et al. Prospective assessment of discontinuation and reinitiation of erlotinib or gefitinib in patients with acquired resistance to erlotinib or gefitinib followed by the addition of everolimus. Clin Cancer Res. 2007;13:5150–5155. doi: 10.1158/1078-0432.CCR-07-0560. [DOI] [PubMed] [Google Scholar]