

Abstract
The soybean cyst nematode (SCN), Heterodera glycines, is the most damaging pathogen of soybean. Methods to phenotype soybean varieties for resistance to SCN are currently very laborious and time consuming. Streamlining a portion of this phenotyping process could increase productivity and accuracy. Here we report an automated method to count SCN females using a fluorescence-based imaging system that is well suited to high-throughput SCN phenotyping methods used in greenhouse screening. For optimal automated imaging, females were washed from roots at 30 days post-inoculation into small Petri dishes. Using a Kodak Image Station 4000MM Pro, the Petri dishes were scanned using excitation and emission wavelengths of 470 nm and 535 nm, respectively. Fluorescent images were captured and analyzed with Carestream Molecular Imaging Software for automated counting. We demonstrate that the automated fluorescent-based imaging system is just as accurate (r2 ≥ 0.95) and more efficient (>50% faster) than manual counting under a microscope. This method can greatly improve the consistency and turnaround of data while reducing the time and labor commitment associated with SCN female counting.
Keywords: fluorescence, Heterodera glycines, imaging, phenotyping, resistance, SCN, soybean, soybean cyst nematode
The soybean cyst nematode (SCN), Heterodera glycines Ichinohe, is a serious economic threat to soybean (Glycine max (L.) Merr.) producers. Yield suppression attributed to H. glycines resulted in an estimated $1.2 billion in losses to U.S. soybean producers annually from 2006 to 2009, causing more yield loss than any other soybean pest (Koenning and Wrather, 2010). Planting resistant soybean cultivars is the primary means to limit soybean yield suppression due to H. glycines. However, greater than 90% of commercially available soybean cultivars derive their resistance from a single genetic source, plant introduction (PI) 88788. Consequently, monoculture of a single type of resistance has led to an increase in SCN field populations virulent on PI 88788 (Mitchum et al., 2007; Hershman et al., 2008; Niblack et al., 2008). This has intensified the need for breeders to identify additional sources of resistance to broaden the genetic base of H. glycines resistance in soybean cultivars. The standard calculation for determining SCN resistance levels of soybean germplasm is the Female Index, where FI = (mean number of females on a test soybean line) / (mean number of females on the standard susceptible) × 100 (Niblack et al., 2002; 2009). Determination of resistance is then based on the FI. The FI is also used to determine the virulence profiles of genetically diverse field populations of SCN using the HG Type test (Niblack et al., 2002), to screen mapping populations for the identification and cloning of SCN resistance genes, and to evaluate mutant and transgenic soybean lines for SCN resistance or susceptibility. Thus, SCN phenotyping of soybean is a widespread practice in SCN research. Screening is typically conducted in a greenhouse in containers with volumes between 100 and 500 cm3 to accommodate growth of a 30-day-old soybean plant (Niblack et al., 2002). The traditional SCN phenotyping method employs manual counting of SCN females washed from roots at 30 days post-inoculation (dpi) under a microscope (Niblack et al., 2002; 2009). Manual counting is a labor intensive, time consuming, and cumbersome process. In addition, the small size and varied color of SCN females mixed with fragments of root debris requires a trained eye for accurate counting. Thus, counting discrepancies among individuals is a common contributing factor to experimental variability.
In recent years, fluorescence-based counting methods have been explored (Lu et al., 2005). The imaging system developed by Pioneer Hi-Bred International, Inc and described by Lu et al (2005) employs an enclosed lighting system equipped with a camera attached to a computer. The system was optimized for imaging individual Petri dishes containing SCN-infected soybean root explants grown on Gamborg's B5 medium. An excitation wavelength of 570 nm was found to be optimal to achieve high contrast between the SCN females and root tissues. Manual counts are made from a fluorescent image that is captured and displayed on a computer screen. Manual counting of females from the fluorescent images was found to be a reliable (≤14% difference) and more efficient (60% faster) method than manual counting of females in a dish. Nonetheless, the method is not suitable for high-throughput SCN phenotyping of soybean in greenhouse screens and has limited efficiency due to a lack of automated counting.
The objective of this study was to develop a method for automated counting of SCN females using a fluorescence-based image analysis system that is more suited to high-throughput SCN phenotyping methods used in greenhouse screening.
Materials and Methods
Plant materials and growth conditions: Greenhouse screening methods for assessing soybean cyst nematode resistance in this study were conducted in accordance with the SCE08 protocol (Niblack et al., 2009). Seeds of Glycine max differing in their resistance to SCN were germinated in rolls of germination paper for two days at 27oC to a radical length of 4-6 cm prior to transplanting. Each soybean seedling was transplanted into a 6 cm hole made in sterile river sand in 100 cm3 thin-walled polyvinyl carbonate (PVC) tubes (15.2 cm in length, 2.9 cm inside diameter) placed into a 5.7 liter Bains Marie plastic container (Continental Carlisle, Oklahoma City, Oklahoma) and inoculated with SCN eggs as described below. The containers were immersed in a temperature-controlled water bath set at 27.5oC in the greenhouse. The plants were maintained for 30 days under 12-hour supplemental lighting in the greenhouse and fertilized weekly with Miracle-Gro (Scotts Miracle-Gro, Marysville, Ohio).
Nematode inoculation and harvesting: Cysts of Heterodera glycines were extracted from infested soil by flotation in water and collected on a no. 60-mesh (250-μm) sieve. Harvested cysts were crushed gently using a drill press and the eggs collected on a no. 500 (25-μm) sieve (Faghihi and Ferris, 2000). Eggs were further purified by centrifugal flotation on a sucrose density gradient. Individual soybean seedlings were inoculated with 1500-2000 eggs in one ml of water. At 30 days post-inoculation, the tops of the soybean plants were removed and each PVC tube was soaked in a liter of water until the tube could easily be removed from the root. Each root system was gently agitated in the water until the root was free of sand. For automated imaging of SCN females directly on roots, the root system was placed into a plastic cup to allow excess water to drain from the roots and air dried for 30 minutes. Roots were blotted gently with paper towels prior to imaging. Alternatively, SCN females were blasted with a water sprayer on a no. 20-mesh (750 μm) over no. 60-mesh stack of sieves. Females with a small amount of root debris were then rinsed into a labeled 5.5 cm diameter Petri dish.
Imaging system: A Kodak Image Station 4000MM Pro (Carestream Health, Inc. Rochester, NY) equipped with a cooled 4-million pixel CCD camera, 16-bit imaging and an automated precision lens, paired with Carestream Molecular Imaging Software version 5.0.2 (Carestream Health, Inc. Rochester, NY) was used for imaging and automated counting. Fluorescent excitation and emission filters of 470 nm and 535 nm, respectively, were used for all samples.
Imaging and automated counting of SCN females in Petri dishes and on roots: For imaging and automated counting of SCN females in Petri dishes, three Petri dishes with SCN females were placed on the center of the scanning bed in a triangular formation. The Petri plates were then scanned and fluorescent images captured using the following settings: Field of View (FOV): 111.73 mm2; Signal to Noise: 16; Shape of reference: Oval; Width:15, Height:15; Exposure time: 30 seconds.
For imaging and automated counting of SCN females on roots, root systems were individually placed on the scanner. Plastic tweezers were used as needed to aid in spreading out the roots and the root system was then weighted down by a black plate to improve focus. Roots were then scanned and fluorescent images captured using the following settings: Field of View (FOV): 100.30 mm2; Signal to Noise: 15; Shape of reference: Oval; Width:15 Height:15; Exposure time: 30 seconds.
The signal to noise setting compares the level of a desired signal (e.g., fluorescence of SCN females) to the level of background noise. The higher the signal to noise ratio (range 1-20), the more stringent the search. The shape of reference sets the reference region of interest to an oval. Width and height settings establish the number of pixels scanned per major and minor axes of the interior pixels of the oval. The program creates an oval around peaks of intensity emitted from the images using the width and height settings. The program then uses the signal intensity found in that area to calculate the signal emanating from the region of interest.
To obtain automated counts of SCN females in Petri dishes, the area of each dish was outlined. Root images were counted by selecting the entire image for analysis. Fluorescent females were counted within the selected area using the automated region of interest (Auto ROI) function of the imaging software with the aforementioned settings, which uses light intensity at the emitting wavelength of 535 nm and shape, to select the females. Auto ROI counts were recorded and saved with each image.
Statistical analysis: A correlation analysis was performed with the statistical computing package SAS (SAS Institute, Inc, Cary, NC). The relationship between manual SCN female counts and automated SCN females counts either directly on roots or in Petri dishes was determined by plotting manual count data for individual plants against automated count data for each experiment. SAS was used to obtain all graphs, correlation coefficients r, and the estimated regression coefficients.
Results
Optimization of an automated fluorescence-based imaging system to count H. glycines females: The fluorescent imaging system was tested using multiple combinations of wavelengths to identify the best setting to achieve the greatest contrast between SCN females and soybean roots. An excitation filter of 470 nm and emission filter of 535 nm was found to be the best combination available.
To optimize the scanner for counting SCN females in Petri dishes, dishes with known cyst counts were placed on the scanning bed in various formations and imaged using different settings. The scanning bed can hold up to six 5.5 cm Petri dishes simultaneously; however, a triangular formation of three Petri dishes set to a FOV of 111.73 mm2, which focused the camera on an area slightly bigger than the area occupied by the three Petri dishes, was found to be optimal (Fig. 1A,B). A signal to noise ratio set to 16 provided the most accurate result. This setting was stringent enough to avoid picking up any erroneous background noise created by root debris, but not too stringent to underestimate the SCN female counts.
Fig. 1.

Fluorescent cyst images captured by the Kodak Image Station 4000MM Pro and analyzed with Carestream Molecular Imaging Software. (A) Petri dish image with fluorescing SCN females prior to automated region of interest (Auto ROI) search. (B) Petri dish after Auto ROI search, blue circles represent identified SCN females. (C) Whole root image with fluorescing SCN females prior to Auto ROI search (D) Whole root image after Auto ROI search, blue circles represent identified SCN females.
To optimize the scanner for counting SCN females directly on roots, individual root systems were placed on the scanning bed and imaged using different settings (Fig. 1C-D). Females were then washed from the root systems and counted manually to obtain actual counts for optimizing settings. A FOV of 100.30 mm2, which focused the camera on an area slightly bigger than the area occupied by the root system, was found to be optimal. A signal to noise ratio set to 15 provided the most accurate result.
The size and shape of the cyst were used along with the intensity of the light to obtain the cyst counts in the Auto ROI portion of the software and adjusted to the best fit using the signal to noise setting (Fig. 1B,D).
Automated fluorescence-based counting of SCN females in Petri dishes is accurate: To assess the accuracy of the automated fluorescence-based imaging system for counting H. glycines females, we determined the coefficients of determination (r2) between female numbers obtained using fluorescence-based imaging on roots and in Petri dishes with that of manual counting in Petri dishes under a microscope. The root systems of 77 individual soybean plants were first scanned and females counted using the fluorescence-based imaging system; the females were then blasted from the roots into Petri dishes and again scanned and counted using the imaging system. Lastly, the SCN females in the Petri dishes were manually counted under a microscope. The coefficient of determination between automated fluorescence-based counting of SCN females on roots and manual counting of SCN females in Petri dishes under the microscope was determined to be 0.76 (Fig. 2A). The coefficient of determination between automated fluorescence-based counting of SCN females in Petri dishes and manual counting of SCN females in Petri dishes under the microscope was determined to be 0.95 (Fig. 2B). Two additional independent experiments comparing fluorescence-based counting of SCN females in Petri dishes with manual counting of SCN females in Petri dishes under the microscope yielded coefficients of determination of 0.99 (n = 105) and 0.97 (n = 89) (data not shown). One additional independent experiment comparing fluorescence-based counting of SCN females on roots with manual counting of SCN females in Petri dishes under the microscope using a larger sample size (n = 212) yielded a coefficient of determination of 0.85 (data not shown). These data indicate a much higher degree of accuracy in female counting using automated fluorescence-based counting of SCN females in Petri dishes versus directly on roots.
Fig. 2.

Scatter plots depicting the relationship between manual counts of SCN females in Petri dishes and automated SCN female counts directly on roots (A) or automated SCN female counts in Petri dishes (B). Each point corresponds to counts from an individual plant. Coefficients of determination (r2) are indicated.
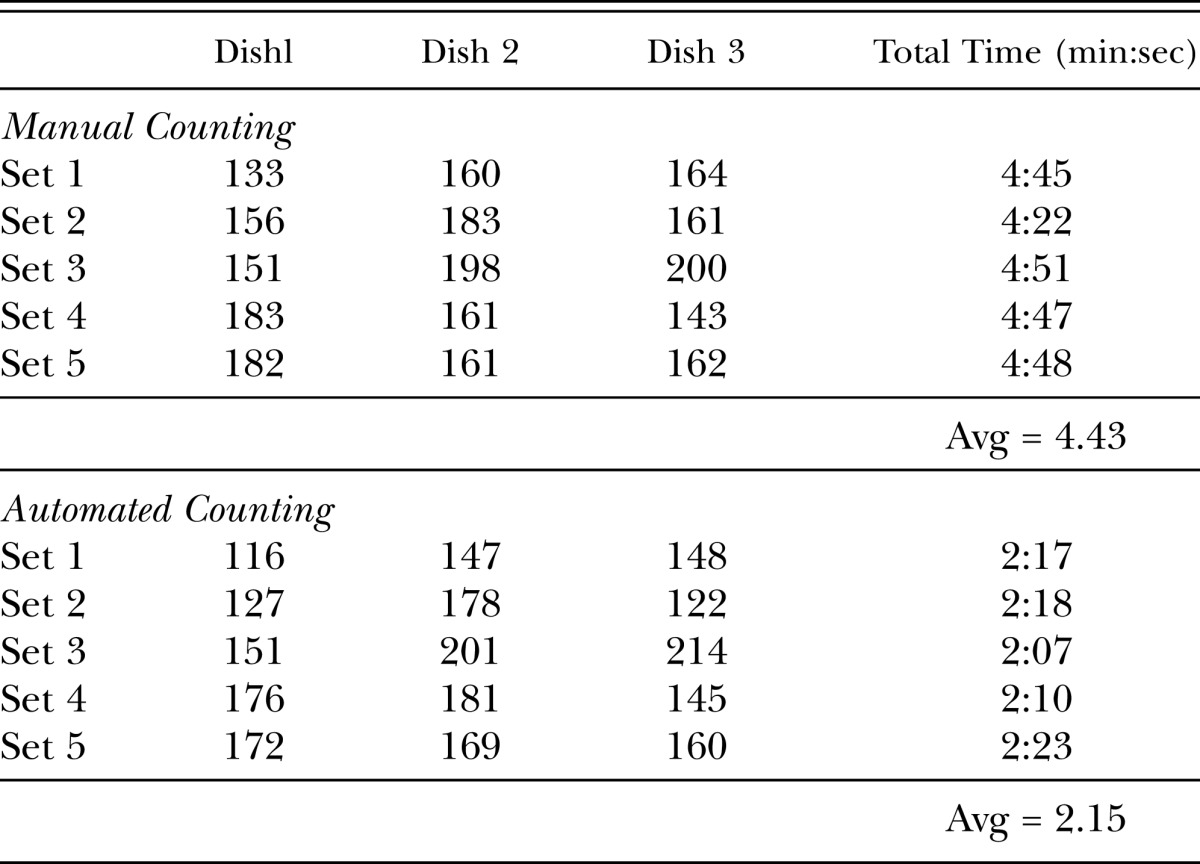
Automated fluorescence-based counting is more efficient than manual counting: To determine whether automated fluorescence-based counting of SCN females in Petri dishes is more efficient than manual counting of SCN females in Petri dishes under the microscope, we compared the speed of the two methods. Fifteen Petri dishes containing SCN females (avg 166 females) were counted in groups of three using the automated fluorescence-based imaging system or counted manually under a microscope and timed. Manual counting of SCN females in three Petri dishes under a microscope by an experienced counter took on average four minutes and forty-three seconds, whereas counts for three dishes using the imaging system took on average two minutes and fifteen seconds (Table 1). Thus, automated fluorescence-based counting was more than 50% faster than manual counting of SCN females under a microscope.
Table 1.
Comparison of female counting times using automated and manual methods.
Discussion
In this paper, we report on a method for automated counting of SCN females using a fluorescence-based imaging system that is adapted for high-throughput screening of H. glycines-infected samples in soil. This is a significant improvement over the current method of screening H. glycines-infected samples in soil which requires manual counting of SCN females under a microscope. Use of the imaging system is more than 50% faster than microscope counting. In addition, this method provides a significant improvement over an existing method reported for SCN female counting using fluorescence-based imaging (Lu et al., 2005). The method reported by Lu et al (2005) was only adapted for counting SCN females grown on root explants in Petri dishes. The approach is useful for soybean hairy root assays, but has not been adapted for counting SCN females on soil-grown roots. The method is also low-throughput. Using this method, only one Petri dish can be imaged at a time and the SCN females still need to be counted manually from a fluorescent image displayed on a computer screen.
Methods to phenotype soybean varieties for resistance to SCN are currently very laborious and time consuming. This is due in part to the 30-day life cycle of SCN; an aspect of the bioassay that cannot be accelerated. Another step in the process of SCN phenotyping of soybean plants that is both laborious and time consuming is the manual counting of females. Thus, automated counting methods could greatly improve the efficiency of SCN bioassays. Here we optimized a fluorescence-based imaging system for automated counting of SCN females and compared two approaches for accuracy. One approach was to image and count SCN females directly on soybean roots and the other approach was to image and count SCN females that had been blasted from roots in Petri dishes. In a direct comparison for accuracy, the automated counting of SCN females in Petri dishes was found to be a superior method over automated counting of SCN females directly on roots. The most likely factor contributing to the reduced accuracy of on root scanning is the different shape, size, and dimension of each root system compared to that of a Petri dish, which may contribute to the calibration being slightly off from sample to sample. Factors such as the irregular distribution of SCN females throughout the root system and the two-dimensional scanning may have also contributed to the reduced accuracy of the latter method. In some cases, we observed cultivar differences in the amount of fluorescing root tissues leading to false counts and an overestimation of female counts. In general, we noted minimal discrepancy in female counts when the same root system was flipped over and rescanned, indicating that most females are detected when scanned from one side. However, the thicker the root system, the greater the chance of underestimating female counts due to hidden females and reduced fluorescent signals from the females on the opposite side of the root system. To improve the accuracy of female counting on the roots, a visual inspection of each image can be undertaken; however, this is time consuming and dramatically decreases the efficiency of sample processing. In contrast to counting females directly on roots, automated counting of SCN females in Petri dishes is not restricted by the aforementioned limitations and was found to be highly accurate (avg r2 = 0.97). Although this approach requires the additional step of blasting the SCN females from the roots, which takes approximately one minute per root sample including washing the sieves between samples, the quality of the data is very reliable.
The approach used will depend on the objective of the study. For example, for early stages of germplasm screening to reduce the number of lines advanced to the next generation, faster, but less accurate SCN female counts may be acceptable. In this case, on root imaging and automated counting may be acceptable. On the other hand, SCN phenotyping of mapping populations for the identification and cloning of SCN resistance genes requires a much higher degree of accuracy so that genotypic information can be correlated to phenotype. In this case, automated counting of SCN females in Petri dishes would be required. Another application for automated counting of SCN females would be its use in HG Type testing. In this case, a combination of automated counting of SCN females in Petri dishes and manual counting may be necessary. Although the FI should always be reported with HG Type designations (Niblack et al., 2002), it would be prudent to manually count the samples yielding an FI near the threshold of 10%. For example, if the susceptible line had 100 SCN females and the average SCN female count on PI 88788 was determined to be 12 using the imaging system, this constitutes a female index of 12% and the HG Type designation would include a “2”. However, if the imager had over or undercounted by just a few SCN females the HG Type designation would change.
In summary, the automated fluorescence-based imaging system described herein for counting SCN females from infected root samples grown in soil is well-suited for high-throughput screening of soybean germplasm for SCN resistance. Application of this method will 1) improve the efficiency and accuracy of H. glycines resistance breeding programs to identify new sources of resistance and develop SCN-resistant cultivars, 2) streamline SCN phenotyping of mapping populations to clone SCN resistance genes in soybean, and 3) provide a more efficient process of testing transgenic plants for SCN resistance.
Literature Cited
- Faghihi J, Ferris JM. An efficient new device to release eggs from Heterodera glycines. Journal of Nematology. 2000;32:411–413. [PMC free article] [PubMed] [Google Scholar]
- Hershman DE, Heinz RD, Kennedy BS. Soybean cyst nematode, Heterodera glycines, populations adapting to resistant soybean cultivars in Kentucky. Plant Disease. 2008;92:1475–1476. doi: 10.1094/PDIS-92-10-1475B. [DOI] [PubMed] [Google Scholar]
- Koenning SR, Wrather JA. Suppression of soybean yield potential in the continental United States from plant diseases estimated from 2006 to 2009. Plant Health Progress, 2010 in press. [Google Scholar]
- Lu H, Tallman J, Hu X, Anderson E, Chamberlin M, Lu G. An innovative method for counting females of soybean cyst nematode with fluorescence imaging technology. J of Nematology. 2005;37:495–499. [PMC free article] [PubMed] [Google Scholar]
- Mitchum MG, Wrather JA, Heinz RD, Shannon G, Danekas G. Variability in distribution and virulence phenotypes of Heterodera glycines in Missouri during 2005. Plant Disease. 2007;91:1473–1476. doi: 10.1094/PDIS-91-11-1473. [DOI] [PubMed] [Google Scholar]
- Niblack T, Tylka GL, Arelli P, Bond J, Diers B, Donald P, Faghihi J, Ferris VR, Gallo K, Heinz RD, Lopez-Nicora H, Von Qualen R, Welacky T, Wilcox J. A standard greenhouse method for assessing soybean cyst nematode resistance in soybean: SCE08 (standardized cyst evaluation 2008). Online. Plant Health Progress. 2009 doi:10.1094/PHP-2009-0513-01-RV. [Google Scholar]
- Niblack TL, Colgrove AL, Colgrove K, Bond JP. Shift in virulence of soybean cyst nematode is associated with use of resistance from PI 88788. Online. Plant Health Progress. 2008 doi:10.1094/PHP-2008-0118-01-RS. [Google Scholar]
- Niblack TL, Arelli PR, Noel GR, Opperman CH, Orf JH, Schmitt DP, Shannon JG, Tylka G. A revised classification scheme for genetically diverse populations of Heterodera glycines. Journal of Nematology. 2002;34:279–288. [PMC free article] [PubMed] [Google Scholar]