

Abstract
Nitrogen is an essential macronutrient for plant growth and development. Inorganic nitrogen and its assimilation products control various metabolic, physiological and developmental processes. Although the transcriptional responses induced by nitrogen have been extensively studied in the past, our work here focused on the discovery of candidate proteins for regulatory events that are complementary to transcriptional changes. Most signaling pathways involve modulation of protein abundance and/or activity by protein phosphorylation. Therefore, we analyzed the dynamic changes in protein phosphorylation in membrane and soluble proteins from plants exposed to rapid changes in nutrient availability over a time course of 30 min. Plants were starved of nitrogen and subsequently resupplied with nitrogen in the form of nitrate or ammonium. Proteins with maximum change in their phosphorylation level at up to 5 min after nitrogen resupply (fast responses) included GPI-anchored proteins, receptor kinases and transcription factors, while proteins with maximum change in their phosphorylation level after 10 min of nitrogen resupply (late responses) included proteins involved in protein synthesis and degradation, as well as proteins with functions in central metabolism and hormone metabolism. Resupply of nitrogen in the form of nitrate or ammonium resulted in distinct phosphorylation patterns, mainly of proteins with signaling functions, transcription factors and transporters.
Keywords: nitrogen, phosphorylation, membrane proteins, metabolic enzymes, proteomics, signaling
Introduction
As sessile organisms, plants need to rapidly adapt to changes in the environment such as light fluctuations and alterations in nutrient availability. Nitrogen is an important macronutrient to ensure plant growth and development as it is a component of proteins and nucleic acids, and many co-factors and secondary metabolites. Plants have the potential for adaptation to reduced nitrogen availability by increasing the capacity for nutrient acquisition and by alteration of whole-plant morphology and metabolism, such as increasing the root/shoot ratio or anthocyanin accumulation in leaves (Rubio et al., 2009). Developmental adaptive mechanisms stimulate growth in organs that directly participate in nutrient acquisition, such as primary roots (Walch-Liu and Forde, 2008). To trigger these adaptive responses and to induce fast switching from starvation metabolism to nutrient assimilation, the nutrient itself or its primary assimilation products serve as signaling molecules (Crawford, 1995; Scheible et al., 1997b; Schulze et al., 1994; Stitt, 1999).
Nitrate starvation itself, as well as nitrate resupply after starvation, induces global changes of gene expression within 30 min (Krapp et al., 2011; Scheible et al., 2004). Recent studies of nitrate-induced transcriptional changes revealed very fast responses as early as 3 min after resupply (Krouk et al., 2010). Supply of external nitrate directly affects its uptake and assimilation by regulating the gene expression of nitrate transporters, nitrate reductase, nitrite reductase and pathways for production of reducing equivalents, such as the pentose phosphate pathway and glycolysis. Nitrate also regulates the expression of genes involved in carbon metabolism, thereby coordinating the production of organic acids required for inorganic nitrogen assimilation (Gutierrez et al., 2007).
The nitrate transporter NRT1.1 has a direct role in nitrate sensing (Ho et al., 2009), and its phosphorylation status at T101 is dependent on external nitrate concentration. NRT1.1 is highly phosphorylated under low-nitrogen conditions and then rapidly dephosphorylated when nitrogen is supplied at higher concentrations. Phosphorylation at T101 is required to activate the sensing function of NRT1.1 and to switch from low-affinity transport to high-affinity uptake (Liu and Tsay, 2003). However, most studies on nitrate signaling have focused on expression changes of the nitrate transporter NRT2.1, which is a high-affinity nitrate transport system (Filleur et al., 2001). NRT2.1 expression is transiently up-regulated by nitrogen deficiency (Girin et al., 2007; Lejay et al., 1999), and there is evidence for regulation also at the post-translational level (Wirth et al., 2007). Due to the direct inhibition of NRT2.1 expression by nitrate, NRT2.1 expression has been used as means of screening for nitrate signaling mutants (Girin et al., 2010). Expression of NRT1.1 and NRT2.1 is also rapidly induced by nitrate resupply after starvation (Krouk et al., 2011; Scheible et al., 2004).
Similarly, expression of the ammonium transporter AMT1.1 is strongly up-regulated by nitrogen starvation, and expression is reduced upon ammonium supply. AMT1.1 is responsible for cellular ammonium acquisition as well as ammonium retrieval, thus serving as the major high-affinity ammonium transporter in Arabidopsis roots (Gazzarrini et al., 1999; Ninnemann et al., 1994). Studies correlating transcript or protein abundance with ammonium influx or employing promoter fusions to reporter genes indicate that transcriptional control in response to nitrogen and carbon nutritional status is a major regulatory mechanism for ammonium transporters in plants (Yuan et al., 2006). Recently, it was shown that ammonium uptake is also regulated at the post-transcriptional level by transporter trans-inactivation through phosphorylation of a C-terminal threonine (Lanquar et al., 2009; Loque et al., 2007). Reversible phosphorylation of nitrogen transporters thus provides a powerful fast mechanism for regulating their sensitivity according to changes in nitrogen availability (Walch-Liu and Forde, 2008).
In general, many molecular components of nitrogen-induced signaling processes remain unknown. Nitrate and ammonium can induce direct expression changes in their respective uptake systems and trigger immediate downstream responses involving kinases and transcription factors (Gojon et al., 2009). However, complexity is introduced by feedback repression of nitrogen uptake and metabolism by nitrogen-containing metabolites. Furthermore, several microRNA targets have been found to be regulated by nitrate, suggesting that microRNAs are involved in systemic signaling of nitrogen status between roots and shoots (Gifford et al., 2008; Liu et al., 2009).
Most efforts so far to characterize signaling components of nitrogen-induced responses have made use of genetic tools and monitored changes in gene expression. However, a significant part of the immediate regulation occurs through post-translational modifications of proteins. Enzymes of nitrate assimilation are regulated by protein phosphorylation (Kaiser and Huber, 2001), and the transporters for nitrate and ammonium can also be directly regulated by phosphorylation events (Ho et al., 2009; Lanquar et al., 2009; Loque et al., 2007). Thus, analysis of time-resolved protein phosphorylation patterns is expected to identify additional candidate proteins that are involved in nitrogen-induced sensing and signaling processes. Our work thus complements existing large-scale analyses of nitrogen-induced transcriptional changes.
Quantitative analyses of stimulus-induced protein phosphorylation patterns have been performed to study sucrose-induced phosphorylation (Niittyläet al., 2007), cellular responses to elicitor treatment (Benschop et al., 2007; Nühse et al., 2007), cellular responses to phytohormones (Chen et al., 2010; Kline et al., 2010; Tang et al., 2008) and to compare responses to light and dark conditions in chloroplasts (Reiland et al., 2009). Label-free techniques and stable isotope labeling have been used for such quantitative comparison. Here, we present results from a systematic analysis of dynamic changes in protein phosphorylation induced by resupply of various nitrogen sources to nitrogen-starved Arabidopsis seedlings over a period of up to 30 min.
Results
Nitrogen starvation of seedlings
For nitrogen starvation and resupply experiments, seedlings were grown in liquid culture. Under these growth conditions, the nitrogen-starved seedlings displayed typical phenotypes of nitrogen starvation, such as long roots, pale leaves and anthocyanine accumulation. The nitrogen starvation status, as well as induction of nitrogen resupply, was monitored by expression of characteristic marker genes (Scheible et al., 2004). Expression of At3g03910 (a putative glutamate dehydrogenase) was up-regulated in all seedlings starved of nitrogen (Figure 1a,c,e). In contrast, expression of At4g32950 (a putative protein phosphatase 2C) was strongly induced upon resupply of nitrate starting at 10 min of nitrate resupply and increasing over a period of 30 min (Figure 1b). Expression of this known nitrate resupply-induced gene was not induced by ammonium resupply or the addition of KCl (Figure 1d,f). This is in agreement with previously published results on nitrogen-starvation induced genes and gene expression induced by nitrate (Scheible et al., 2004).
Figure 1.
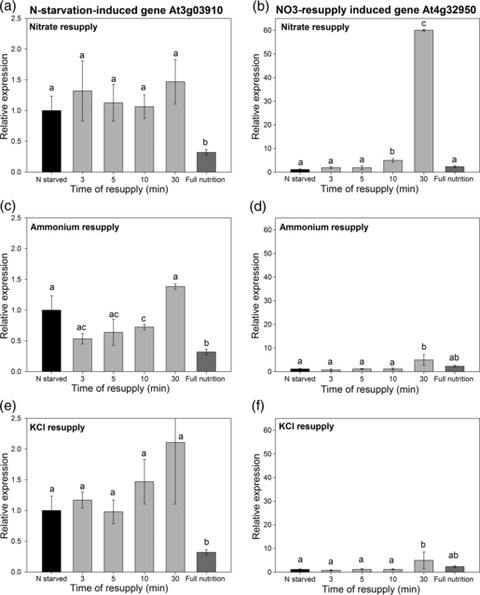
Analysis of gene expression by real-time PCR. At3g03910 was used as an example of a nitrogen starvation-induced gene, while At4g32950 was used as an example of a gene induced by nitrate resupply after starvation. (a–c) Expression of At3g03910 in nitrogen-starved seedlings and after nitrate resupply (a), ammonium resupply (b) and KCl treatment (c). (d–f) Expression of At4g32950 in seedlings subjected to nitrate resupply (a), ammonium resupply (b) and KCl treatment (c). Values are means ± standard deviation of three biological replicate experiments. Different letters indicate significant differences (P < 0.05, Student's t-test).
The up-regulated expression of nitrogen starvation-induced gene At3g03910 in all treatments throughout the time course of nitrate and ammonium resupply (Figure 1a,c) suggested that nitrogen resupply for short time periods did not alter the general ‘starvation status’ of the plant, although nitrate-induced transcriptional changes have been observed as early as 3 min after resupply (Krouk et al., 2010). However, particularly at the last time point (30 min of nitrogen resupply), changes in gene expression began to affect nitrogen transport and nitrogen metabolism, as indicated by the strong up-regulation of At4g2950 upon nitrate resupply (Figure 1b) and as described previously (Krouk et al., 2010). Thus, the early changes in phosphorylation most likely occur in parallel with fast transcript changes, and particularly at the later time points of 10 and 30 min, we may observe overlying effects due to onset of transcriptional changes. These possible changes in total protein abundance have been corrected for by normalizing the ion intensities of phosphopeptides to the mean ion intensities of non-phosphopeptides as described previously (Niittyläet al., 2007).
Global dynamic phosphorylation responses to nitrogen resupply
In total, from four biological replicate time-course experiments each with ammonium or nitrate resupply and from two biological replicates with KCl supply, 11 693 peptides corresponding to 6164 proteins were identified by LC-MS/MS. Of these, 1225 unique phosphopeptides were identified based on the criteria described in Experimental Procedures (Table S1). The phosphopeptides comprised 773 unique peptides identified in seedlings resupplied with nitrate, 869 peptides identified upon ammonium resupply, and 620 peptides identified upon treatment with KCl. A total of 436 peptides were identified under all three conditions (Figure S1a). The overlap of phosphopeptides identified in experiments with nitrate and ammonium resupply was significantly larger than the overlap with KCl treatment. This suggests that resupply of nitrogen as either nitrate or ammonium induces phosphorylation of a large common set of proteins that is distinct from the set of proteins induced by a non-nitrogen-related ionic treatment, such as KCl.
For analysis of time-resolved response profiles, proteins were only considered if they were quantified for at least three of the five time points after re-addition of nitrate, ammonium or KCl. Thus, of the 1225 phosphopeptides identified in all experiments, we obtained time-resolved abundance profiles for 588 unique phosphopeptides. These phosphopeptides comprised 332 peptides from the experiments with nitrate resupply, 386 peptides from experiments with ammonium resupply, and 228 peptides from experiments with KCl addition (Figure S1b).
The time-resolved abundance profiles of normalized ion intensities for individual phosphopeptides showed responses common to all three treatments, as well as responses specifically induced by nitrate, ammonium or KCl, respectively. For example, phosphopeptides quantified for all treatments included peptides from transporters, such as peptide (pT)LHGLQPK of plasma membrane ATPase AHA1 (AT2G18960) and AHA2 (AT4G30190) and peptide QTTAEGSANPEPDQIL(pS)PR of purine transporter PUP18 (AT1G57990), as well as peptides (pS)QLHELHA and ALG(pS)FR(pS)NATN from aquaporin isoforms.
These peptides (pS)QLHELHA, ALG(pS)FR and ALG(pS)FR(pS)NATN correspond to the conserved phosphorylation sites in aquaporins that control pore gating (Tornroth-Horsefield et al., 2006). Upon phosphorylation, the pore is open; dephosphorylation leads to closing of the pore. External supply of KCl lead to very rapid dephosphorylation of these phosphorylation sites. Upon re-addition of nitrogen in the form of ammonium, aquaporins were also rapidly dephosphorylated, but with a delay of approximately 5 min. Nitrate resupply had the weakest effect on pore closing of aquaporins, with maximum dephosphorylation occurring at 5 min of nitrate supply and a subsequent tendency towards an increase in the phosphorylation level over time (i.e. re-opening of the pores) (Figure 2a).
Figure 2.
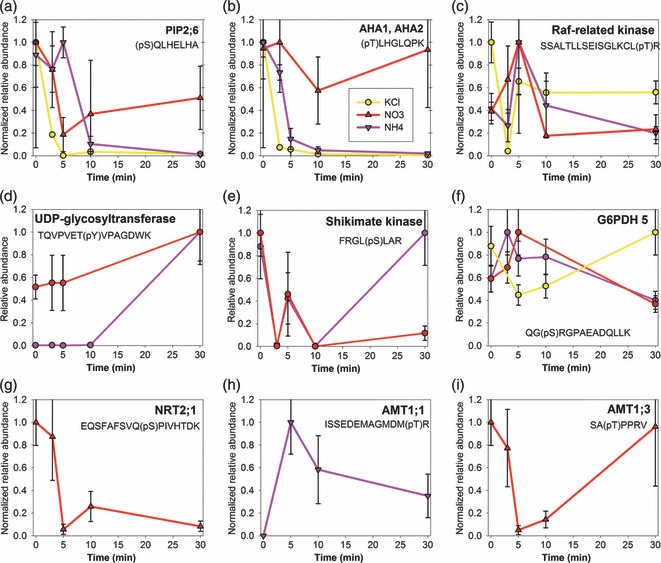
Examples of commonly quantified proteins with distinct time-response profiles upon resupply of nitrate (red), ammonium (pink) or KCl (yellow). (a) Aquaporins. (b) AHA1/AHA2. (c) Raf-related kinase (AT1G04210). (d) UDP-glucosyl transferase (AT2G36800). (e) Shikimate kinase (AT2G21940). (f) Glucose-6-phosphate dehydrogenase (AT3G27300). (g) Nitrate trans (AT2G18960/AT4G30190) porter NRT2;1 (AT1G08090). (h) Ammonium transporter AMT1;1 (AT4G13510) trans-inactivation site. (i) Ammonium transporter AMT1;3 (AT3G24300) C-terminal phosphorylation site.
Another example of proteins whose phosphorylation was affected by all three treatments is the plasma membrane ATPases AHA1 and AHA2, at phosphorylation site T881 (pTLHGLQPK). Phosphorylation of T881 is associated with activation of the proton pumps (Niittyläet al., 2007). Rapid dephosphorylation of T881 was observed in cases of KCl addition and also upon ammonium resupply to nitrogen-starved seedlings. This could be explained as an inactivation of plasma membrane ATPase upon a strong depolarization of the membrane potential during uptake of cations. In contrast, re-addition of nitrate only induced a short transient decrease in phosphorylation status of T881, and the phosphorylation level of T881 returned to that in nitrogen-starved cells after 30 min (Figure 2b). In addition, a protein that functions as a Raf-related kinase (AT1G04210) showed similar phosphorylation profiles under both types of nitrogen resupply, but showed a clearly distinct phosphorylation time course under conditions of KCl supply (Figure 2c).
Other proteins with changes in phosphorylation status upon both nitrate and ammonium resupply were mainly found to function in primary nitrogen assimilation metabolism, amino acid synthesis, nucleotide metabolism and tetrapyrrole synthesis. For example, time-resolved phosphorylation patterns were recorded in nitrate- and ammonium-resupplied seedlings for peptides from UDP-glucosyl transferase (Figure 2d), shikimate kinase (Figure 2e), glucose-6-phosphate dehydrogenase (Figure 2f), as well as nitrate reductase and isoforms of glutamine synthase (see below).
The phosphorylation profiles comprised the nitrogen-starved condition (time point 0) and various durations of resupply (3, 5, 10 and 30 min) of nitrate, ammonium or KCl. All profiles of phosphorylation change with more than four data point values (588 phosphopeptides) were grouped using k-means clustering (Figure 3). As both dephosphorylation (decrease in the phosphorylation level) and phosphorylation (increase in the phosphorylation level) may have activating or inactivating effects on downstream targets, the 16 distinct clusters were combined into larger response groups consisting of clusters with maxima or minima of normalized phosphopeptide intensity at the individual time points. Thus, two clusters showed a phosphorylation maximum at time point 0 (clusters 2 and 8), two clusters showed maximum or minimum phosphorylation changes at 3 min (clusters 1 and 7), two clusters showed phosphorylation peaks at 5 min (clusters 3 and 16), two clusters showed peaks at 10 min (clusters 4 and 9) and three clusters showed a slow increase or decrease of phosphorylation over 30 min (clusters 13, 14 and 15). Four clusters showed oscillating phosphorylation responses (clusters 5 and 6) or displayed an almost constant phosphorylation profile (clusters 11 and 12). Cluster 10 showed a phosphorylation minimum at 3 and 5 min (Figure 3).
Figure 3.
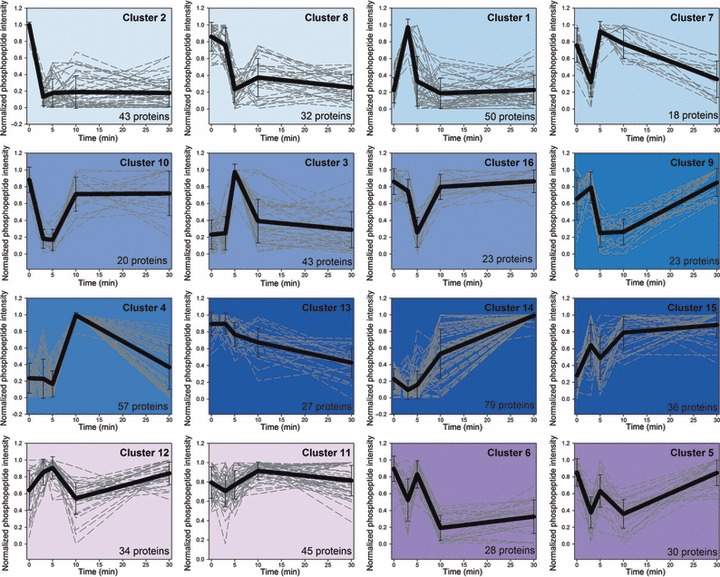
k-means clustering of time-course profiles of all phosphopeptides. A total of 16 clusters were formed using an Euclidean distance matrix. Different colors indicate response groups with maximal or minimal phosphorylation at the respective time points.
Within each response group, proteins were functionally classified according to MapMan (Thimm et al., 2004), and the relative abundance of proteins within each functional bin was expressed as z-scores to identify patterns of over-representation of specific cellular functions within response groups (Figure 4). Proteins with a phosphorylation maximum under nitrogen-starved conditions (time point 0) included those with functions in nucleotide degradation (e.g. salvage pathway), hormone metabolism and development, as well as aquaporins. Obviously, these proteins with very fast changes in phosphorylation status are mainly involved in general adaptations to the new nutritional and osmotic conditions, such as inactivation of typical starvation responses, for example dephosphorylation of enzymes in the salvage pathways, as well as immediate adaptations to alterations in external solute concentration (e.g. regulation of aquaporin and transporter activities). The nitrate transporter NRT2.1 was also rapidly dephopsphorylated after only 3 min of nitrate supply.
Figure 4.

Heatmap of the relative abundance of functional categories in different response groups of phosphorylation. Nitrate and ammonium responses were analyzed together. A Euclidean distance matrix with mean linkage distance was used.
Proteins with a transient change in phosphorylation after 3 min were involved in lipid metabolism, especially of ‘special lipids’, such as sterols, glycolipids, squalenes and sphingolipids (MapMan bin ‘lipid metabolism.exotics’; e.g. AT5G23450, a sphingosine kinase). The functional category ‘misc’ includes mainly proteins with as yet uncharacterized functions. Many of these proteins, such as AT1G78800, a UDP-glucosyl transferase, form part of sterol-rich membrane microdomains (Kierszniowska et al., 2009). Proteins with a transient change in phosphorylation at 5 min of nitrate or ammonium resupply included receptor-like kinases (AT3G21990, AT5G41300, AT3G46330 and AT1G55200), proteins with functions in cell-wall precursor synthesis, and ammonium transporter AMT1.
In contrast, proteins with functions in vesicle transport, G-protein signaling, cell organization and transcription factors showed a peak of transient change in phosphorylation at 10 min. Proteins with a slow change in phosphorylation status over 30 min mainly included proteins involved in calcium signaling, central metabolism (nitrogen metabolism and glycolysis) and protein synthesis, and proteins affecting DNA structure and synthesis (DNA polymerases and histones, e.g. AT1G10520). Some proteins, such as ribosomal proteins (MapMan bin ‘protein.synthesis’), several kinases and phosphatases (MapMan bin ‘protein.posttranslational modification’) and ABC transporters (MapMan bin ‘transport.misc’) were over-represented among proteins with an oscillating phosphorylation pattern.
In general, the protein composition of the phosphorylation response groups indicated progression of phosphorylation ‘waves’ from the membrane to the cell interior with an increasing duration of nitrogen resupply. Early transient changes in phosphorylation status within 3–5 min affected proteins with functions in membrane lipid metabolism, transporters, membrane-bound kinases and transcription factors. At later time points (after 10–30 min), phosphorylation changes affected mainly cytosolic signaling proteins, and proteins involved in protein synthesis and degradation, as well as those involved in central metabolism. This trend for progression of the phosphorylation peak time from membrane proteins to cytosolic proteins was apparent in the distribution of soluble proteins and membrane proteins to different phosphorylation response groups (Figure 5). We observed a clear increase in the proportion of soluble proteins from the response group with a phosphorylation peak at 3 min to the response group with a phosphorylation peak at 30 min. The group of proteins for which phosphorylation peaked at 3 min included the highest proportion of proteins with single transmembrane spans. These included receptor-like kinases, RING-type ubiquitin ligases (e.g. AT1G20823), proteins with functions in lipid modification and cell-wall proteins (e.g. AT1G78400 and AT1G78800). Proteins with more than four transmembrane spans, such as transporters, were more frequently observed among proteins with early (up to 5 min) transient changes in phosphorylation.
Figure 5.
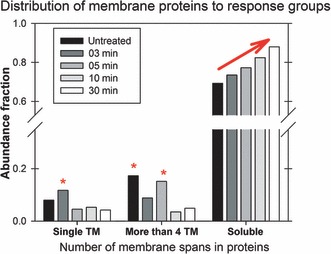
Number of proteins with one or more than four membrane spans and number of soluble proteins expressed as a proportion of all proteins identified.
Consistently, the transporter NRT2.1 for high-affinity nitrate uptake was rapidly de-phosphorylated after 3 min of nitrate resupply (Figure 2g). We investigated the phosphorylation of the high-affinity transporter NRT2.1 in more detail under conditions of resupply of various concentrations of nitrate for 10 min. In starved cells, protein phosphorylation at S28 of NRT2.1 was high, and remained high upon resupply of 0.3 mm nitrate (Figure S2). Upon resupply of higher concentrations of nitrate (3 or 10 mm), the concentration range used in the present starvation/resupply phosphorylation screen, NRT2.1 phosphorylation decreased. Under these conditions, low-affinity transport systems are expected to contribute the majority of nitrate influx. Interaction of NRT2.1 with the protein NAR2.1 is required for NRT2.1 transporter function (Orsel et al., 2006, 2007; Wirth et al., 2007), and protein phosphorylation may influence this protein–protein interaction. Phosphorylation may also be involved in NRT2.1 dimerization, targeting for protein degradation or direct activity regulation. Understanding the precise role of NRT2.1 phosphorylation at S28 will require further in-depth studies of site-directed mutants.
The transporter AMT1;1 for ammonium uptake also showed rapid changes in phosphorylation at early time points of nitrate or ammonium resupply (Figure 2h,i). In addition to the known phosphorylation site in ammonium transporters with trans-inactivating functions (Figure 2h), we identified a number of further phosphorylation sites in the C-terminus of AMT1;1 and AMT1;3 that were altered upon nitrate addition (Figure 2i; see Table S1 for full list). The precise function of these multiple C-terminal phosphorylation sites in ammonium transporters remains to be elucidated.
Nitrate- and ammonium-specific phosphorylation patterns
To define nitrate- and ammonium-specific phosphorylation responses, proteins were considered that (i) were specifically phosphorylated under either nitrate or ammonium resupply, (ii) were identified as non-phosphorylated peptides under the respective other nutrient condition (Figure S3), or (iii) were not identified under conditions of KCl supply or displayed a clearly different profile under KCl treatment. An over-representation analysis revealed that proteins specifically phosphorylated under nitrate resupply conditions and not phosphorylated upon ammonium resupply included those with functions in phosphatidylinositol signaling, cell-wall degradation and the Calvin–Benson cycle, and transcription factors of the zinc finger group (Table 1). In contrast, proteins specifically phosphorylated upon ammonium resupply and not phosphorylated upon nitrate resupply included aquaporins, receptor-like kinases and proteins involved in secondary metabolism and aromatic amino acid synthesis. As expected, proteins involved in nitrogen assimilation, tetrapyrrole synthesis, nucleotide synthesis and proton ATPases were over-represented among the proteins phosphorylated under both types of nitrogen resupply. We thus observed phosphorylation patterns under conditions of both nitrate and ammonium resupply mainly for central nitrogen metabolism, whereas specific phosphorylation responses affected mainly specific transporters, signaling components and transcription factors (Table 1).
Table 1.
Over-representation analysis of protein functions specifically phosphorylated by either nitrate or ammonium resupply
| NO3 resupply | Overlap of NO3 and NH4 | NH4 resupply | |||||||
|---|---|---|---|---|---|---|---|---|---|
| Specific presence and specific phosphorylation | Specific phosphorylation; presence under both conditions | Phosphorylation under both conditions | Specific phosphorylation; presence under both conditions | Specific presence and specific phosphorylation | |||||
| MapMan bin | P-value | MapMan bin | P-value | MapMan bin | P-value | MapMan bin | P-value | MapMan bin | P-value |
| Lipid metabolism.lipid degradation.lipases | 0.0003 | PS.calvin cycle | 0.0014 | Transport.p- and v-ATPases.H+-exporting ATPase | 0.0023 | Transport.major intrinsic proteins.PIP | 0.0155 | Transport.ABC transporters and multidrug resistance systems | 0.0018 |
| RNA.regulation of transcription | 0.0008 | Lipid metabolism.‘exotics’ (steroids.squalene etc.).trans-2-enoyl-CoA reductase (NADPH) | 0.0091 | Secondary metabolism.wax | 0.0045 | Secondary metabolism.isoprenoids | 0.0162 | RNA.regulation of transcription.Polycomb Group (PcG) | 0.0060 |
| Secondary metabolism.isoprenoids.terpenoids | 0.0089 | Nucleotide metabolism.synthesis.purine.GMP synthetase | 0.0091 | N-metabolism.ammonia metabolism.glutamine synthase | 0.0109 | Amino acid metabolism.synthesis.aromatic aa | 0.0337 | Stress.abiotic.touch/wounding | 0.0060 |
| Protein.degradation.ubiquitin.E3 | 0.0128 | RNA.regulation of transcription.C3H zinc finger family | 0.0181 | Protein.targeting.nucleus | 0.0151 | PS.photorespiration.glycerate kinase | 0.0162 | Not assigned | 0.0120 |
| RNA.regulation of transcription.WRKY domain transcription factor family | 0.0161 | Cell wall.degradation | 0.0214 | Nucleotide metabolism.synthesis.pyrimidine | 0.0281 | Major CHO metabolism.degradation | 0.0172 | Protein.synthesis | 0.0123 |
| Lipid metabolism.phospholipid synthesis | 0.0253 | Signaling.phosphinositides.phosphatidylinositol-4-phosphate 5-kinase | 0.0448 | Tetrapyrrole synthesis | 0.0281 | RNA.regulation of transcription | 0.0294 | Cell wall | 0.0234 |
| RNA.regulation of transcription.unclassified | 0.0282 | Lipid metabolism.lipid degradation | 0.0281 | Secondary metabolism.N misc.betaine | 0.0322 | RNA.processing.RNA helicase | 0.0244 | ||
| Protein.postranslational modification.kinase | 0.0392 | N-metabolism | 0.0498 | Transport.major intrinsic proteins | 0.0337 | RNA.regulation of transcription.MYB domain transcription factor family | 0.0273 | ||
| RNA.regulation of transcription.bZIP transcription factor family | 0.0414 | Cell.organization | 0.0359 | Signaling.receptor kinases.misc | 0.0377 | ||||
| Signaling.receptor kinases.leucine rich repeat V | 0.0479 | DNA | 0.0410 | ||||||
| Lipid metabolism.‘exotics’ (steroids.squalene etc.).sphingolipids | 0.0479 | Redox.regulation | 0.0440 | ||||||
P-values were obtained using a Fisher exact test and were corrected for multiple testing (Benjamini and Hochberg, 1995).
Pathways with altered phosphorylation
In most cases, the kinases responsible for phosphorylation of nitrogen uptake transporters remain unknown. Calcineurin-B like (CBL)-CBL-interacting protein kinase (CIPK) kinases have been identified as candidates for regulation of potassium channels through phosphorylation (Lee et al., 2007), and calcium-dependent protein kinases have been studied intensively as plant-specific kinases in various stress responses, often also being membrane-associated (Ludwig et al., 2004). With regard to metabolic signaling, the Snf1-related protein kinases (SnRKs) are central players linking stress responses and metabolic signaling (Fragoso et al., 2009; Halford and Hey, 2009; Shin et al., 2007), and the MAP kinase pathway is among the most well-studied central signaling pathway, with functions in biotic stress responses, plant defense, hormone signaling, senescence and development. Here, we identified phosphorylated members of all the above-mentioned kinase families (Table 2). For example, CIPK2 was phosphorylated in nitrate-resupplied seedlings after 5 min, while CPK27 was phosphorylated in ammonium-resupplied seedlings after 5 min. SNRK2.4 was phosphorylated after nitrate resupply at 10 and 30 min, and two phosphorylation sites in MKK2 were identified after nitrate and ammonium resupply.
Table 2.
Known kinases and phosphorylation sites identified as phosphorylated upon nitrate or ammonium resupply after nitrogen starvation
| Kinase familyRLKs | AGI | Phosphopeptide | NH4 resupply | NO3 resupply | Description |
|---|---|---|---|---|---|
| 23 | 18 | ||||
| AT1G33260.1 | DGSIDLEEVK(pT)MLR | x | Protein kinase family protein | ||
| AT1G34420.1 | LEV(pS)DN(pS)LSGTIPEGIK | x | Leucine-rich repeat family protein/protein kinase family protein | ||
| AT1G51800.1 | (pS)HHGFEPPVIAK | x | Leucine-rich repeat protein kinase | ||
| AT1G55200.1 | K(pS)QANWVVLDK | x | Protein kinase family protein | ||
| AT1G70130.1 | ILAI(pS)L(pS)I(pS)GV(pT)LVIVLILGV(oxM)LFLK | x | Lectin protein kinase | ||
| AT2G01820.1 | LLDV(pS)NNDF(pY)GIPPKFR | x | Leucine-rich repeat protein kinase | ||
| AT2G07040.1 | LGRLNHENLLPIVA(y)(y)YK | X | x | PRK2A (pollen receptor kinase) | |
| AT2G11520.1 | LIITE(pY)VRNGTLR | X | CRCK3 (CALMODULIN-BINDING RECEPTOR-LIKE CYTOPLASMIC KINASE 3) | ||
| AT2G13790.1 | LE(pS)LVDAELEGK | X | SERK4 (SOMATIC EMBRYOGENESIS RECEPTOR-LIKE KINASE 4) | ||
| AT2G19190.1 | (pS)ILANGDIR | x | FRK1 (FLG22-INDUCED RECEPTOR-LIKE KINASE 1) | ||
| AT2G23300.1 | ELEVE(pT)LLK | X | x | Leucine-rich repeat transmembrane protein kinase | |
| AT2G23770.1 | AKIG(pS)LGSAR | X | x | Protein kinase family protein/peptidoglycan-binding LysM domain-containing | |
| AT2G32800.1 | LG(oxM)(pT)KCPALVTR | AP4.3A; protein serine/threonine kinase | |||
| AT3G02880.1 | LIEEVSHSSG(pS)PNPV(pS)D | x | Leucine-rich repeat transmembrane protein kinase | ||
| AT3G08680.1 | GI(pS)HIH(pS)ASGAKLLHGNIK | X | x | Leucine-rich repeat transmembrane protein kinase | |
| AT3G14350.1 | DGNLLNSGPAPPPPPG(pT)PPISK | X | SRF7 (STRUBBELIG-RECEPTOR FAMILY 7) | ||
| AT3G21990.1 | VSAMVQC(pT)K | X | Receptor-like protein kinase-related | ||
| AT3G23750.1 | GGFGVV(y)AGELHDG(t)KTAVK | X | x | Leucine-rich repeat protein kinase family protein | |
| AT3G46330.1 | SLLVINL(pS)GNK | X | MEE39 (MATERNAL EFFECT EMBRYO ARREST 39) | ||
| AT3G47570.1 | V(pT)HLELGR | X | x | Leucine-rich repeat transmembrane protein kinase | |
| AT4G08850.1 | VTEIAI(pY)DNLL(pT)GPIPSSFGNLTK | X | x | Leucine-rich repeat receptor-like protein kinase | |
| AT4G23190.1 | QLKLVSEGSESDQYT(pS)K | X | CRK11 (CYSTEINE-RICH RLK11) | ||
| AT4G34220.1 | STAPINPLTEKPNQ(pT)GK(pS)K | X | Leucine-rich repeat transmembrane protein kinase | ||
| AT5G07150.1 | LREI(pT)GI(pT)PEAALPSR | X | x | Leucine-rich repeat protein kinase | |
| AT5G10530.1 | GEVI(pT)AIDEKLR | X | x | Lectin protein kinase | |
| AT5G37450.1 | DHV(pT)TIVK | X | x | Leucine-rich repeat transmembrane protein kinase | |
| AT5G41300.1 | SSTLS(pS)ALTPYYYLDVTR | X | Receptor-like protein kinase-related | ||
| AT5G58150.1 | LSALH(pY)LNLSR | x | Leucine-rich repeat transmembrane protein kinase | ||
| AT5G61350.1 | INIGGDLI(pS)PK | X | x | Protein kinase family protein | |
| AT5G65830.1 | LFG(pY)PLEEMKNK | X | x | Leucine-rich repeat protein kinase | |
| SNRKs | – | 1 | |||
| AT1G10940.1 | (s)(t)VGTPAYIAPEVLSR | X | SNRK2.4 (SNF1-RELATED PROTEIN KINASE 2.4) | ||
| BSKs | – | 1 | |||
| AT4G35230.1 | SY(pS)TNLAYTPPEYLR | X | BSK1 (BR-SIGNALING KINASE 1) | ||
| CIPKs | 1 | 1 | |||
| AT5G07070.1 | HPNVVEL(pY)EV(oxM)ATKSR | X | CIPK2 (CBL-INTERACTING PROTEIN KINASE 2) | ||
| AT5G35410.1 | EPSEIIANIEAVAN(pS)(oxM)GFK | x | CIPK24 (CBL-INTERACTING PROTEIN KINASE 24) | ||
| CPKs | 3 | 1 | |||
| AT3G20410.1 | LESNENL(pY)K | x | CPK9 (CALMODULIN-DOMAIN PROTEIN KINASE 9) | ||
| AT3G56760.1 | TAILKSS(pT)EATK | x | X | Calcium-dependent protein kinase | |
| AT4G04700.1 | IYILGEELGRGNFGL(pT)R | x | CPK27 (CALCIUM-DEPENDENT PROTEIN KINASE 27) | ||
| MAPK pathway | 2 | 1 | |||
| AT1G09000.1 | GPLGG(s)P(s)RATDAT(s)C(s)K | X | ANP1 (ARABIDOPSIS NPK1-RELATED PROTEIN KINASE 1) | ||
| AT4G29810.1 | AIPD(pS)YLSAIFR | X | ATMKK2 (ARABIDOPSIS THALIANA MAP KINASE KINASE 2) | ||
| AT4G29810.1 | IISQLEPEVL(pS)PIKPADDQLSLSDLD(oxM)VK | X | ATMKK2 (ARABIDOPSIS THALIANA MAP KINASE KINASE 2) | ||
| Casein kinase | 2 | – | |||
| AT2G23080.1 | (pY)QLDLDPQLEALVGR | X | Casein kinase II α chain | ||
| AT4G28860.1 | NMNMPSSTSLSPAG(t)(s)KR | X | CKL4 (CASEIN KINASE I-LIKE 4) | ||
| PI kinase | 2 | 1 | |||
| AT4G33240.1 | (pS)P(pT)(pS)LAKILGIYQV(pS)(pS)K | X | 1-phosphatidylinositol-4-phosphate 5-kinase | ||
| AT4G33240.1 | CAAN(pS)IPSPSDETK | X | x | 1-phosphatidylinositol-4-phosphate 5-kinase | |
| Other kinases | 22 | 24 | |||
| AT1G01450.1 | LFPS(pS)LLDN(pT)K | X | Protein kinase-related | ||
| AT1G04210.1 | SSALTLLSEISGLKCL(pT)R | X | x | Leucine-rich repeat protein kinase | |
| AT1G09600.1 | IFKLCGSPSEE(pY)WK | X | x | Protein kinase family protein | |
| AT1G16760.1 | GQ(pT)LALIHVLPK | x | Protein kinase family protein | ||
| AT1G27070.1 | HRLQQLQSEL(s)(s)VLHSLR | X | x | 5′-AMP-activated protein kinase-related | |
| AT1G27070.1 | HRLQQLQSELSSVLH(pS)LR | x | 5′-AMP-activated protein kinase-related | ||
| AT1G33770.1 | (pT)VIVERPSR | X | x | Protein kinase family protein | |
| AT1G67470.1 | KPK(pS)EIASER | X | Protein kinase family protein | ||
| AT1G80870.1 | AKI(pS)DFGLSR | x | Protein kinase family protein | ||
| AT1G80870.1 | E(oxM)NLLSPN(pS)VLDLGKGSK | X | x | Protein kinase family protein | |
| AT2G29000.1 | IISLDL(pS)NR | X | Leucine-rich repeat protein kinase | ||
| AT3G02810.1 | LSSK(s)(s)QK | X | x | Protein kinase family protein | |
| AT3G13670.1 | I(s)GGNDR(s)AGA(s)ILEVALK | X | x | Protein kinase family protein | |
| AT3G13670.1 | VQVGG(pS)PLYK | X | Protein kinase family protein | ||
| AT3G17420.1 | SNATTLPVTQ(pS)PR | x | GPK1 (GLYOXYSOMAL PROTEIN KINASE 1) | ||
| AT3G20830.1 | LRTTP(pS)(pS)APPSPLR | X | Protein kinase family protein | ||
| AT3G44200.1 | RTSLIAHQ(pS)R | x | NEK6 NIMA (NEVER IN MITOSIS, GENE A)-RELATED 6 | ||
| AT3G59410.1 | GALRADRP(pT)R | X | x | Protein kinase family protein | |
| AT3G59410.1 | GQLKDHGSNADEDNELL(pS)EEI(pT)AL(pS)AIFQEDCK | X | x | Protein kinase family protein | |
| AT4G10730.1 | (oxM)KEL(pT)EELEVEK | X | x | Protein kinase family protein | |
| AT4G16970.1 | LLLSSGHPESVIDL(s)(s)K | X | x | Protein kinase family protein | |
| AT4G24740.1 | I(pT)AREALR | X | x | AFC2 (ARABIDOPSIS FUS3-COMPLEMENTING GENE 2) | |
| AT4G33080.1 | I(pS)VDDFELL(pT)IIGR | x | Protein kinase | ||
| AT4G35600.1 | VG(pS)GMIVAIK | x | CONNEXIN 32; Receptor-like cytoplasmic kinase | ||
| AT5G01020.1 | G(pY)IDDNLRVGLK | x | Protein kinase family protein | ||
| AT5G01020.1 | TTAPL(pS)WSR | X | x | Protein kinase family protein | |
| AT5G11400.1 | GYIDET(pT)FAPSR | X | x | Protein kinase-related | |
| AT5G18910.1 | GKQLTP(pS)(pT)R | X | Protein kinase family protein | ||
| AT5G51770.1 | G(pS)VLEVGNVVR | X | x | Protein kinase family protein | |
| AT5G57035.1 | MTNKFFELIGGAP(s)Y(s)(s)V(s)VAVK | x | Protein kinase family protein | ||
| Phosphatases | 3 | 1 | |||
| AT2G42810.1 | SHEVKDEG(pY)EVEHDGK | X | PP5.2 (PROTEIN PHOSPHATASE 5.2) | ||
| AT5G02400.1 | (pT)LFANLISNNNKPRLK | x | PLL2 (POL-LIKE 2) | ||
| AT5G23720.1 | SYDTGLM(pS)P(oxM)SDR | X | PHS1 (PROPYZAMIDE-HYPERSENSITIVE 1) | ||
| AT5G53000.1 | AIEEA(t)(t)(s)WYNDKPLR | X | TAP46 (2A PHOSPHATASE ASSOCIATED PROTEIN OF 46 KD) | ||
| PP2Cs | – | 2 | |||
| AT1G22280.1 | TDQAILSN(pS)SDLGR | x | Protein phosphatase 2C | ||
| AT1G34750.1 | TDQAILSH(pS)SDLGR | x | Protein phosphatase 2C |
The majority of the proteins in the largest plant kinase family, the family of receptor-like kinases (Shiu and Bleecker, 2001), remain functionally uncharacterized. In our study, RLK family members constituted a large proportion of the phosphorylated kinases, some of which were specifically phosphorylated under nitrate or ammonium resupply, while others were phosphorylated under both conditions (Table 2).
With regard to kinase substrates, a prominent sequence motif around the identified phosphorylation sites was the SP motif, which is indicative of a MAP kinase substrate (motifs are listed in Table S1). The phosphoproteins with the SP motif identified here were mainly transcription factors, but the identified phosphorylation site of nitrate reductase also included an SP motif and it has been suggested to be the substrate of MPK7 based on in vitro experiments (Feilner et al., 2005; Popescu et al., 2009).
Phosphorylation and activity of metabolic enzymes
In order to link observed changes in phosphorylation patterns with changes in enzyme activity, the activities of nitrate reductase and glutamine synthase were analyzed. Nitrate reductase was found to be phosphorylated at the regulatory site S534 (Bachmann et al., 1996), and phosphorylation decreased with the duration of nitrate resupply (Figure 6a). Phosphorylated nitrate reductase is known to be inactivated after 14-3-3 binding (Kaiser and Huber, 2001; Lambeck et al., 2010). Some metabolic enzymes (sucrose phosphate synthase, and possibly glutamine synthase) are phosphorylated, and are targeted for degradation after binding of 14-3-3 proteins (MacKintosh, 1998), but under some conditions, 14-3-3 binding can protect proteins (e.g. nitrate reductase) from degradation (Cotelle et al., 2000). We observed an increase in nitrate reductase activity (Vmax) over time in nitrate-supplied samples that corresponded with a decrease in nitrate reductase phosphorylation levels (Figure 6b). The activation state of nitrate reductase, calculated on the basis of the enzyme activity measured in the presence of magnesium compared with the maximal activity in the absence of magnesium in nitrate-resupplied seedlings, also increased with decreasing phosphorylation status (Figure 6c). In contrast, in ammonium-resupplied seedlings, nitrate reductase activity and activation status remained low, and higher phosphorylation was observed.
Figure 6.
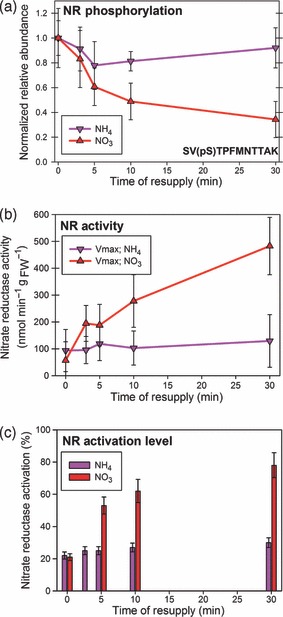
Nitrate reductase phosphorylation and activity in nitrate- and ammonium-resupplied seedlings. (a) Phosphorylation time course for S534. (b) Total nitrate reductase activity in the absence of magnesium. (c) Activation status of nitrate reductase in the presence of magnesium.
Glutamine synthase regulation is more complex. Plants have two glutamine synthase isoenzymes, plastidic GS2 and cytosolic GS1, which has multiple isoforms. Both isoenzymes can be phosphorylated (Finnemann and Schjoerring, 2000; Lima et al., 2006). In Brassica napus, phosphorylated GS1 is active and protected against degradation upon binding of 14-3-3 proteins (Finnemann and Schjoerring, 2000). GS1 isoform 1 expression is more dominant under low-nitrate conditions, while expression of GS1 isoform 2 increases under high-nitrate conditions (Lothier et al., 2011). GS1 isoform 1 has a high affinity for ammonium but GS1 isoform 2 has a low affinity for ammonium (Ishiyama et al., 2004). GS1 isoform 2 has a proposed role in nitrogen remobilization and ammonium detoxification under high-nitrogen growth conditions (Ishiyama et al., 2004). In our experiments, GS1 showed an increase in phosphorylation in nitrate-supplied seedlings, but the phosphorylation levels were almost unchanged in ammonium-supplied seedlings for isoforms 1 and 2. GS1 isoform 3 showed an increase in phosphorylation level in ammonium-supplied seedlings (Figure S4a–c). The total activity of glutamine synthase increased over time in both treatments, but reached higher levels in ammonium-supplied cells (Figure S4d).
Discussion
The aim of this study was to identify candidate phosphorylation sites involved in transduction of signals related to changes in external nitrogen availability. We were especially interested in characterization of fast and slow responses in protein phosphorylation. Therefore, we used a defined common reference point in the starvation/resupply experimental design, namely the nitrogen starvation status of the untreated seedlings. The time points chosen in this study allowed identification of early responses upon changes in external conditions. The shortest time point of 3 min was the fastest possible time point that allowed reproducible harvesting of plant material. However, there are indications also studies on plant receptors that externally induced phosphorylation responses occur within seconds (Schulze et al., 2010). Although a number of receptors and transporters were identified whose phosphorylation change peaked at 3 or 5 min of nitrogen resupply, some initial regulatory proteins may have been missed due to a transient response occurring in <3 min.
Under conditions of external changes in available nitrogen supply, plasma membrane proteins are expected to play a central role in recognition, uptake and transduction of this external nutrient signal. Only after nutrient uptake are effects on metabolism and transcriptional changes expected. In agreement with this hypothesis, an increasing proportion of cytosolic proteins were phosphorylated at the later time points of 10 and 30 min of nitrogen resupply. In contrast, the proportion of membrane proteins showing a transient change in phosphorylation was highest at 3 or 5 min of nitrogen resupply. We conclude that the proteins identified as showing changes in their phosphorylation status at early time points of nitrate or ammonium resupply are proteins that are either involved in regulation of nitrogen uptake, or candidates for recognition and transduction of nutritional signals. Fast phosphorylation changes for solute transporters have been reported for ammonium transporter inactivation (Lanquar et al., 2009; Loque et al., 2007), for regulation of pore gating by aquaporins (Tornroth-Horsefield et al., 2006) and for potassium channels (Lee et al., 2007). Phosphorylation has also been shown to be involved in regulation of nitrate uptake (Ho et al., 2009), but regulation of the major nitrate uptake protein NRT2;1 has so far only been described in context with the interacting protein NRT3.1 (NAR2.1) (Orsel et al., 2006; Yong et al., 2010), and the role of the change in phosphorylation observed here remains to be functionally elucidated. We hypothesize that, similar to NRT1.1, the high-affinity transporter NRT2.1 may be inactivated by dephosphorylation under a high external nitrogen concentration (3 mm).
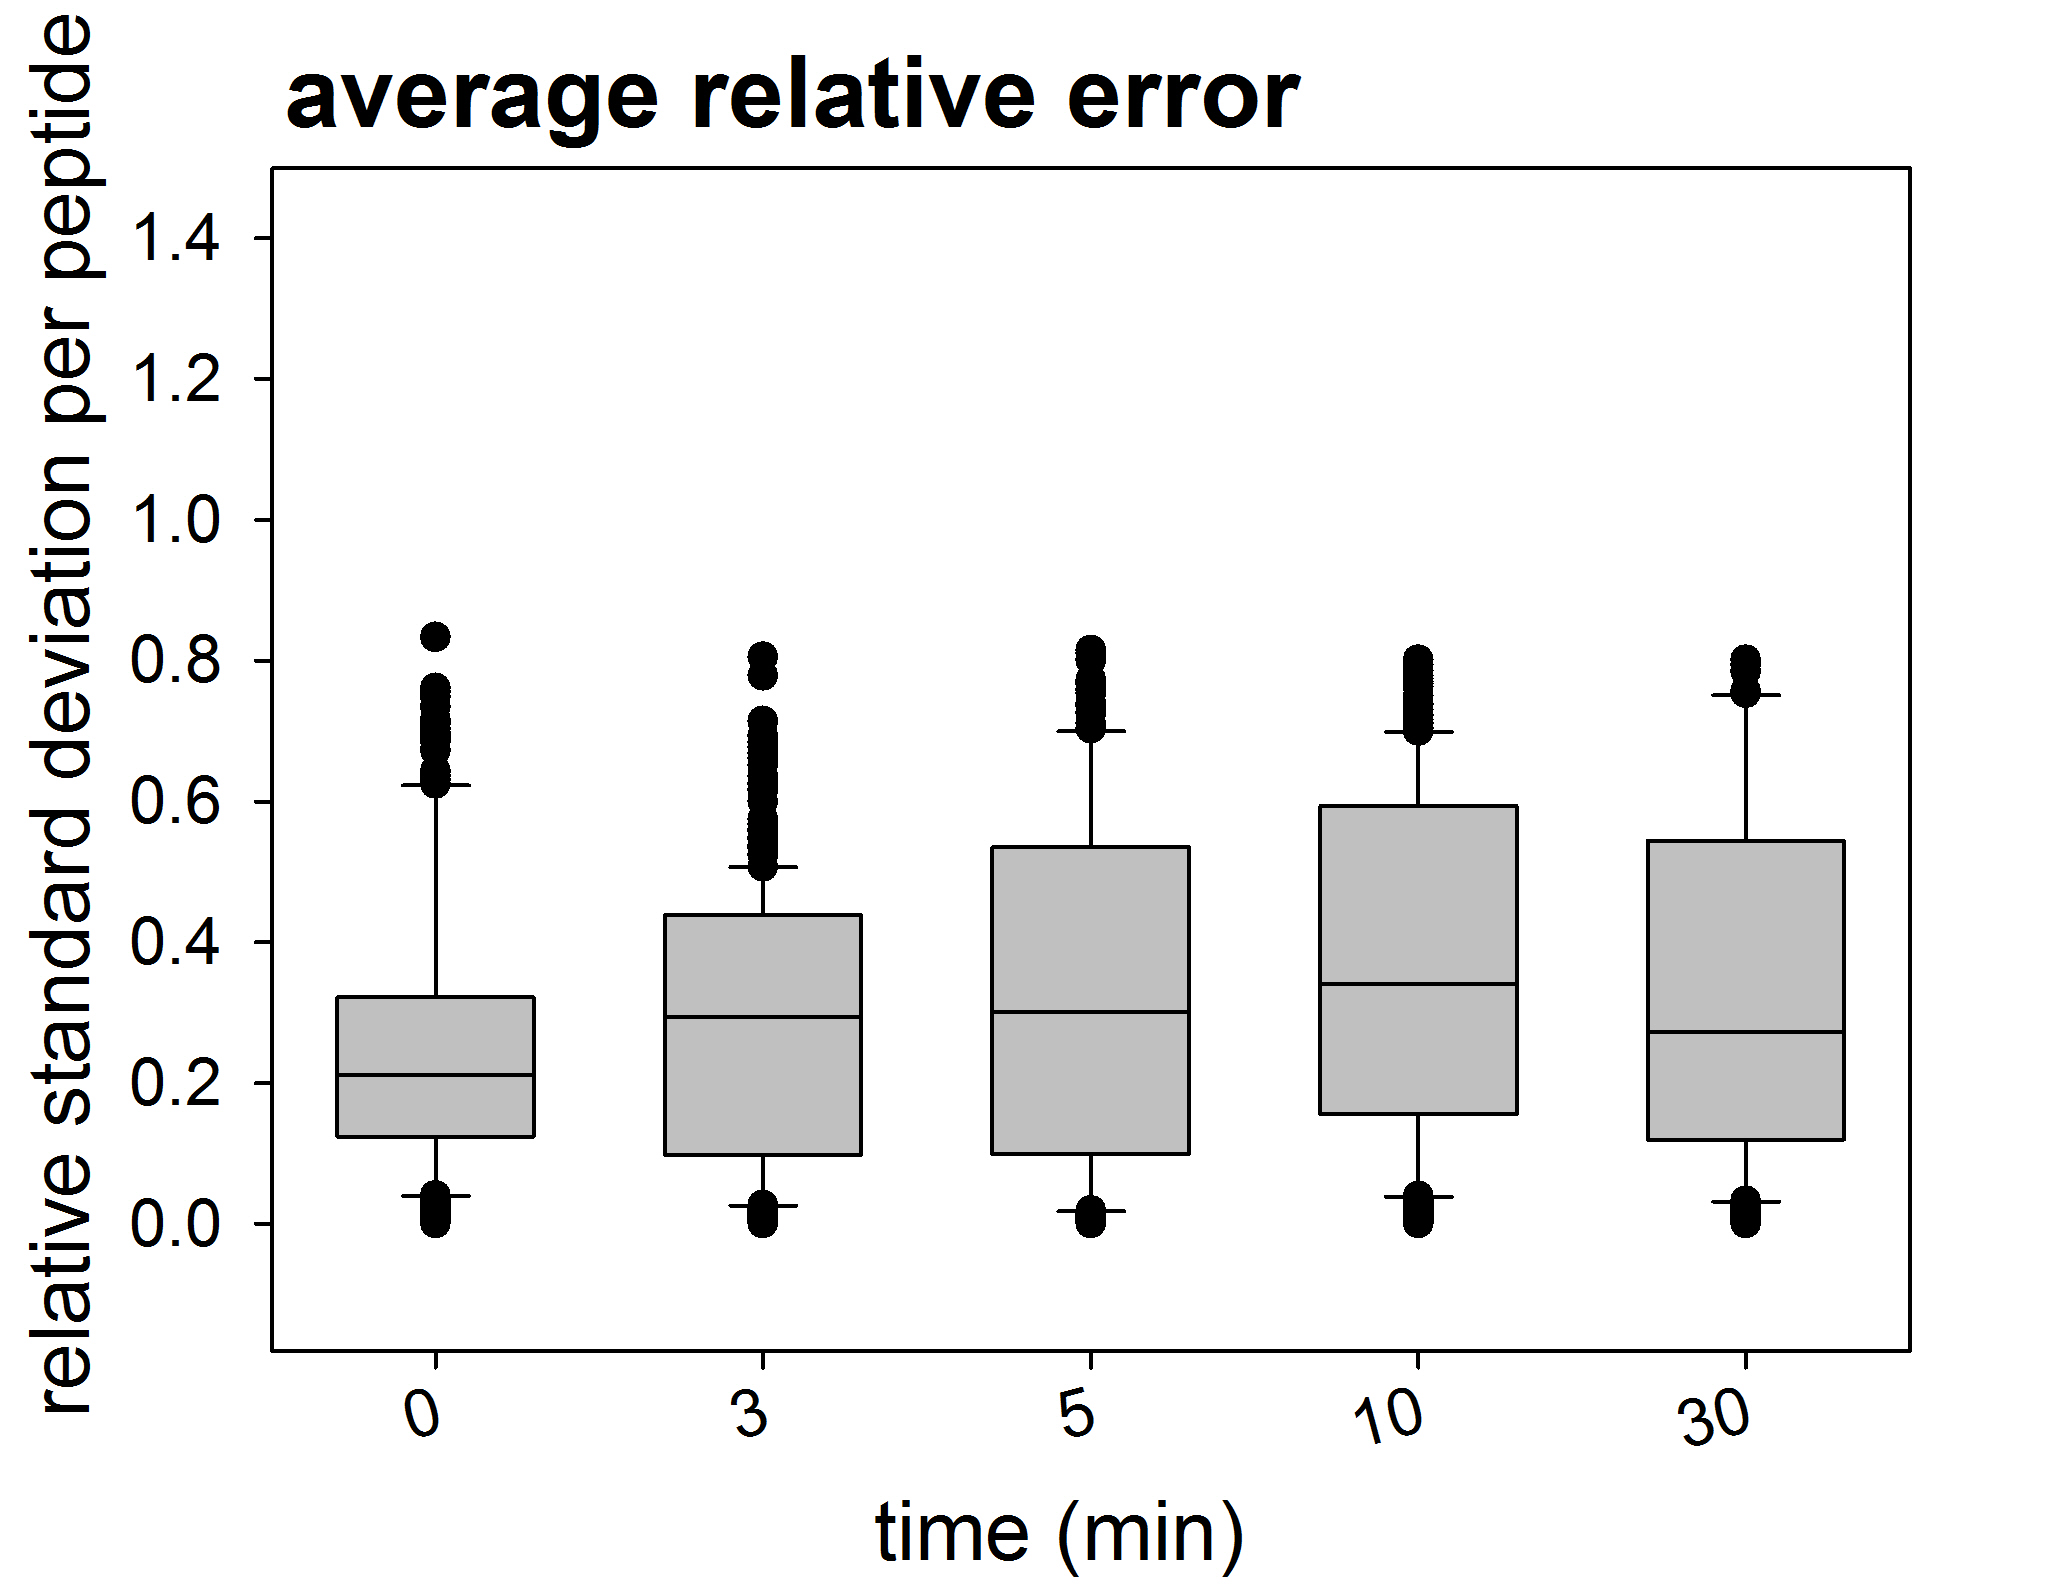
Quantification error and reproducibility
The relative standard deviation between biological replicates in the label-free quantitative analysis of phosphorylation time courses was found to be approximately 20% calculated on the basis of normalized ion intensities of phosphopeptides identified in multiple replicate experiments (Figure S5). Variation was lowest for nitrogen-starved seedlings (time point 0) and greatest for the shorter durations of nitrate, ammonium or KCl addition. All relative standard deviations are shown in the full list of phosphopeptides (Table S1). A few individual peptides showed very high between-experiment variation in nutrient-induced dynamic behavior, indicating that phosphorylation of these proteins may be unrelated to the stimulus applied in the experiments. In general, the standard deviations observed here are within the expected range for label-free quantification (Schulze and Usadel, 2010).
Quantitative coverage and amplitude of change
In the present study, over 1200 phosphorylation sites were identified with high confidence (Olsen et al., 2006) in approximately 800 proteins. However, only approximately 50% of these identified phosphorylation sites could be used for further robust quantitative analysis. This is because the majority of phosphorylation sites were identified at only one time point under one experimental condition. Although retention time correlation (Andersen et al., 2003; Foster et al., 2006) of identified parent ions across samples was used, not all missing values could be resolved. In public databases, 83% of all identified phosphorylation sites in plants were identified only under one particular condition, and a minority (5%) were found under more than three conditions (Durek et al., 2010). These observations can be explained by (i) phosphorylation is indeed specific to particular experimental conditions or tissues, (ii) due to the stochastic nature of data-dependent acquisition in proteomic experiments, the overlap between identified peptides even for technical replicates on LTQ-Orbitrap instruments is between 35 and 60% (Tabb et al., 2010), and (iii) false-positive phosphorylation site identifications are more likely among ‘single’ identifications. The latter conclusion is supported by the positive correlation between high phosphorylation site prediction scores and the number of experiments identifying a particular phosphorylation site (Durek et al., 2010). Furthermore, we conclude that we may have identified only a subset of the possible nitrogen-induced phosphorylation sites, as different enrichment methods result in identification of distinct subsets of the phosphoproteome (Bodenmiller et al., 2007).
In the dataset presented here, we observed significant changes in the phosphorylation level of between 20 and 80%. However, due to the nature of the quantification applied here, we do not know the absolute stoichiometry of the observed phosphorylation changes. There are examples indicating that a change in phosphorylation level of approximately 20–50% can have a biological effect at overall low stoichiometry. In mammalian cells, Akt phosphorylation has a low stoichiometry, with only 1.5–5% of all molecules being phosphorylated at two different sites. Inhibition of a downstream signaling pathway leads to strong changes in the Akt phosphorylation level although the overall phosphorylation stoichiometry remains low. However, these changes at low absolute level were sufficient to trigger a cellular response (Atrih et al., 2010). In contrast, responses may be induced by a low overall change in phosphorylation at a generally high phosphorylation stoichiometry. For example, the phosphorylation stoichiometry of some photosynthetic proteins in thylakoids is quite high in both dark- and light-adapted plants, and changes by only approximately 10% during a day/night cycle (Vener et al., 2001).
Thus, despite the limitations in the unbiased phosphoproteomic ‘discovery’ experiments discussed above, the nitrate- and ammonium-induced dynamic phosphoproteome presented here provides important information for further in-depth study of nutrient-related signaling pathways. Known key phosphorylation sites of nitrogen assimilatory enzymes and important pathway components such as transporters and proton pumps have been reliably identified and quantified. In addition, novel candidate proteins are presented that may contribute to understanding nutrient-induced signaling. In addition, our dataset clearly goes beyond static identification of phosphorylation sites, instead providing a time-resolved phosphorylation pattern for almost 600 proteins. This information may be crucial during the task of pinpointing potential regulatory phosphorylation sites.
Comparison with gene expression studies
Many studies have systematically investigated changes in gene expression during starvation/resupply experiments (Krouk et al., 2010; Morcuende et al., 2007; Osuna et al., 2007; Scheible et al., 1997a). Putative regulatory elements were identified and co-expression analysis led to definition of regulatory networks. Recently, very early nitrate-induced transcript changes have been defined that affect mainly the translation machinery (ribosomal proteins) or signaling components, and that are clearly distinct from later transcriptional changes affecting nitrate transport and metabolism (Krouk et al., 2010).
Comparing our results on proteins with nitrogen-induced phosphorylation changes with results obtained by transcriptional analysis after short- and long-term nitrate resupply after starvation revealed a rather small overlap (Figure S6). Only five proteins showed overlap with proteins displaying very early transcriptional regulation upon nitrate resupply (3 and 6 min) (Krouk et al., 2010). Among these were a protein kinase and two transcriptional regulators. Another three proteins, namely the nitrate transporter NRT2;1 (At1g08090.1), a lipase (At1g73920.1) and a receptor kinase (At2g23300.1), showed a response to nitrate resupply at the level of protein phosphorylation as well as medium-term (9–30 min) and long-term (3 h) transcriptional changes.
The generally low overlap is not surprising as the approaches focus on complementary levels of regulation (Carpentier et al., 2008). The changes observed at the post-translational level may not be reflected in alterations in gene expression. Moreover, regulation at the post-translational and post-transcriptional levels does not require de novo protein synthesis, and thus is faster and allows adaptations to short-term environmental changes. Transcriptional regulation has been suggested to provide more long-term adaptive potential (Piques et al., 2009). Our findings indicate that protein phosphorylation provides a layer of regulation parallel to early transcriptional changes, and, in some cases, specific proteins/genes may be affected at both regulatory levels. In general, our finding that early phosphorylation events particularly affect signaling proteins and transcription factors while later phosphorylation responses affect nitrogen transport and metabolism is in line with similar findings in high-resolution time-course analyses of nitrate-induced gene transcription (Krouk et al., 2010). In the transcription study, genes induced at 3 and 5 min were also functionally distinct from the typical ‘nitrogen’ responses occurring at later time points.
In conclusion, our study provides important insights into the dynamics of individual phosphorylation sites under conditions of nitrogen starvation and resupply using two nitrogen sources. Our work contributes to understanding of the complex regulatory patterns with respect to very short-term changes in external nutritional conditions of the plant. We showed that there are specific and common responses for the two nitrogen sources (nitrate and ammonium). The differences in phosphorylation dynamics were most prominent with regard to signal transduction, and at later time points merged to common regulation sites of enzyme activities. Despite the limitations of unbiased phosphoproteomic analysis discussed above, our results indicate new candidate protein phosphorylation sites that are possibly involved in nitrogen sensing and regulation of transport. These candidate phosphorylation sites were defined based on their dynamic phosphorylation patterns rather than merely identification of phosphopeptides. In-depth future study of these candidates may close the gap in knowledge between sensing at the protein level and the gene expression response at the transcriptional level.
Experimental Procedures
Seedling liquid culture
To perform the starvation/resupply experiments, seedlings were grown in axenic liquid culture as described previously (Scheible et al., 2004). Surface-sterilized seeds were incubated for 2 days at 4°C in the dark in standard growth medium containing 2 mm KNO3, 1 mm NH4NO3 and 1 mm glutamine (Scheible et al., 2004), and then under continuous light (20°C, 80 μE sec−1 m−2) for 14 days. Then seedlings were starved for 2 days by changing the growth medium to starvation medium containing very low amounts of nitrogen (0.15 mm KNO3 and 5 μm NH4NO3) (Scheible et al., 2004). The medium contained 0.5% sucrose under all conditions.
Resupply of nitrogen was performed by addition of KNO3 or NH4Cl for 3, 5, 10 or 30 min to a final concentration of 3 mm. Resupply of KCl served as an ionic control. Seedlings were harvested by suction over a filter plate, drained from the remaining liquid on paper towels, and frozen immediately in liquid nitrogen.
In total, four biological replicate time-course experiments were performed across the whole time series for nitrate and ammonium resupply, and two sets of experiments were performed for KCl resupply.
Analysis of marker gene expression
RNA was extracted from 200 mg of powdered seedlings using a plant RNA mini kit (Invitek, http://www.invitek.de/) according to the manufacturer’s instructions. Removal of residual DNA, cDNA synthesis and quantitative RT-PCR using an ABI PRISM 7900 HT sequence detection system (http://www.appliedbiosystems.com/) and SYBR Green (Applied Biosystems, http://www.appliedbiosystems.com) were performed as described previously (Le et al., 2008).
The following genes were used as marker genes for nitrogen responses in seedlings (Scheible et al., 2004): At3g03910, which encodes a putative glutamate dehydrogenase, was used as a marker for nitrogen starvation, and At4g32950, which encodes a putative protein phosphatase 2C, was used as a marker for nitrogen resupply. Both genes are expected to be up-regulated during nitrogen starvation. Ubiquitin (UBQ) was used as a control gene. Data analysis was performed using StepOne 2.0 software (ABI-Sciex). In order to compare data between experiments, Ct values were normalized to the value for ubiquitin [Ct(gene of interest)−Ct(UBQ)].
Nitrate reductase activity
Nitrate reductase activity was analyzed in a microtiter plate assay as described previously (Gibon et al., 2004). Frozen plant material was powdered using a Retsch mill (http://www.retsch.com/), and protein was extracted in 250 mm HEPES/KOH buffer, pH 7.5, 0.25% Triton X-100, 100 mm KNO3. The extraction buffer was supplemented with phosphatase inhibitors (2 mm NaVO3, 50 mm NaF, 50 μm cantharidin, 2 mm leupeptin). In order to measure Vmax, the extraction buffer additionally contained 10 mm EDTA. To determine the nitrate reductase activation state (Vact), the assay was performed in the presence of 10 mm Mg2+ acetate to assess the activity of the non-phosphorylated form of nitrate reductase (Botrel and Kaiser, 1997).
The assay mix contained protein extract together with 2 mm FAD, 10 mm NaMoO4, 500 mm dithiothreitol and 625 μm NADH. The reaction was stopped after 20 and 40 min by adding Zn acetate (200 mm) and phenylmethanesulfonylfluoride (0.2 mm). Nitrite production was detected at 540 nm by a colorimetric assay using N(1-naphtyl)ethylendiamine dihydrochloride.
The activation state of the enzyme was then calculated as Vact/Vmax, expressed as a percentage (Botrel and Kaiser, 1997).
Plasma membrane preparation
All protein extractions were performed in the presence of phosphatase inhibitors (50 mm NaF, 1 mm Na3VO4, 4 μm leupeptin, 1 mm benzamidine, 0.03 μm microcystin). Plasma membranes were purified from the microsomal pellet (100 000 g) using a two-phase system of dextran and polyethylene glycol as described previously (Kierszniowska et al., 2009) Plasma membrane vesicles were inverted using Brij-58 (Sigma Aldrich, http://www.sigmaaldrich.com), and intracellular protein parts were digested using trypsin (Nühse et al., 2003).
Fractionation of soluble proteins
The supernatant of the first ultra-centrifugation step during plasma membrane preparation was precipitated using four volumes of ice-cold acetone. Pellets were resolved in 6 m urea and 2 m thiourea, and the protein concentration was measured using the Bradford assay. Then 400 μg of protein was digested with trypsin and acidified with acetic acid as described previously (Niittyläet al., 2007).
Modular fractionation tips using strong cation exchange (SCX) and C18 (a polymer of 18 carbon atoms) (Varian, http://www.varian.com) were used for cation-exchange fractionation of soluble proteins (Ishihama et al., 2006). Two cation exchange fractions were collected after elution with 70 mm ammonium formate and 30% acetonitrile and after elution with 1 m ammonium formate and 30% acetonitrile.
Phosphopeptide enrichment
Phosphopeptides were enriched over TiO2 (Larsen et al., 2005). Titanium enrichment was performed in batch mode using 10 mg TiO2 powder with 200 μg of protein. Beads were washed using 70% acetonitrile, 20 mg ml−1 2,5-dihydroxybenzoic acid and 0.1% trifluoroacetic acid (TFA). Tryptic digests were diluted in 80% acetonitrile, 2 mg ml−1 DHB and 0.1% TFA, and loaded onto TiO2 beads. After shaking, the supernatant was removed and the TiO2 was washed with 10% acetonitrile and 0.1% TFA and then with 80% acetonitrile and 0.1% TFA. Phosphopeptides were eluted using 70% acetonitrile, 0.5% NH4OH and 0.1% TFA. The eluate was acidified to pH 2 and concentrated.
LC-MS/MS
Tryptic peptide mixtures were analyzed by LC-MS/MS using a nanoflow Easy-nLC HPLC system (Thermo Scientific, http://www.thermo.com) and an LTQ-Orbitrap hybrid mass spectrometer (Thermo Scientific) as the mass analyzer. For liquid chromatography, 0.5% acetic acid was used as aqueous phase (solution A), and 0.5% acetic acid, 80% acetonitrile (solution B) were used. Peptides were eluted from a 75 mm analytical column using a two-step gradient (71 min 5% solution B to 30% solution B, 14 min to 60% solution B, 10 min to 90% solution B), and sprayed directly into the LTQ-Orbitrap mass spectrometer. Peptides were identified by information-dependent acquisition of fragmentation spectra of multiple-charged peptides. Up to five information-dependent MS/MS spectra were acquired in the linear ion trap for each full scan spectrum acquired at 60 000 full width at half maximum (FWHM) resolution in the mass spectrometer. The overall cycle time was approximately 1 sec. The complete range for full scans was split into two segments: 300–1500 and 950–1850 m/z. For fragmentation, CID was chosen, multi-stage activation (Schroeder et al., 2004) was enabled, and the collision energy was 35 eV.
Raw data processing
Fragment MS/MS spectra from raw files were extracted as DTA files and then merged to peak lists using default settings of DTASuperCharge version 1.18 (http://msquant.alwaysdata.net) with a tolerance for precursor ion detection of 50 ppm. The DTA files for one experiment were combined into a single file that was used for the database search. Fragmentation spectra were searched against a non-redundant Arabidopsis protein database (tair8, version 2008-04; 31 921 entries; http://www.arabidopsis.org) using the Mascot algorithm (version 2.2.0; Matrix Science, http://www.matrixscience.com). The database contained the full Arabidopsis proteome and commonly observed contaminants (human keratin, trypsin and lysyl endopeptidase). The following search parameters were used: trypsin as cleaving enzyme, peptide mass tolerance 10 ppm, MS/MS tolerance 0.8 Da, one missed cleavage allowed. Methionine oxidation and threonine, serine and tyrosine phosphorylation were chosen as variable modifications. For data derived from soluble protein fractions, carbamidomethylation of cysteine was set as a fixed modification in addition to the above-described variable modifications. Only peptides with a length of more than five amino acids were considered.
Using the above criteria for protein identification, the rate of false peptide sequence assignment as determined by the ‘decoy database’ function implemented in Mascot version 2.2.0 was 2.5% at the 95% confidence level. Peptide assignment to proteins used the Mascot default settings, assigning each redundant peptide to the highest-scoring protein. For proteins identified by non-proteotypic peptides only, all possible isoforms are listed. Isoforms of protein only appear in tables as a separate protein entry if they were assigned at least one unique peptide.
Phosphopeptide identification
For phosphopeptide scoring and determination of modification sites, post-translational modification (PTM) scores (Olsen et al., 2006) were calculated using MSQuant version 1.4.3 (http://msquant.alwaysdata.net). All phosphopeptides were checked manually by comparison of experimentally identified masses with the theoretically expected masses for the fragments. Phosphopeptides were accepted if the PTM score was >40 and/or site-determining b or y ions were present. Annotated spectra of all phosphopeptides are shown in Figure S7. All phosphopeptides, including their fragment spectra, have been submitted to the phosphorylation site database PHOSPHAT (http://phosphat.mpimp-golm.mpg.de) and are publicly available.
Label-free peptide quantification
Label-free relative quantification of phosphorylation was performed as described previously (Steen et al., 2005) and as applied previously (Niittyläet al., 2007). Retention time alignment of fragmented ion mass to charge ratios was also used to obtain quantitative information for these ions from samples in which no fragment spectra were acquired (Andersen et al., 2005; Foster et al., 2006). Ion intensity extraction from raw data files as well as retention time alignment were performed using MSQuant version 1.4.3. For ion intensities of each non-phosphopeptide, the mean ion intensity across the five time points was calculated and used for normalization. Subsequently, for each phosphopeptide sequence, the mean of normalized intensities was calculated from biological replicates based on the individual phosphopeptide m/z species, and this value was used to calculate ratios between treated (time points 3, 5, 10 and 30 min) and untreated (time point 0) samples. For each protein, only proteotypic non-phosphopeptides were used for normalization. If no unphosphorylated peptides were identified for a given protein, the mean of all identified non-phosphopeptides was used. Normalized ion intensities were standardized to values between 0 and 1 across the time series by dividing the ion intensities of each peptide species (each m/z) by the maximum value over the time series of each peptide. This allowed inclusion of peptides in the quantitative analysis for which no ion intensities were determined at reference time point 0.
Peptides conserved in multiple members of a protein family were identified using the ‘show subsets’ option in Mascot, and the non-peptides present in multiple proteins were excluded from quantitative analysis. Phosphopeptides matching multiple proteins are indicated in Table S1.
Bioinformatic analysis
Information about gene function, structure and annotation was retrieved from the following resources: tair (Swarbreck et al., 2008), aramemnon (Schwacke et al., 2003) and PhosPhAt (Durek et al., 2010). For functional annotation. the MapMan functional classification scheme was used (Thimm et al., 2004).
K-means clustering was performed using Multi-Experiment Viewer 4.0 (http://www.tm4.org/mev/). Standardized time-course profiles of phosphopeptides were subjected to the analysis if quantitative information for at least four time points was obtained. Euclidean was used as a distance matrix, and 16 clusters were formed. Over-representation analysis was performed using a Fisher exact test, with the total number of identified proteins as a reference set. P-values were corrected for multiple testing (Benjamini and Hochberg, 1995).
Acknowledgments
We thank Dr Dirk Walther for helpful discussions and Kerstin Zander for excellent technical assistance in harvesting, plasma membrane preparation and enzyme activity assays. Dmitri Schmidt is acknowledged for assistance in targeted mass spectrometry. This work was funded by the Emmy Noether Program of the Deutsche Forschungsgemeinschaft to W.X.S.
Supporting information
Figure S1. Venn diagram of the distribution phosphopeptides to the different treatments. (a) All unique phosphopeptides sequences identified in the different experiments. (b) Unique phosphopeptides that could be quantified at least at three different time points.
Figure S2. NRT2.1 phosphorylation and nitrateuptake (a) Targeted analysis of NRT2.1 phosphorylation underdifferent concentrations of nitrate resupply for 10 min.Normalized ion intensities of the phosphorylated form (red) andnon-phosphorylated form (gray) are plotted as average of threebiological replicates (b) 15N-Nitrate uptake ofseedlings resupplied with different concentrations of nitrate underconditions of high- and low-affinity nitrate uptake.
Figure S3. Venn diagram of the identified phosphopeptides under nitrate and ammonium resupply and the respective non-phosphorylated peptides identified under the same conditions in the same respective samples.
Figure S4. Phosphorylation time course profiles for phosphopeptides identified from glutamine synthase 1 isoforms and total GS enzymes activitiy. (a) Phosphorylation time course for GS1.1 (b) phosphorylation time course for GS1.2, (c) phosphorylation time course for GS1.3 (d) Total activity of glutamine synthase in nitrate and ammonium resupplied seedlings.
Figure S5. Boxplot of the relative standard deviation of all quantified peptides averaged over all 12 replicated experiments.
Figure S6. Overlap of proteins found with change in phosphorylation and with significant changes in transcript levels upon nitrate resupply after nitrogen starvation.
Figure S7. All phosphopeptide spectra as exported from the respective entry in the public database PhosPhAt (http://phosphat.mpimp-golm.mpg.de).
Table S1. List of all phosphopeptides. The first worksheet contains the mass spectrometric evidence for each phosphopeptide by listing mass to charge ratio, MASCOT identification score, PTM score. The second worksheet contains the normalized ion intensities used for quantitation as well as additional information about sequence motifs, or putative MAP-kinase substrates.
Appendix S1. Glutamine synthase activity; targeted analysis of protein phosphorylation by single reaction monitoring; nitrate uptake assays.
As a service to our authors and readers, this journal provides supporting information supplied by the authors. Such materials are peer-reviewed and may be re-organized for online delivery, but are not copy-edited or typeset. Technical support issues arising from supporting information (other than missing files) should be addressed to the authors.
References
- Andersen JS, Wilkinson CJ, Myoru T, Mortensen P, Nigg EA, Mann M. Proteomic characterization of the human centrosome by protein correlation profiling. Nature. 2003;426:570–574. doi: 10.1038/nature02166. [DOI] [PubMed] [Google Scholar]
- Andersen JS, Lam YW, Leung AKL, Ong S-E, Lyon CE, Lamond AI, Mann M. Nucleolar proteome dynamics. Nature. 2005;433:77–83. doi: 10.1038/nature03207. [DOI] [PubMed] [Google Scholar]
- Atrih A, Turnock D, Sellar G, Thompson A, Feuerstein G, Ferguson MAJ, Huang JT-J. Stoichiometric quantification of Akt phosphorylation using LC-MS/MS. J. Proteome Res. 2010;9:743–751. doi: 10.1021/pr900572h. [DOI] [PMC free article] [PubMed] [Google Scholar]
- Bachmann M, Shiraishi N, Campbell WH, Yoo BC, Harmon AC, Huber SC. Identification of Ser-543 as the major regulatory phosphorylation site in spinach leaf nitrate reductase. Plant Cell. 1996;8:505–517. doi: 10.1105/tpc.8.3.505. [DOI] [PMC free article] [PubMed] [Google Scholar]
- Benjamini Y, Hochberg Y. Controlling the false discovery rate: a practical and powerful approach to multiple testing. J. R. Stat. Soc. Series B. 1995;57:289–300. [Google Scholar]
- Benschop JJ, Mohammed S, O’Flaherty M, Heck AJ, Slijper M, Menke FL. Quantitative phospho-proteomics of early elicitor signalling in Arabidopsis. Mol. Cell Proteomics. 2007;6:1705–1713. doi: 10.1074/mcp.M600429-MCP200. [DOI] [PubMed] [Google Scholar]
- Bodenmiller B, Mueller LN, Mueller M, Domon B, Aebersold R. Reproducible isolation of distinct, overlapping segments of the phosphoproteome. Nat. Methods. 2007;4:231–237. doi: 10.1038/nmeth1005. [DOI] [PubMed] [Google Scholar]
- Botrel A, Kaiser WM. Nitrate reductase activation state in barely roots in relation to the energy and carbohydrate status. Planta. 1997;201:496–501. doi: 10.1007/s004250050094. [DOI] [PubMed] [Google Scholar]
- Carpentier SC, Coemans B, Podevin N, Laukens K, Witters E, Matsumura H, Terauchi R, Swennen R, Panis B. Functional genomics in a non-model crop: transcriptomics or proteomics? Physiol. Plant. 2008;133:117–130. doi: 10.1111/j.1399-3054.2008.01069.x. [DOI] [PubMed] [Google Scholar]
- Chen Y, Höhenwarter W, Weckwerth W. Comparative analysis of phytohormone-responsive phosphoproteins in Arabidopsis thaliana using TiO2-phosphopeptide enrichment and MAPA. Plant J. 2010;63:1–17. doi: 10.1111/j.1365-313X.2010.04218.x. [DOI] [PubMed] [Google Scholar]
- Cotelle V, Meek SE, Provan F, Milne FC, Morrice N, MacKintosh C. 14-3-3s regulate global cleavage of their diverse binding partners in sugar-starved Arabidopsis cells. EMBO J. 2000;19:2869–2876. doi: 10.1093/emboj/19.12.2869. [DOI] [PMC free article] [PubMed] [Google Scholar]
- Crawford NM. Nitrate: nutrient and signal for plant growth. Plant Cell. 1995;7:859–868. doi: 10.1105/tpc.7.7.859. [DOI] [PMC free article] [PubMed] [Google Scholar]
- Durek P, Schmidt R, Heazlewood JL, Jones A, MacLean D, Nagel A, Kersten B, Schulze WX. PhosPhAt: the Arabidopsis thaliana phosphorylation site database. An update. Nucleic Acids Res. 2010;38:D828–D834. doi: 10.1093/nar/gkp810. [DOI] [PMC free article] [PubMed] [Google Scholar]
- Feilner T, Hultschig C, Lee JM, et al. High throughput identification of potential Arabidopsis mitogen-activated protein kinases substrates. Mol. Cell Proteomics. 2005;4:1558–1568. doi: 10.1074/mcp.M500007-MCP200. [DOI] [PubMed] [Google Scholar]
- Filleur S, Dorbe MF, Cerezo M, Orsel M, Granier F, Gojon A, Daniel-Vedele F. An Arabidopsis T-DNA mutant affected in nrt2 genes is impaired in nitrate uptake. FEBS Lett. 2001;489:200–224. doi: 10.1016/s0014-5793(01)02096-8. [DOI] [PubMed] [Google Scholar]
- Finnemann J, Schjoerring JK. Post-translational regulation of cytosolic glutamine synthetase by reversible phosphorylation and 14-3-3 protein interaction. Plant J. 2000;24:171–181. doi: 10.1046/j.1365-313x.2000.00863.x. [DOI] [PubMed] [Google Scholar]
- Foster LJ, de Hoog CL, Zhang Y, Zhang Y, Xie X, Mootha VK, Mann M. A mammalian organelle map by protein correlation profiling. Cell. 2006;125:187–199. doi: 10.1016/j.cell.2006.03.022. [DOI] [PubMed] [Google Scholar]
- Fragoso S, Espíndola L, Páez-Valencia J, Gamboa A, Camacho Y, Martínez-Barajas E, Coello P. SnRK1 isoforms AKIN10 and AKIN11 are differentially regulated in Arabidopsis plants under phosphate starvation. Plant Physiol. 2009;149:1906–1916. doi: 10.1104/pp.108.133298. [DOI] [PMC free article] [PubMed] [Google Scholar]
- Gazzarrini S, Lejay L, Gojon A, Nonnemann O, Frommer WB, von Wirén N. Three functional transporters for constitutive, diurnally regulated, and starvation-induced uptake of ammonium into Arabidopsis roots. Plant Cell. 1999;11:937–947. doi: 10.1105/tpc.11.5.937. [DOI] [PMC free article] [PubMed] [Google Scholar]
- Gibon Y, Bläsing OE, Hannemann J, Carillo P, Höhne M, Hendriks JH, Palacios N, Cross J, Selbig J, Stitt M. A Robot-based platform to measure multiple enzyme activities in Arabidopsis using a set of cycling assays: comparison of changes of enzyme activities and transcript levels during diurnal cycles and in prolonged darkness. Plant Cell. 2004;16:3304–3325. doi: 10.1105/tpc.104.025973. [DOI] [PMC free article] [PubMed] [Google Scholar]
- Gifford ML, Dean A, Gutierrez RA, Coruzzi GM, Birnbaum KD. Cell-specific nitrogen responses mediate developmental plasticity. Proc. Natl. Acad. Sci. USA. 2008;105:803–808. doi: 10.1073/pnas.0709559105. [DOI] [PMC free article] [PubMed] [Google Scholar]
- Girin T, Lejay L, Wirth J, Widiez T, Palenchar PM, Nazoa P, Touraine B, Gojon A, Lepetit M. Identification of a 150 bp cis-acting element of the AtNRT2.1 promoter involved in the regulation of gene expression by the N and C status of the plant. Plant Cell Environ. 2007;30:1366–1380. doi: 10.1111/j.1365-3040.2007.01712.x. [DOI] [PubMed] [Google Scholar]
- Girin T, El-Kafafi E-S, Widiez T, Erban A, Hubberten HM, Kopka J, Höfgen R, Gojon A, Lepetit M. Identification of Arabidopsis mutants impaired in the systemic regulation of root nitrate uptake by the nitrogen status of the plant. Plant Physiol. 2010;153:1250–1260. doi: 10.1104/pp.110.157354. [DOI] [PMC free article] [PubMed] [Google Scholar]
- Gojon A, Nacry P, Davidian JC. Root uptake regulation: a central process for NPS homeostasis in plants. Curr. Opin. Plant Biol. 2009;12:328–338. doi: 10.1016/j.pbi.2009.04.015. [DOI] [PubMed] [Google Scholar]
- Gutierrez RA, Lejay LV, Dean A, Cjiaromonte F, Shasha DE, Coruzzi GM. Qualitative network models and genome-wide expression data define carbon/nitrogen-responsive molecular machines in Arabidopsis. Genome Biol. 2007;8:R7. doi: 10.1186/gb-2007-8-1-r7. [DOI] [PMC free article] [PubMed] [Google Scholar]
- Halford NG, Hey SJ. Snf1-related protein kinases (SnRKs) act within an intricate network that links metabolic and stress signalling in plants. Biochem. J. 2009;419:247–259. doi: 10.1042/BJ20082408. [DOI] [PubMed] [Google Scholar]
- Ho C-H, Lin SH, Hu HC, Tsay YF. CHL1 functions as a nitrate sensor in plants. Cell. 2009;138:1184–1194. doi: 10.1016/j.cell.2009.07.004. [DOI] [PubMed] [Google Scholar]
- Ishihama Y, Rappsilber J, Mann M. Modular stop and go extraction tips with stacked disks for parallel and multidimensional peptide fractionation in proteomics. J. Proteome Res. 2006;5:988–994. doi: 10.1021/pr050385q. [DOI] [PubMed] [Google Scholar]
- Ishiyama K, Inoue E, Watanabe-Takahashi A, Obara M, Yamaya T, Takahashi H. Kinetic properties and ammonium-dependent regulation of cytosolic isoenzymes of glutamine synthetase in Arabidopsis. J. Biol. Chem. 2004;279:16598–16605. doi: 10.1074/jbc.M313710200. [DOI] [PubMed] [Google Scholar]
- Kaiser WM, Huber SC. Post-translational regulation of nitrate reductase: mechanism, physiological relevance and environmental triggers. J. Exp. Bot. 2001;52:1981–1989. doi: 10.1093/jexbot/52.363.1981. [DOI] [PubMed] [Google Scholar]
- Kierszniowska S, Seiwert B, Schulze WX. Definition of Arabidopsis sterol-rich membrane microdomains by differential treatment with methyl-β-cyclodextrin and quantitative proteomics. Mol. Cell Proteomics. 2009;8:612–623. doi: 10.1074/mcp.M800346-MCP200. [DOI] [PMC free article] [PubMed] [Google Scholar]
- Kline KG, Barrett-Wilt GA, Sussman MR. In planta changes in protein phosphorylation induced by the plant hormone abscisic acid. Proc. Natl. Acad. Sci. USA. 2010;107:15986–15991. doi: 10.1073/pnas.1007879107. [DOI] [PMC free article] [PubMed] [Google Scholar]
- Krapp A, Berthomé R, Orsel M, Mercey-Boutet S, Yu A, Castaings L, Elfthieh S, Major H, Renou JP, Daniel-Vedele F. Arabidopsis roots and shoots show distinct temporal adaptation pattern towards N starvation. Plant Physiol. 2011;157:1255–1282. doi: 10.1104/pp.111.179838. [DOI] [PMC free article] [PubMed] [Google Scholar]
- Krouk G, Mirowski P, LeCun Y, Shasha DE, Coruzzi GM. Predictive network modeling of the high-resolution dynamic plant transcriptome in response to nitrate. Genome Biol. 2010;11:R123. doi: 10.1186/gb-2010-11-12-r123. [DOI] [PMC free article] [PubMed] [Google Scholar]
- Krouk G, Ruffel S, Gutierrez RA, Gojon A, Crawford NM, Coruzzi GM, Lacombe B. A framework integrating plant growth with hormones and nutrients. Trends Plant Sci. 2011;16:178–182. doi: 10.1016/j.tplants.2011.02.004. [DOI] [PubMed] [Google Scholar]
- Lambeck I, Chi JC, Krizowski S, Müller S, Mehlmer N, Teige M, Fischer K, Schwarz G. Kinetic analysis of 14-3-3-inhibited Arabidopsis thaliana nitrate reductase. Biochemistry. 2010;49:8177–8186. doi: 10.1021/bi1003487. [DOI] [PubMed] [Google Scholar]
- Lanquar V, Loque D, Hörmann F, Yuan L, Bohner A, Engelsberger WR, Lalonde S, Schulze WX, Von Wiren N, Frommer WB. Feedback inhibition of ammonium uptake by a phospho-dependent allosteric mechanism in Arabidopsis. Plant Cell. 2009;21:3610–3622. doi: 10.1105/tpc.109.068593. [DOI] [PMC free article] [PubMed] [Google Scholar]
- Larsen MR, Thingholm TE, Jensen ON, Roepstorff P, Jorgensen TJD. Highly selective enrichtment of phosphorylated peptides from peptide mixtures using titanium dioxide microcolumns. Mol. Cell Proteomics. 2005;4:873–886. doi: 10.1074/mcp.T500007-MCP200. [DOI] [PubMed] [Google Scholar]
- Le MQ, Engelsberger WR, Hincha DK. Natural genetic variation in acclimation capacity at sub-zero temperatures after cold acclimation at 4°C in different Arabidopsis thaliana accessions. Cryobiology. 2008;57:104–112. doi: 10.1016/j.cryobiol.2008.06.004. [DOI] [PubMed] [Google Scholar]
- Lee SC, Lan WZ, Kim BG, Li L, Cheong YH, Pandey GK, Lu G, Buchanan BB, Luan S. A protein phosphorylation/dephosphorylation network regulates a plant potassium channel. Proc. Natl. Acad. Sci. USA. 2007;104:15959–15964. doi: 10.1073/pnas.0707912104. [DOI] [PMC free article] [PubMed] [Google Scholar]
- Lejay L, Tillard P, Domingo-Olive F, Lepetit M, Olive FD, Filleur S, Daniel-Vedele F, Gojon A. Molecular and functional regulation of two NO3− uptake systems by N- and C-status of Arabidopsis plants. Plant J. 1999;18:509–519. doi: 10.1046/j.1365-313x.1999.00480.x. [DOI] [PubMed] [Google Scholar]
- Lima L, Seabra A, Melo P, Cullimore J, Carvalho D. Post-translational regulation of cytosolic glutamine synthetase of Medicago truncatula. J. Exp. Bot. 2006;57:2751–2761. doi: 10.1093/jxb/erl036. [DOI] [PubMed] [Google Scholar]
- Liu KH, Tsay YF. Switching between the two action modes of the dual-affinity nitrate transporter CHL1 by phosphorylation. EMBO J. 2003;22:1005–1013. doi: 10.1093/emboj/cdg118. [DOI] [PMC free article] [PubMed] [Google Scholar]
- Liu TY, Chang CY, Chiou TJ. The long-distance signaling of mineral macronutrients. Curr. Opin. Plant Biol. 2009;12:312–319. doi: 10.1016/j.pbi.2009.04.004. [DOI] [PubMed] [Google Scholar]
- Loque D, Lalonde S, Looger LL, von Wiren N, Frommer WB. A cytosolic trans-activation domain essential for ammonium uptake. Nature. 2007;446:195–198. doi: 10.1038/nature05579. [DOI] [PubMed] [Google Scholar]
- Lothier J, Gaufichon L, Sormani R, Lemaître T, Azzopardi M, Morin H, Chardon F, Reisdorf-Cren M, Avice JC, Masclaux-Daubresse C. The cytosolic glutamine synthetase GLN1;2 plays a role in the control of plant growth and ammonium homeostasis in Arabidopsis rosettes when nitrate supply is not limiting. J. Exp. Bot. 2011;62:1375–1390. doi: 10.1093/jxb/erq299. [DOI] [PubMed] [Google Scholar]
- Ludwig AA, Romeis T, Jones JD. CDPK-mediated signalling pathways: specificity and cross-talk. J. Exp. Bot. 2004;55:181–188. doi: 10.1093/jxb/erh008. [DOI] [PubMed] [Google Scholar]
- MacKintosh C. Regulation of cytosolic enzymes in primary metabolism by reversible protein phosphorylation. Curr. Opin. Plant Biol. 1998;1:224–229. doi: 10.1016/s1369-5266(98)80108-8. [DOI] [PubMed] [Google Scholar]
- Morcuende R, Bari R, Gibon Y, et al. Genome-wide reprogramming of metabolism and regulatory networks of Arabidopsis in response to phosphorus. Plant Cell Environ. 2007;30:85–112. doi: 10.1111/j.1365-3040.2006.01608.x. [DOI] [PubMed] [Google Scholar]
- Niittylä T, Fuglsang AT, Palmgren MG, Frommer WB, Schulze WX. Temporal analysis of sucrose-induced phosphorylation changes in plasma membrane proteins of Arabidopsis. Mol. Cell Proteomics. 2007;6:1711–1726. doi: 10.1074/mcp.M700164-MCP200. [DOI] [PubMed] [Google Scholar]
- Ninnemann O, Jauniaux JC, Frommer WB. Identification of a high affinity NH4+ transporter from plants. EMBO J. 1994;13:3464–3471. doi: 10.1002/j.1460-2075.1994.tb06652.x. [DOI] [PMC free article] [PubMed] [Google Scholar]
- Nühse TS, Stensballe A, Jensen ON, Peck J. Large-scale analysis of in vivo phosphorylated membrane proteins by immobilized metal ion affinity chromatography and mass spectrometry. Mol. Cell Proteomics. 2003;2:1234–1243. doi: 10.1074/mcp.T300006-MCP200. [DOI] [PubMed] [Google Scholar]
- Nühse TS, Bottrill AR, Jones AM, Peck SC. Quantitative phosphoproteomic analysis of plasma membrane proteins reveals regulatory mechanisms of plant innate immune responses. Plant J. 2007;51:931–940. doi: 10.1111/j.1365-313X.2007.03192.x. [DOI] [PMC free article] [PubMed] [Google Scholar]
- Olsen JV, Blagoev B, Gnad F, Macek B, Kumar C, Mortensen P, Mann M. Global, in vivo, and site-specific phosphorylation dynamics in signaling networks. Cell. 2006;127:635–648. doi: 10.1016/j.cell.2006.09.026. [DOI] [PubMed] [Google Scholar]
- Orsel M, Chopin F, Leleu O, Smith SJ, Krapp A, Daniel-Vedele F, Miller AJ. Characterization of a two-component high-affinity nitrate uptake system in Arabidopsis. Physiology and protein–protein interaction. Plant Physiol. 2006;143:1304–1317. doi: 10.1104/pp.106.085209. [DOI] [PMC free article] [PubMed] [Google Scholar]
- Orsel M, Chopin F, Leleu O, Smith SJ, Krapp A, Vedele FD, Miller AJ. Nitrate signaling and the two component high affinity uptake system in Arabidopsis. Plant Signal. Behav. 2007;2:260–262. doi: 10.4161/psb.2.4.3870. [DOI] [PMC free article] [PubMed] [Google Scholar]
- Osuna D, Usadel B, Morcuende R, et al. Temporal responses of transcripts, enzyme activities and metabolites after adding sucrose to carbon-deprived Arabidopsis seedlings. Plant J. 2007;49:463–491. doi: 10.1111/j.1365-313X.2006.02979.x. [DOI] [PubMed] [Google Scholar]
- Piques MC, Schulze WX, Höhne M, Usadel B, Gibon Y, Rohwer J, Stitt M. Ribosome and transcript copy numbers, polysome occupancy and enzyme dynamics in Arabidopsis. Mol. Syst. Biol. 2009;5:E1–E17. doi: 10.1038/msb.2009.68. [DOI] [PMC free article] [PubMed] [Google Scholar]
- Popescu SC, Popescu GV, Bachan S, Zhang Z, Gerstein M, Snyder M, Dinesh-Kumar SP. MAPK target networks in Arabidopsis thaliana revealed using functional protein microarrays. Genes Dev. 2009;23:80–92. doi: 10.1101/gad.1740009. [DOI] [PMC free article] [PubMed] [Google Scholar]
- Reiland S, Messerli G, Baerenfäller K, Gerrits B, Endler A, Grossmann J, Gruissem W, Baginsky S. Large-scale Arabidopsis phosphoproteome profiling reveals novel chloroplast kinase substrates and phosphorylation networks. Plant Physiol. 2009;150:889–903. doi: 10.1104/pp.109.138677. [DOI] [PMC free article] [PubMed] [Google Scholar]
- Rubio V, Bustos R, Irigoyen M, Cardona-López X, Rojas-Triana M, Paz-Ares J. Plant hormones and nutrient signaling. Plant J. 2009;69:361–373. doi: 10.1007/s11103-008-9380-y. [DOI] [PubMed] [Google Scholar]
- Scheible WR, Gonzalez-Fontes A, Lauerer M, Müller-Röber B, Caboche M, Stitt M. Nitrate acts as a signal to induce organic acid metabolism and repress starch metabolism in tobacco. Plant Cell. 1997a;9:783–798. doi: 10.1105/tpc.9.5.783. [DOI] [PMC free article] [PubMed] [Google Scholar]
- Scheible WR, Lauerer M, Schulze ED, Caboche M, Stitt M. Accumulation of nitrate in the shoot acts as a signal to regulate shoot–root allocation in tobacco. Plant J. 1997b;11:671–691. [Google Scholar]
- Scheible WR, Morcuende R, Czechowski T, Fritz C, Osuna D, Palacios-Rojas N, Schindelasch D, Thimm O, Udvardi MK, Stitt M. Genome-wide reprogramming of primary and secondary metabolism, protein synthesis, cellular growth processes, and the regulatory infrastructure of Arabidopsis in response to nitrogen. Plant Physiol. 2004;136:2483–2499. doi: 10.1104/pp.104.047019. [DOI] [PMC free article] [PubMed] [Google Scholar]
- Schroeder MJ, Shabanowitz J, Schwartz JC, Hunt DF, Coon JJ. A neutral loss activation method for improved phosphopeptide sequence analysis by quadrupole ion trap mass spectrometry. Anal. Chem. 2004;76:3590–3598. doi: 10.1021/ac0497104. [DOI] [PubMed] [Google Scholar]
- Schulze W, Usadel B. Quantitation in mass-spectrometry-based proteomics. Annu. Rev. Plant Biol. 2010;61:491–516. doi: 10.1146/annurev-arplant-042809-112132. [DOI] [PubMed] [Google Scholar]
- Schulze W, Schulze ED, Stader J, Heilmeier H, Stitt M, Mooney HA. Growth and reproduction of Arabidopsis thaliana in relation to storage of starch and nitrate in the wild-type and in starch-deficient and nitrate-uptake-deficient mutants. Plant Cell Environ. 1994;17:795–809. [Google Scholar]
- Schulze B, Mentzel T, Jehle AK, Müller K, Beeler S, Boller T, Felix G, Chinchilla D. Rapid heteromerization and phosphorylation of ligand-activated plant transmembrane receptors and their associated kinase BAK1. J. Biol. Chem. 2010;285:9444–9451. doi: 10.1074/jbc.M109.096842. [DOI] [PMC free article] [PubMed] [Google Scholar]
- Schwacke R, Schneider A, van der Graaff E, Fischer K, Catoni E, Desimone M, Frommer WB, Flügge U-I, Kunze R. ARAMEMNON, a novel database for Arabidopsis integral membrane proteins. Plant Physiol. 2003;131:16–26. doi: 10.1104/pp.011577. [DOI] [PMC free article] [PubMed] [Google Scholar]
- Shin R, Alvarez S, Burch AY, Jez JM, Schachtman DP. Phosphoproteomic identification of targets of the Arabidopsis sucrose nonfermenting-like kinase SnRK2.8 reveals a connection to metabolic processes. Proc. Natl. Acad. Sci. USA. 2007;104:6460–6465. doi: 10.1073/pnas.0610208104. [DOI] [PMC free article] [PubMed] [Google Scholar]
- Shiu S-H, Bleecker AB. Plant receptor-like kinase gene family: diversity, function, and signaling. Sci. STKE. 2001;113:1–13. doi: 10.1126/stke.2001.113.re22. [DOI] [PubMed] [Google Scholar]
- Steen H, Jebanathirajah JA, Springer M, Kirschner MW. Stable isotope-free relative and absolute quantitation of protein phosphorylation stoichiometry by MS. Proc. Natl. Acad. Sci. USA. 2005;102:3948–3953. doi: 10.1073/pnas.0409536102. [DOI] [PMC free article] [PubMed] [Google Scholar]
- Stitt M. Nitrate regulation of metabolism and growth. Curr. Opin. Plant Biol. 1999;2:178–186. doi: 10.1016/S1369-5266(99)80033-8. [DOI] [PubMed] [Google Scholar]
- Swarbreck D, Wilks C, Lamesch P, et al. The Arabidopsis Information Resource (TAIR): gene structure and function annotation. Nucleic Acids Res. 2008;36:D1009–D1014. doi: 10.1093/nar/gkm965. [DOI] [PMC free article] [PubMed] [Google Scholar]
- Tabb DL, Vega-Montoto L, Rudnick PA, et al. Repeatability and reproducibility in proteomic identifications by liquid chromatography-tandem mass spectrometry. J. Proteome Res. 2010;9:761–766. doi: 10.1021/pr9006365. [DOI] [PMC free article] [PubMed] [Google Scholar]
- Tang W, Deng Z, Oses-Prieto JA, Suzuki N, Zhu S, Zhang X, Burlingame AL, Wang ZY. Proteomics studies of brassinosteroid signal transduction using prefractionation and two-dimensional DIGE. Mol. Cell Proteomics. 2008;7:728–738. doi: 10.1074/mcp.M700358-MCP200. [DOI] [PMC free article] [PubMed] [Google Scholar]
- Thimm O, Bläsing O, Gibon Y, Nagel A, Meyer S, Kruger P, Selbig J, Muller LA, Rhee SY, Stitt M. MAPMAN: a user-driven tool to display genomics data sets onto diagrams of metabolic pathways and other biological processes. Plant J. 2004;37:914–939. doi: 10.1111/j.1365-313x.2004.02016.x. [DOI] [PubMed] [Google Scholar]
- Tornroth-Horsefield S, Wang Y, Hedfalk K, Johanson U, Karlsson M, Tajkhorshid E, Neutze R, Kjellbom P. Structural mechanism of plant aquaporin gating. Nature. 2006;439:688–694. doi: 10.1038/nature04316. [DOI] [PubMed] [Google Scholar]
- Vener AV, Harms A, Sussman MR, Vierstra RD. Mass spectrometric resolution of reversible protein phosphorylation in photosynthetic membranes of Arabidopsis thaliana. J. Biol. Chem. 2001;276:6959–6966. doi: 10.1074/jbc.M009394200. [DOI] [PubMed] [Google Scholar]
- Walch-Liu P, Forde BG. Nitrate signalling mediated by the NRT1.1 nitrate transporter antagonises l-glutamate-induced changes in root architecture. Plant J. 2008;54:820–828. doi: 10.1111/j.1365-313X.2008.03443.x. [DOI] [PubMed] [Google Scholar]
- Wirth J, Chopin F, Santoni V, Viennois G, Tillard P, Krapp A, Lejay L, Daniel-Vedele F, Gojon A. Regulation of root nitrate uptake at the NRT2.1 protein level in Arabidopsis thaliana. J. Biol. Chem. 2007;282:23541–23552. doi: 10.1074/jbc.M700901200. [DOI] [PubMed] [Google Scholar]
- Yong Z, Kotur Z, Glass AD. Characterization of an intact two-component high-affinity nitrate transporter from Arabidopsis roots. Plant J. 2010;63:739–748. doi: 10.1111/j.1365-313X.2010.04278.x. [DOI] [PubMed] [Google Scholar]
- Yuan L, Loque D, Ye F, Frommer WB, von Wiren N. Nitrogen-dependent posttranscriptional regulation of the ammonium transporter AtAMT1;1. Plant Physiol. 2006;143:732–744. doi: 10.1104/pp.106.093237. [DOI] [PMC free article] [PubMed] [Google Scholar]
Associated Data
This section collects any data citations, data availability statements, or supplementary materials included in this article.