

Abstract
Background and Aims
Experiments have shown that biotrophic fungi divert assimilates for their growth. However, no attempt has been made either to account for this additional sink or to predict to what extent it competes with both grain filling and plant reserve metabolism for carbon. Fungal sink competitiveness with grains was quantified by a mixed experimental–modelling approach based on winter wheat infected by Puccinia triticina.
Methods
One week after anthesis, plants grown under controlled conditions were inoculated with varying loads. Sporulation was recorded while plants underwent varying degrees of shading, ensuring a range of both fungal sink and host source levels. Inoculation load significantly increased both sporulating area and rate. Shading significantly affected net assimilation, reserve mobilization and sporulating area, but not grain filling or sporulation rates. An existing carbon partitioning (source–sink) model for wheat during the grain filling period was then enhanced, in which two parameters characterize every sink: carriage capacity and substrate affinity. Fungal sink competitiveness with host sources and sinks was modelled by representing spore production as another sink in diseased wheat during grain filling.
Key Results
Data from the experiment were fitted to the model to provide the fungal sink parameters. Fungal carriage capacity was 0·56 ± 0·01 µg dry matter °Cd−1 per lesion, much less than grain filling capacity, even in highly infected plants; however, fungal sporulation had a competitive priority for assimilates over grain filling. Simulation with virtual crops accounted for the importance of the relative contribution of photosynthesis loss, anticipated reserve depletion and spore production when light level and disease severity vary. The grain filling rate was less reduced than photosynthesis; however, over the long term, yield loss could double because the earlier reserve depletion observed here would shorten the duration of grain filling.
Conclusions
Source–sink modelling holds the promise of accounting for plant–pathogen interactions over time under fluctuating climatic/lighting conditions in a robust way.
Keywords: Triticum aestivum, Puccinia triticina, source–sink model, dry mass partitioning, spore production, reserve balance, environmentally linked disease damage, tolerance to disease
INTRODUCTION
Foliar pests reduce the net assimilation rate of infected plants through a source effect, i.e. they are directly responsible for a decrease in photosynthesis (Johnson, 1992; Bancal et al., 2007). They also reduce the net assimilation rate through a sink effect, i.e. they divert carbon fluxes from growing plant organs to themselves for their own growth (Whipps and Lewis, 1981; Farrar, 1992). Fungal sinks can also affect net assimilation by an increase in leaf respiration associated with either fungal growth (Sabri et al., 1997; Garry et al., 1996) and/or plant defence responses (Farrar and Lewis, 1987; Farrar, 1992).
Among plant pathogens, biotrophic fungi are the most cited regarding the need to better understand sink effects (Boote et al., 1983; Ayres et al., 1996). Their sink activity has been strongly suggested by studies conducted at different scales using either 14C labelling techniques (Okwulehie, 2000), the characterization of enzyme switches involved in source–sink transitions induced by infection (Berger et al., 2004; Pérez-Garcia et al., 1998) and even the quantification of mycelium or spores produced by the fungus (Sache, 1997; Robert et al., 2002). In the last-named case, mycelium or cumulative spore biomass represents up to 50 % of infected leaf biomass, and heavily infected leaves behave as net importers of carbon (Farrar and Lewis, 1987). Although these studies agree that biotrophic fungi need to be accounted for as a sink for the plant, they rarely quantify the damage and extrapolate it under varying growth conditions. The competitiveness for sugar use by biotrophic pathogenic fungi is frequently assigned to architectural changes in nutritional pathways, e.g. through haustoria, specific structures at the interface with leaf tissues, whose ability to import carbohydrates has been demonstrated at the molecular level (Wirsel et al., 2001; Voegele et al., 2006). However, in wheat infected by leaf rust (Puccinia triticina) at the uredial stage, the invasion by D-haustoria in vascular tissues has only been reported once (Andreev et al., 1982). Thus, fungal competitiveness with grain growth would result from preferential use rather than limited access to assimilates released from phloem.
To gain a thorough quantification of what is lost by the plant due to fungal sink activity, the latter needs to be integrated into a whole-plant model of carbon partitioning. To account for degradation in net assimilation, Bastiaans (1993) simply used a power coefficient to green area loss. Yet many enzyme processes that are often studied independently actually drive the fungal sink activity; among them, fungal invertase (Voegele et al., 2006), hexose (Voegele et al., 2001) and sucrose (Wahl et al., 2010) transporters have been reported to be involved in fungal sink strength in plant-compatible interactions with biotrophic pathogens. Fungal sink activity per se involves both spore production and mycelium growth inside the leaf, and it is accompanied by new carbon needs due to plant reaction to fungal invasion, but no attempt has been made to quantify overall fungal sink in terms of any one of these aspects. Pinnschmidt et al. (1995) introduced a constant ‘assimilate consumption’ as well as a ‘reserve blockage’ function as coupling points in a multiple pest model; however, competition between plant organs and pests was not represented in a dynamic way.
Numerous plant models already account for competition between plant sinks to predict assimilate partitioning (Genard et al., 2008). Empirical approaches use a fixed partitioning coefficient (West et al., 1997) that may vary as new sinks appear. These models usually assume that sink priority results from a combination of the age of an organ and/or its size (i.e. its biochemical capacity to import assimilates). Although this has proved useful to extend modelling from plant growth to yield, it is insufficient if sink competition in the case of varying resources is to be investigated. Thus, alternative mechanistic approaches of source–sink interactions were developed. Minchin et al. (1993) described a model by analogy to the well-known response of enzyme activity to substrate concentration. They characterized each sink as an activity consuming a common substrate, e.g. labile carbon, which is released by sources. Any sink is thus characterized by two parameters: its affinity to substrate K, and its carriage capacity V. Adding any new sink amounts to quantifying its parameters. However, this model remains theoretical because sources were defined as producing a given substrate concentration without explaining mechanisms. Bancal and Soltani (2002) have proposed to define sources based on their rate of substrate production. In this case, substrate concentration becomes an internal variable of the model, which is easily fit to available data on activities of sources and sinks. The authors also suggested that carriage capacities V would continuously vary throughout sink growth, while affinities K are intrinsic characteristic of the various sinks. In other words, K would not vary with growth conditions and could be readily obtained from the literature. Lastly, Bancal and Soltani (2002) validated their model with regard to wheat during grain filling by splitting carbohydrate temporary reserve into two functional pools: a sink, using labile carbon as the substrate for reserve polymerization; and a source, delivering labile carbon from reserve hydrolysis.
Here, fungal sink competitiveness with grains of winter wheat (Triticum aestivum) was quantified with regard to leaf rust (Puccinia triticina), a biotrophic and endoparasite fungus attacking leaves. We based our study on a mixed experimental–modelling approach. An experiment was set up under controlled conditions using crossed levels of inoculum load and incident light intensity during spore production to display the source–sink relationship for carbon partitioning. We then enhanced the model of Bancal and Soltani (2002) regarding fungus activity (characterized through spore production) as another sink in a carbon partitioning model of diseased plants. The dynamics of spore production over time then permitted us to fit the two parameters characterizing fungus sink: carriage capacity Vs and substrate affinity Ks. Lastly, the model was used to investigate the competitiveness between plant and fungal sinks under different source–sink balances.
MATERIALS AND METHODS
Plant growth and development
Due to its high susceptibility to leaf rust, Triticum aestivum ‘Soissons’, a commercial cultivar of high yield and quality, was used. Wheat seeds were soaked in water and vernalized in Petri dishes for 6 weeks in the dark at 5 °C. About 500 seedlings were then transplanted by groups of five into 3-L pots filled with expanded silica (Perlite®) rather than soil, because Perlite avoids compaction and it eases the supply of nutrients. The Perlite had been soaked in water for 2 weeks prior to potting. The bottom of the pots remained in water throughout the experiment to meet the plant demand for water. Pots were bound together to obtain a density of 550 seedlings m−2. Seedlings were then raised under glasshouse conditions until anthesis at a mean temperature of 18 °C. Additional light was provided to obtain 380 ± 25 µmol m−2 s−1 photosynthetically active radiation (PAR) over a 16-h photoperiod. Twice a week plants were fed nutrients in solution amounting to 10·7 mg N per plant. Water or nitrogen stresses were thereby avoided. A fungicide that targets powdery mildew (Ethyrimol, 2 mL L−1, 0·3 L m−2) was applied every 2 weeks to avoid any exogenous contamination.
In total, 550 single-culm plants were individually tagged to record heading as well as anthesis dates for each of them. From these 550 plants, 144 were selected with the same heading and anthesis dates. Spikelet number and height of flag leaves below the lamp were then individually measured. According to these numbers, four 36-plant sets were established, with bigger or taller plants equally distributed among them. As expected, no significant differences were found between sets for the following criteria: the timing of development (heading and anthesis dates) and the size of plants (height and area of flag leaf) as well as the number of grains per spike. The four sets later underwent various treatments as indicated below.
Treatments
Inoculation of flag leaves
One set of plants was not inoculated, serving as the control treatment (I-1). The remaining plants were inoculated 5 d after anthesis (GS 69) using P. triticina spores (isolate B9384-1C1) supplied by H. Goyeau (INRA, Grignon, France). Spores mixed with Lycopodium spore powder (Coopération Pharmaceutique Française, Melun, France), at 1 : 3–2 : 3, were applied with a paint brush to one-third, two-thirds or all of the flag leaf area (further designated as treatments I-2, I-3 and I-4). Plants were incubated for 16 h in the dark in a dew chamber, at the mean temperature of 15 °C. They were then transferred to a growth chamber at a temperature regime of 20/14 °C day/night at 80 % relative humidity. During the 16-h photoperiod, provided by 400-W lamps (HPIT Plus, Philips, Eindhoven, the Netherlands), the light intensity at the top of the cover was 700 µmol m−2 s−1. Sporulation began 11–13 d after inoculation, during the first 2 d after shading (see below). It peaked 5 d later and continued until the end of the experiment. Shading was therefore carried out at the time of both sporulation and maximum rate for grain filling (GS75–GS85).
Shading the flag leaves
Eleven days after inoculation, 48 control plants (12 from each inoculation load) were sampled, while the 96 other plants were submitted to shading treatments (0, 35, 50 and 65 % shading of flag leaf; respectively S-1, S-2, S-3 and S-4) during the following 11 d. Shading nets (Diatex®) were checked to ensure that they were having no effect on light quality or air temperature. Lower leaves were kept in the dark to suppress their contribution to carbon gain. To guarantee that each flag leaf was always the same distance from the lamps, the base of each pot was more or less elevated. Each flag leaf was placed in a transparent plastic cylinder and maintained in a horizontal position. These cylinders were open on the top to avoid water condensation that would have hampered spore collection. This experimental design simplified spore sampling over time and ensured the homogeneity of light intensity applied to flag leaves.
Measurements
Harvesting and weighing spores
Spores were collected every 2–3 d from 13 to 22 d after inoculation (five samples). Flag blades were gently shaken to recover the spores in the cylinders. The collected spores were transferred to a plastic vial with a known weight, lyophilized in a centrifuge evaporator (Jouan RC 10·09) and dry weighed.
Interpolating individual plant and grain dry mass (DM) at the start of the shading treatment
The 48 control plants were collected the day the shading treatments began (day 11 after inoculation). They were individually characterized according to their grain number and flag leaf area, in addition to the DM of grains and the DM of the remaining aerial parts of plants. These growth characteristics were related to the non-destructive measurements made during plant growth (heading and anthesis dates plus the height of the flag leaf) by way of multiple regressions. Thus, the DM of plant aerial parts (P11), grains (G11) and vegetative parts (V11) was fitted at the beginning of shading. These regressions do not indicate any physiological determinism, but they could be used within the reported experiment to independently determine the initial values of P11, V11 and G11 for the 96 plants further submitted to differential shading. The regression equations were as follows:
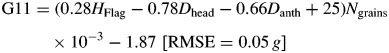 |
where Dhead is date of heading, Danth is date of anthesis date, HFlag is flag leaf height (cm), AFlag is flag leaf area (cm2) and Ngrains is number of grains per spike.
Clearly, P11 = V11 + G11, but different parameters were chosen to avoid mathematical binding. The obtained root mean square error (RMSE) suggested an accuracy of estimates better than 10 %, with neither bias in their determination nor effect of previous inoculation level (P > 0·05).
Estimating the rates of plant and organ growth during the shading treatments
At the end of the shading treatment (day 22 after inoculation), plants were individually harvested and spikes were separated from the flag leaves and the rest of the plant. Flag leaves were scanned in colour (EPSON Expression 1680 Pro) at a resolution of 300 d.p.i. Total, green, apical necrotic and sporulating areas were then measured and lesion number was counted by image analysis using Optimas software (Media Cybernetics, Silver Spring, MD, USA). Flag leaves were added to the rest of the plant aerial parts, oven dried at 80 °C and then dry weighed. Dry spikes were then separated into grains and chaff, and both the number and the DM of grains per spike were recorded. From measured final values (G22, P22 and V22) and from estimated initial values of G11, P11 and V11, the respective rates of grain filling, net assimilation and reserve balance were assessed for each plant, as the slopes between values at day 11 and day 22. For easier extrapolation to field conditions, these ‘observed’ rates are reported in degree days (°Cd) rather than in number of days. Hereafter these rates are named Ug, Ua and Up–Uh, respectively.
Data analysis
Multiple correlations and multiple factor analyses of variance were performed with STATGRAPHICS Plus (Manugistics, Inc., MD, USA). Means were compared with a Newman Keuls test. Individual effects of inoculation (I) and shading (S) were analysed as well as first-level interactions I × S. The overall error rate was α = 0·05. Paired comparisons were made between data and values simulated by the model. The t-test was used for the paired comparisons for both Ug and reserve balance. It could not be used for Us and other parameters relative to spore production because of excessive standard skewness, due to either no or very low infection in non-inoculated plants. Thus, either I1-plants were not regarded and ANOVA could be applied or I1-plants were regarded using sign and rank tests.
Modelling spore production of P. triticina as a competitive sink for carbon
Overview
Bancal and Soltani (2002) have proposed a source–sink model that simulates the allocation of carbon between sources (photosynthesis and reserve utilization) and sinks (grain filling and reserve storage) in wheat after anthesis. Sources and sinks thus refer to activities, not to organs. In this study, the model was extended to wheat infected with P. triticina. Figure 1 describes the four compartments the model explicitly takes into account: flag leaf, grain DM, spore DM and reserves. Free carbon circulating between organs is characterized by the concentration S, which is the driving variable in the following equations. Free carbon is released by the varying sources (flag leaf net assimilation Ua and reserves hydrolysis Uh) while it is used to feed the varying sinks (grain filling Ug, sporulation Us and reserves polymerization Up). The reserve compartment is filled by means of polymerization activity (sink), while it is depleted by hydrolysis activity (source). The two other compartments, i.e. grain DM and spore DM, are only linked to free carbon through sink activities that import carbon from the plant to respectively fill grains and produce spores.
Fig. 1.
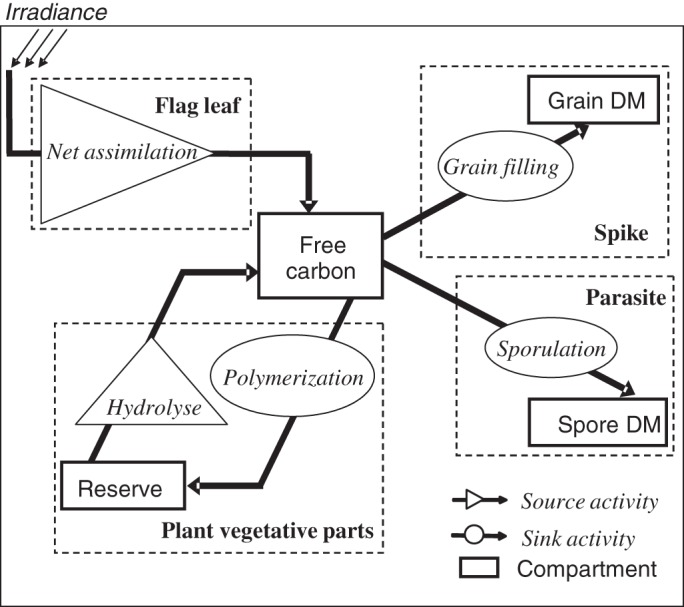
Following Bancal and Soltani (2002), the enhanced carbon repartition model that now accounts for fungal sink competitiveness. Sources (metabolic activities that release free carbon) are drawn as triangles and arrows, while sinks (metabolic activities that consume free carbon) are drawn as ellipses and arrows. The carbon compartments are drawn as rectangles with plain lines, and the plant/fungus organs with dashed lines.
Equations
The main source of carbon is the net assimilation rate of flag leaf (Ua), which is also a model input. Reserve hydrolysis is the secondary source of carbon (Uh), which is downregulated through retro inhibition by S, according to
| (1) |
where Vh represents its potential activity, and Kh is the constant of inhibition by S, the substrate concentration.
In an infected plant, three sink activities were taken into account: reserve polymerization (Up), grain filling (Ug) and spore production (Us). In a first hypothesis (H1), it was assumed that every activity consumes the substrate S and follows a Michaëlis–Menten kinetic:
| (2) |
where Vp, Vg and Vs represent potential activities and Kp, Kg and Ks represent affinities for the substrate of reserve polymerization, grain filling and spore production, respectively. Under H1 it is thus supposed that spore production only depends on the current sources (Ua and Uh) of the plant. As an alternative, a second hypothesis (H2) proposes that spore production also depends on carbon remobilization from the mycelium, and thus it partly functions independently of current plant nutrition. In that case,
| (3) |
Vm being an additional parameter that represents carbon remobilization from the mycelium. Under the two hypotheses, the model assumes that concentration S converges to a steady state when all the carbon released by the sources is used by the sinks:
| (4) |
Parameter estimation
For each plant characterized by its measured Ua rate, a single value of S solves eqns (1)–(4), providing the parameters V and K are given. On the one hand, Kh, Kp and Kg are intrinsic characteristics of hydrolysis, polymerization and grain filling. Thus, they are independent of the experiment and were set to 2500, 2500 and 65 mM, respectively, according to Bancal and Soltani (2002). The values of K characterizing the sink strength for spore production will function independently of experimental conditions once it is determined as described below. On the other hand, potential activities Vh, Vp, Vg, Vs and Vm vary with both plant development stage and previous growth conditions. These parameters could be provided by a dynamic growth model; alternatively, they could be fitted for each experiment, which was done here. Additionally, the potential activities were assumed to also vary with plant size (Vh, Vp and Vg) or infection level (Vs and Vm). Accordingly, Vh, Vp and Vg were normalized by the number of grains per spike, while Vs and Vm were normalized by the number of lesions per flag leaf. The numbers of grains and lesions, as well as Ua rate, were therefore model inputs for each plant.
Parameters Vh, Vp, Vg, Vs, Vm and Ks, common to all plants, as well as the variable S characterizing each plant, were estimated by minimizing the three RMSE between measured values (using data obtained at days 11 and 22) and simulated values (using eqs 1–4) of Ug, Us and reserve balance (Up–Uh) rates. Because these rates were markedly different in magnitude, the procedure minimized a weighted sum of RMSE, using the standard deviation of the measured rates to weigh the corresponding RMSE. A bootstrap procedure was then used to obtain confidence intervals for each parameter.
Example of model predictive use
Once the parameters were estimated as indicated, the model could be used to simulate the output variables (i.e. Ug, Us and Up–Uh) corresponding to varying input levels (i.e. Ua, grain and lesion number). An example is given for a virtual crop of 550 culms m−2, each bearing 40 grains, which corresponds to the median of plants in the lab experiment. Ua in control culms was calculated from incoming daily PAR using a radiation use efficiency of 3 g DM MJ−1. Diseased culms bear 250 lesions on their flag leaf, approximately the third quartile observed in the lab experiment, leading to a 6 % loss of green area in the flag leaf. The epidemic was homogenously distributed on the culm green leaves. Diseased culms thus bore a total of 1000 lesions, because flag leaf green area was about one-quarter of total green leaf area between GS75 and GS85 (P. Bancal, unpubl. data). Lesions therefore led to a 6 % loss of green area in all leaves, and Ua was reduced two-fold more than the green area loss reported by Robert et al. (2005).
RESULTS
Effects of shading and inoculation treatments on plant functioning
Data for net assimilation (Ua) and grain filling (Ug) rates were derived for each plant from the increase in total DM during the shading period. As expected, Ua (Fig. 2A) significantly decreased with increasing shading intensity from 4·8 ± 1·4 to 3·7 ± 1·2 mg DM °Cd−1. However, ANOVA resulted in quite low (0·01 < P < 0·05) significance levels (Table 1) due to a large variation in Ua within each shading level. To increase the accuracy of the analysis, flag leaf area (AFlag) variability was accounted for through a covariance analysis. Indeed, the analysis of covariance showed that AFlag had a significant effect on Ua (P < 10−4; Table 2), increasing the significance of shading (P < 0·01). The effect of the inoculation level on Ua was also significant (P < 0·05), but across treatments quite inconsistent, as Ua of the most highly inoculated treatment (I-4) was not significantly different from the non-inoculated treatment (I-1). Using AFlag as covariable decreased the effect of inoculation on Ua, which became only marginally significant (P = ∼0·05). Neither inoculation nor shading treatments showed any significant effect on Ug during their application (Fig. 2B; Table 1). In fact, Ug showed less variability than Ua, with coefficient of variations of 24 and 30 %, respectively. Mean Ug was 3·8 ± 1·0 mgDM °Cd−1 when all data were accounted for. As observed in the case of Ua, AFlag had a significant effect on Ug (P < 10−4; Table 2), but the analysis of covariance did not lead to a significant effect. Finally, no interaction between inoculation and shading treatments was found (P > 0·05; Table 2).
Fig. 2.
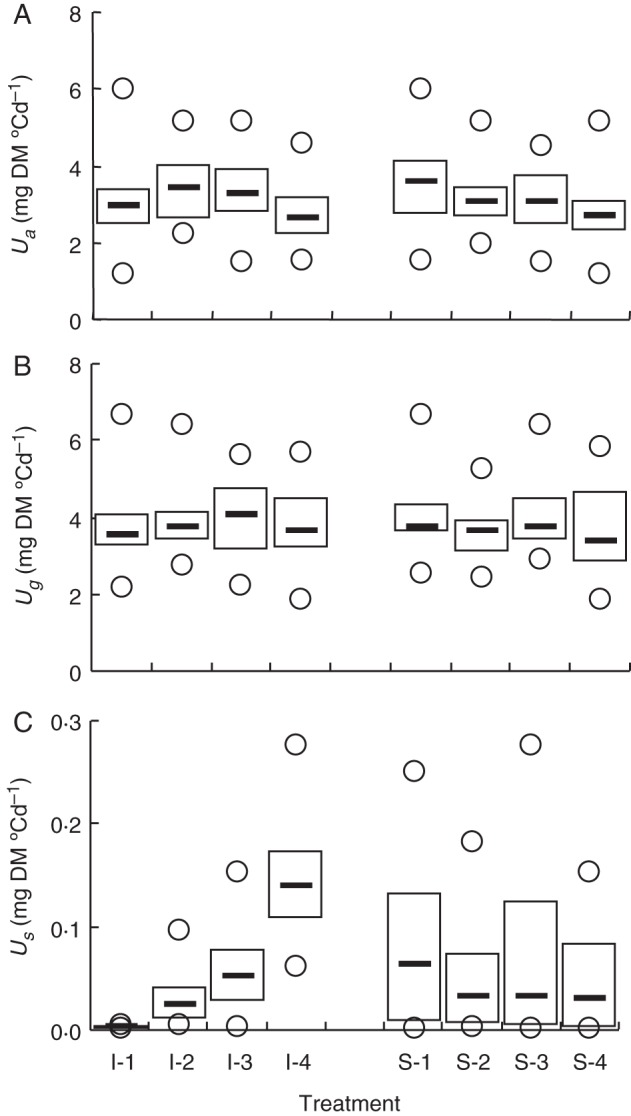
The effects of inoculation and shading levels on rates of net assimilation Ua (A), grain filling Ug (B) and rust sporulation Us (C). Inoculation levels (I-1 to I-4) indicate either no inoculation (I-1) or inoculation of one-third, two-thirds or all of the flag leaf area (treatments I-2, I-3, I-4 respectively). Shading treatments refers to 0, 35, 50 and 65 % shading of flag leaf (S-1, S-2, S-3, S-4, respectively). Box plots represent the range between the first and third quartile. Medians are shown as bold lines and minimum and maximum recorded values as circles.
Table 1.
The probability of no effect of treatments (shading and inoculation) on the rates of net assimilation (Ua), grain filling (Ug) and sporulation (Us) according to analysis of variance; the non-inoculated plants from set I-1 were not taken into account for Us
| Ua | Ug | Us | |
|---|---|---|---|
| Inoculation | 0·0128 | 0·5970 | <10−4 |
| Shading | 0·0364 | 0·1719 | 0·0050 |
| Interaction I × S | 0·8078 | 0·9993 | 0·2330 |
Table 2.
The probability of no-effect of treatments (shading and inoculation) on the rates of net assimilation (Ua), grain filling (Ug) and sporulation (Us) according to analysis of covariance using flag leaf total area (AFlag) as a covariable; the non-inoculated plants from set I-1 were not taken into account for Us
| Ua | Ug | Us | |
|---|---|---|---|
| Covariable | <10−4 | <10−4 | 0·0421 |
| Inoculation | 0·0488 | 0·9987 | <10−4 |
| Shading | 0·0024 | 0·0544 | 0·0053 |
| Interaction I × S | 0·7585 | 0·6153 | 0·2047 |
Effects of shading and inoculation treatments on spore production
Spore production rate Us
Non-inoculated plants I-1 were incubated together with inoculated plants I-2, I-3 and I-4, so some contamination might have occurred, which could explain why Us was not exactly zero in set I-1 (Fig. 2C). As expected, Us significantly increased for each inoculation level (P < 10−4; Table 1). A significant effect of shading treatments on Us was also found, but only S-1 differed from S-4 (P < 0·01; Table 1). AFlag had a significant effect on Us (P < 0·05; Table 2), but taking AFlag as a covariable in ANCOVA led to the same results as previously shown with ANOVA. The different components of spore production were then examined, as either shading or inoculation may have impacted them differently.
Components of spore production
As commonly observed, the inoculation efficiency (lesion number per inoculated area) varied strongly within each plant treatment, which led to large distributions of Us (Fig. 2C). A significant variation in inoculation efficiency was also observed across inoculation levels (P < 0·01; Table 3), but not across shading levels (P > 0·05). However, inoculation efficiency did not show any significant effect on Us (P > 0·05; data not shown) when used as a covariable. The number of lesions per leaf increased very significantly (P < 10−4; Table 3) among inoculation levels. However, the variability in inoculation efficiency led to a large variability in the number of lesions per leaf within each inoculation level: from 17 to 289, 16 to 432 and 89 to 687 in treatments I-2, I-3 and I-4, respectively. This variability masked any significant effect of shading on the number of lesions per leaf or interaction between shading and inoculation treatments (P > 0·05).
Table 3.
Effects of inoculation and shading intensities on the components of rust sporulation at the end of 200 °Cd
| Inoculation efficiency (lesion per cm2 inoculated) | No. of lesions | Sporulating area (cm2) | Relative sporulating area (% AFlag) | Mean lesion size (mm2) | Mean sporulation rate (μg DM °Cd−1 per lesion) | Specific sporulation rate (μg DM °Cd−1 mm−2) | |
|---|---|---|---|---|---|---|---|
| I effect | ** | *** | *** | *** | *** | *** | n.s. |
| I-2 | 9·7a | 120a | 0·7a | 2a | 0·6a | 0·27a | 47a |
| I-3 | 9·0a | 163a | 1·3a | 4a | 0·8a | 0·37a | 44a |
| I-4 | 13·5b | 332b | 3·2b | 10b | 1·0b | 0·46b | 47a |
| S effect | n.s. | n.s. | ** | ** | ** | ** | n.s. |
| S-1 | 11·0α | 212α | 2·2β | 7β | 1·0β | 0·44β | 44α |
| S-2 | 9·1α | 159α | 1·4α | 4α | 0·8β | 0·36αβ | 46α |
| S-3 | 11·4α | 217α | 1·9αβ | 6αβ | 0·8β | 0·39αβ | 45α |
| S-4 | 11·7α | 220α | 1·3α | 4α | 0·5α | 0·27α | 50α |
| I × S | n.s. | n.s. | * | * | n.s. | n.s. | n.s. |
| LSD | 4·1 | 91 | 0·8 | 3 | 0·2 | 0·12 | 9 |
Data averaged by I- or S-levels (excluding I-1 plants) are indicated with results of variance analysis. The letter after the mean indicates no significant difference with the Bonferroni test at 0·05: Latin letters (a,b) refer to the I-effect, while Greek letters (α,β) refer to the S-effect. Least standard deviation (LSD) was calculated based on the mean comparisons according to the Bonferroni test. Multiple factor ANOVA was carried out fully crossing inoculation (I-2, I-3 and I-4) and shading (S-1 to S-4) effects. The first-order interaction between factors was examined (I × S). A probability lower than 0·05 denotes a significant effect of a treatment or an interaction, with *, 0·01 < P < 0·05; **, 0·001 < P < 0·01; ***, P < 10−4; n.s., non-significant effects.
Sporulating area, expressed either as raw values (up to 6 cm2) or relative to AFlag (up to 20 %), was found to increase significantly with inoculation (P < 10−4; Table 3). Shading had a significant effect on this variable, but only S-1 was different from S-4 (P < 0·01), while the inoculation × shading interaction was not significant (P > 0·05).
Mean lesion size increased from 0·2 ± 0·1 to 1·0 ± 0·4 mm2 with increasing inoculation levels (P < 10−4; Table 3), suggesting it increased with lesion number (Fig. 3A). However, mean lesion size did not increase with lesion density over the inoculated area (Fig. 3B). Therefore, the effect of inoculation level on mean lesion size probably resulted from the variability in inoculation efficiency observed across inoculation levels. Mean lesion size also decreased significantly from 1·0 ± 0·4 to 0·5 ± 0·2 mm2 with increasing shading (P < 0·01), and no inoculation × shading interaction was found (P > 0·05).
Fig. 3.

Relationship between mean lesion size and lesion number in flag leaves (A) or lesion density in the inoculated area (B). Each point represents one single plant, and symbols differentiate shading treatments, as indicated in the key.
Finally, variations of Us with inoculation and shading were analysed when Us was expressed by lesion number or by sporulating area. Sporulation rate per lesion increased significantly with inoculation level (P < 10−4; Table 3), but not with lesion density over the inoculated area (data not shown). Sporulation rate per lesion also decreased significantly with shading level (P < 0·01), and no significant interaction occurred between inoculation and shading (P > 0·05). Conversely, specific Us (relative to sporulating area) was not found to vary significantly with either inoculation or shading (P > 0·05), and no interaction between inoculation and shading was found (P > 0·05).
Because of variability between plants and within treatments and because sink growth results from non-linear relationships between sources and sinks, modelling is a key step to characterize fungal sink characteristics with regard to those of wheat grains.
Parameterization of Us as a competitive sink for carbon
Model evaluation
Two versions of carbon partitioning models were then fitted to data obtained on each plant. Models assumed either that Us relies only on carbon currently available by plant organs (H1) or that it relies at least partly on carbon specifically remobilized from mycelium (H2). Models were fitted by minimizing together three RMSEs between simulated and observed values of Ug, Us and reserve balance rate (Up–Uh). Correlations between observed and simulated values were not significantly different from identity (P > 0·05), with r2 of 0·86, 083 and 0·78 for Ug, Up–Uh and Us, respectively (Fig. 4). Paired comparison also indicated that simulated values of Ug, Us and reserve balance rate were not significantly different from observed values (P > 0·05). Models therefore properly took into account the effects of infection over a wide range of Ua. Adding a parameter in the case of hypothesis H2 did not increase the accuracy of the relationships (data not shown).
Fig. 4.

Following hypothesis H1, evaluation of the model represented in Fig. 1 based on observed versus simulated values for rates of grain filling Ug (A), reserve balance Up–Uh (B) and spore production Us (C). Each point represents a single plant.
Sporulation competitiveness according to model
Fitting the models provided estimates for Vm, Vs, Vh, Vp, Vg and Ks, which are parameters common to all fitted plants, and it also provided an estimate for S, which is a variable specific to each plant. Parameter variability was assessed using bootstrap techniques (Table 4). Assuming hypothesis H1 (which assumes that Us depends only on current carbon availability), spore production exhibited a high affinity for circulating carbon, with Ks = 29 ± 6 mm within a lower range than Kg set at 65 mm for grain filling. Thus, as S was fitted in the range 0·1–1·0 m for each of the 96 plants (data not shown), both Ug and Us were close to their respective potential Vg and Vs according to Michaelis–Menten equations (eqn 2). In other words, both Ug and Us were saturated, and therefore quite insensitive to a decrease in Ua by shading. The variability in Ug and Us reported in Fig. 2 was mostly due to variability in either grain or lesion number, as the potential sink activities were accurately determined at 164 ± 1 µg DM °Cd−1 per grain for Vg and 0·56 ± 0·01 µg DM °Cd−1 per lesion for Vs. By contrast, Up was far from saturated in the observed range of S, as Kp was set at 2500 mm: Up was always much lower than fitted Vp, and stem reserves closely followed any variation in Ua.
Table 4.
Parameterization of the carbon allocation model of wheat infected by rust during grain filling following two hypothesis: H1, rust sporulation is only a Michaelis sink; or H2, rust sporulation adds a Michaelis sink to a component set before shading in terms of mycelium growth
| (a) Carrying capacity (μg DM °Cd−1 per quanta) | |||||
|---|---|---|---|---|---|
| Hypothesis | Vh | Vp | Vg | Vs | Vm |
| H1 | 46 ± 1 | 306 ± 5 | 164 ± 1 | 0·56 ± 0·01 | |
| H2 | 45 ± 1 | 306 ± 4 | 165 ± 1 | 0·29 ± 0·09 | 0·41 ± 0·06 |
| (b) Substrate affinity (mm) | ||||
|---|---|---|---|---|
| Hypothesis | Kh | Kp | Kg | Ks |
| H1 | 2500* | 2500* | 65* | 29 ± 6 |
| H2 | 2500* | 2500* | 65* | 586 ± 175 |
‘Quanta’ means ‘grains’ for plant parameters (Vh, Vp and Vg), and ‘lesions’ for fungus parameters (Vs and Vm).
*Kh, Kp and Kg are set according to Bancal and Soltani (2002). Means ± 95 % confidence intervals for the other parameters were obtained by a bootstrap procedure.
Following hypothesis H1, the accuracy of fitting Ks was quite low, suggesting that Us did not exactly follow a Michaelis–Menten equation. A second version of the model was therefore tested (hypothesis H2): Us not only depends on current carbon availability during shading but also on previous mycelium growth parameterized by Vm, according to eqn (3). Hypothesis H2, despite using one more parameter, did not result in a clear improvement in the fitting, as the RRMSE for Us decreased by only 0·2 %. The potential activity Vm was accurately determined (0·41 ± 0·06 µg DM °Cd−1 per lesion). Conversely, the accuracy of Vs decreased (0·29 ± 0·09 µg DM °Cd−1 per lesion), and Ks, equal to 586 ± 175 mm, was no more accurately determined than under hypothesis H1. Under hypothesis H2, the level of Ks suggested that the corresponding activity was not saturated in the observed range of S, and therefore suited Ua variation. However, the fact that Vs was in the same range as Vm suggested that the component of Us that would not respond to current net assimilation would be around half Us.
Simulation of carbon repartition according to the model
The model with fitted parameter values was thereafter used to simulate the varying source and sink activities for any given Ua, Ngrains, and number of sporulating lesions over the range of Ua observed in the experiment (1–6 mg DM °Cd−1 per plant). The following example relates to the field scale: on a 25-year set of weather data, the incoming daily PAR from GS75 to GS85 ranged from 1 to 15 MJ m−2, but average data over 2 weeks were between 7 and 12 MJ m−2 (P. Bancal, unpubl. data), leading to Ua = 2–4 mg DM °Cd−1 per culm when no disease occurs (Fig. 5A). By comparison, in an infected crop bearing 1000 lesions per culm, the net assimilation rate Ua decreased by 12 %, thus decreasing the circulating carbon to be partitioned. The sporulation rate Us (Fig. 5B) showed a smoothed response to PAR under hypothesis H1, whereas it was nearly linear under hypothesis H2. Nevertheless, the choice of either H1 or H2 resulted in less than 3 % variation in Us when PAR was above 7 MJ m−2. Regardless of which hypothesis is used, Us was was much less affected than Ua by PAR variations; moreover, the ratio of Us to the control Ug was always 9–10 % for a medium-sized plant (Ngrains = 40) regardless of PAR level. Fungus competitiveness for assimilates made sporulation quite insensitive to PAR level. The rate of grain filling Ug (Fig. 5C), nevertheless, was one order of magnitude higher than sporulation, in control as well as in diseased plants. The choice of either hypothesis H1 or H2 resulted in less than 1 % variation in Ug assessment when PAR was above 7 MJ m−2. The Ug loss in diseased relative to control plants declined with increasing PAR: from –0·4 to –0·3 mg DM °Cd−1 per plant, i.e. –12 to –7 % of control, within the usual range 7–12 MJ m−2.
Fig. 5.
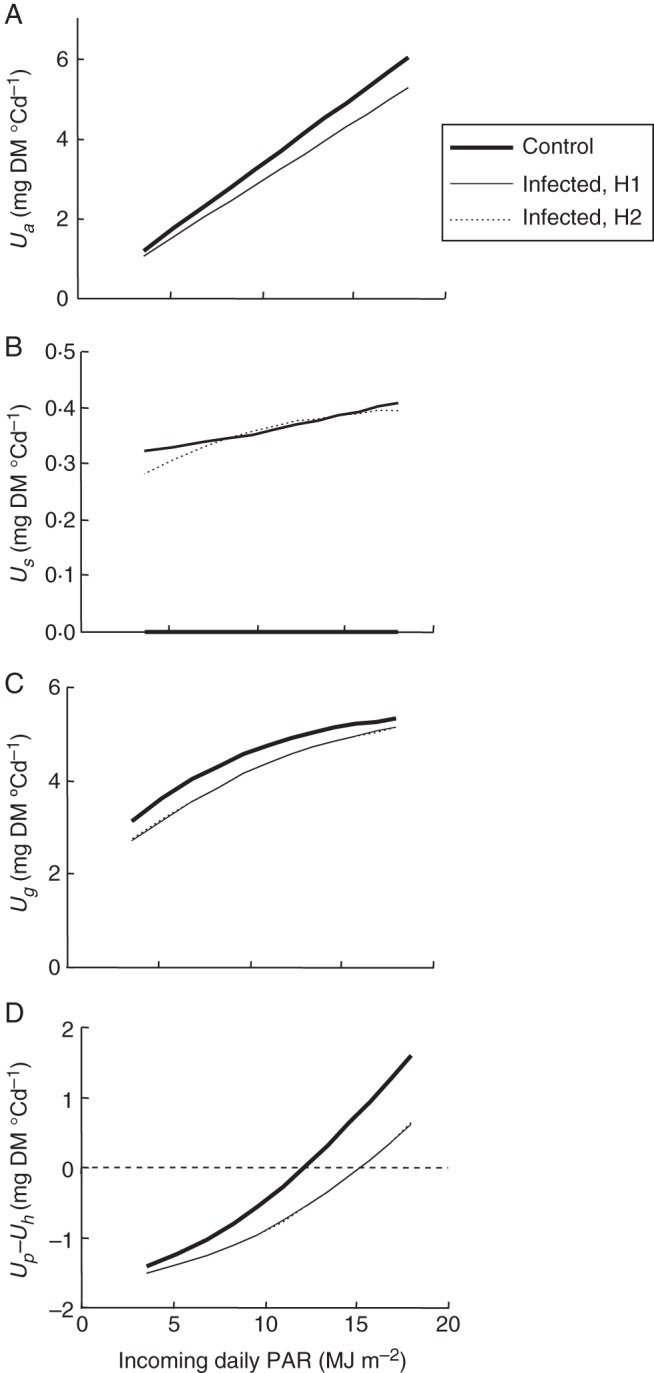
Simulated carbon fluxes in a wheat crop infected or not by sporulating leaf rust, according to incoming PAR. The crop is built with 550 culms m−2, each bearing 40 grains. Infected plants also bear 1000 rust lesions equally distributed on the different leaves. Their net assimilation rate (Ua) is reduced to 88 % of the control plant (A). The respective rates of (B) sporulation (Us), (C) grain filling (Ug,) and (D) reserve balance (Up–Uh) are then calculated in control (bold line) and in infected plants according to hypotheses H1 (thin line) and H2 (dotted line). The H1 and H2 lines generally overlap, indicating that the results do not depend on the hypothesis.
Diseased plants also depleted reserves more markedly, strongly depending on PAR, regardless of hypothesis (Fig. 5D). In control plants, the balance Up–Uh was either positive (net storage) or negative (net remobilization), depending on incoming PAR values. In the given example, Up–Uh reached +0·0 mg DM °Cd−1 at 12 MJ m−2, indicating that the reserve pool was at equilibrium, whereas it dropped to –1·0 mg DM °Cd−1 at 7 MJ m−2, indicating that reserves were depleted. The effect of disease on reserves was somewhat counterintuitive: the reserve balance was more affected by disease at high rather than at low PAR levels. This increased pressure on reserves due to disease could eventually reduce the duration of grain filling, and then grain yield. Yield loss should then be related to disease impact not only on Ug, but also on Ug + Up–Uh. This index decreased by 27 and 21 % in comparison with disease-free plants at 7 and 12 MJ m−2, respectively. Taking reserves into account thus suggested disease decreased yield to a greater extent than that predicted from the direct competition between grain filling and sporulation. This example also indicated how damage due to disease resulted from non-linear interactions between sources and sinks in plant.
DISCUSSION
Despite the procedure used for plant selection before treatment, sources and sinks are very variable (e.g. size, state and local irradiation of leaves, number of grains and parasites) between infected plants, making it difficult to compare sink activities of grains and spores directly from the data. Based on these quantitative measurements, a simple model helped to estimate the parameters of fungal sink activity. Moreover, separating fungal sink characteristics into an intrinsic affinity Ks and a carriage capacity Vs made it possible to distinguish between the respective effects of fungus competitiveness (Ks) and of infection level (Vs).
Fungal sink proved to have a competitive priority over grain filling for assimilates. Even though biotrophic fungi have long been thought of as an additional sink competing with plant growth, this study represents a first estimation of its competitiveness relative to concomitant plant sinks at the plant scale. Larson and Whitham (1997) consider that parasites either redirect phloem flows, thereby changing allocation patterns for their own benefit, or simply self-serve from local assimilate flow to other plant parts. In an extensive investigation of the literature, little evidence has surfaced to argue for an invasion by D-haustoria in vascular tissues, and fluorescence studies have shown that infection with crown rust has little impact on surrounding tissues (Scholes and Rolfe, 1996). Nevertheless, the present study shows that the leaf rust did disturb the whole plant source–sink equilibrium. Therefore, even local stress by a biotrophic pathogen acted as a mobilizing sink despite the fact that the fungus did not modify phloem architecture. Bancal and Soltani (2002) have previously shown that plant architecture and hydraulic resistance to fluxes do not need to be accounted for to model the DM partitioning of healthy wheat plants during grain filling. In the model presented here, this assumption has been maintained: a common pool of circulating carbon is shared by all sinks without accounting for plant architecture and infection site location. Were this assumption not to hold, the model would not have fit the given data for grain filling in diseased plants when in our case it did.
The enhanced model was used to estimate the characteristics of the fungal sink when fitted to experimental data obtained under a wide range of carbon availability, exceeding that observed under field conditions. The fungal sink exhibited a higher affinity Ks for circulating carbon than the spike sink representing carbon needs for grain filling. This result fits well with previous observations of carbohydrate metabolism. For instance, Voegele and Mengden (2003) have shown that rust fungi import carbohydrates from the plant through haustoria that synthesize hexose transporters with a high affinity for nutrients. Voegele et al. (2006) suggested that expression of a fungal gene with homology to invertases is increased in infected plants. Hayes et al. (2010) also showed that a plant reacts to infection by a biotrophic pathogen, increasing the expression of plant invertase and hexose transporters that switch diseased organs from source to sink; circulating carbon is thus diverted to diseased organs. Finally, Wahl et al. (2010) found a novel high-affinity sucrose transporter that efficiently carries apoplastic sucrose to the benefit of the fungus even before cleavage into hexoses. This interplay during infection between plant and pathogen through sugar metabolism (Rolland et al., 2006) suggests why disease cannot be explained by the single equation (eqn 3) that led to a decrease in the accuracy of Ks estimation. It also explains why a clear difference was not found between hypotheses H1 and H2. Overall, studies carried out at the molecular level have provided the biological foundations for P. triticina being more competitive than grains for sucrose. Spore production is a sink that diverts plant carbohydrates more efficiently than grain filling. Comparison between Ks and Kg suggests that neither competition with grain growth nor variation in carbon availability impacts spore production.
Competition with current grain filling by spore production is not the greatest impact of fungal disease. Here, the carrying capacities (V) for the varying sinks were expressed per single grain or lesion, but at the scale of the infected plant the size of the fungal sink (Vs) was one order of magnitude lower than that of the spike sink (Vg). Despite its higher competitiveness, spore production in diseased plants therefore hardly decreased the grain filling rate by the resulting current shortage of assimilates. Disease, however, also led to an increased pressure on carbon reserves, as pointed out by Gaunt and Wright (1992), who suggested that the reserve may partially compensate for a drop in net assimilation in order to save yield. The model makes it possible to simulate reserve depletion by varying disease severity and net assimilation rate. Reserves minimize the losses for plant yield depending on PAR level. At higher levels of net assimilation rate, for instance in the case of sunny weather, the current grain filling rate was less affected by disease; however, the early depletion of the reserve would shorten the duration of grain filling. Conversely, at lower light levels disease would decrease the rate as well as the duration of grain filling. At the field scale, similar epidemics on similar crops could lead to different yield losses because of the wide range of photosynthesis due to variations in light levels. To our knowledge, this interplay between source–sink behaviour and fluctuating weather conditions has yet to be investigated.
Variations in fungal sink activity should be further studied throughout the fungal cycle. The present experiment was carried out to characterize fungal sink activity through spore production, which represents the part of fungal sink activity that can be easily measured, moreover diverting large amounts of carbon (up to 200 g DM m−2, according to Robert et al., 2004). However, building fungus biomass also consumes carbon from host cells (Manners and Gay, 1982; Ayres and West, 1993), including both hyphae and haustoria. In the case of endoparasitic fungi, fully separating intact haustoria and mycelia from host cell activities remains difficult (Bushnell, 1972; Voegele and Mengden, 2003). In our case, only the lesion size, and not the specific sporulation rate, responded to shading, suggesting that shading was provided when lesion size was not completely set. Further studies could assess how sensitive the setting of the number of lesions and/or spore production per sporulating area are to shading. If shading is applied just after inoculation, i.e. when mycelium grows inside the leaf tissues during the latency stage, we would expect to measure the contribution of mycelium growth to later spore production components. The model would thereby be extended to the entire fungal cycle in interaction with fluctuating leaf carbon availability over time.
To conclude, a mixed experimental–modelling approach has made it possible to characterize a fungal sink in terms of spore production affinity Ks and carriage capacity Vs for carbon use. Principally, the fungal sink has a competitive priority over grain filling for circulating carbon, but because of its low capacity, damage resulting from rust infection was quantitatively more than DM loss through spore production. Three types of damage were involved: photosynthesis loss, increased net reserve mobilization and assimilate depletion by spore production. The resulting damage depends on the level of both light and disease, without following linear equations. Circulating carbon used for spore production primarily affected either grain filling or net reserve mobilization depending on the level of the net assimilation rate. Thus, this simple modelling framework makes it possible to account for compensation effects between plant organs that either mitigate or delay damage due to disease depending on resource availability. It is a first step towards accounting for the interplay between sources and sinks that needs to be integrated over time to quantify damage to plants in a fluctuating environment. It may also provide insight into how multiple pathogens compete with plant resources and result in damage according to the respective affinity and capacity of the sinks they develop.
ACKNOWLEDGEMENTS
We gratefully acknowledge J. Jean-Jacques, P. Duprix and F. Lafouge for technical help and for their work in processing the plant samples and in their analysis, and P. Belluomo for developing the adapted programs for image analysis. We are very grateful to H. Goyeau and C. Lannou for fruitful scientific discussions. We also thank Dr S. Tanis-Plant for discussions and thorough editorial advice with regard to the use of English. This study was funded by the Institut National de la Recherche Agronomique (INRA).
LITERATURE CITED
- Andreev LN, Plotnikova YM, Serezkhina GV. Haustoria of Puccinia graminis Pers. f. sp. tritici Eriks. & Henn. in the vascular system of wheat. Mikologiya i Fitopatologiya. 1982;16:335–338. [Google Scholar]
- Ayres PG, West HM. Stress responses in plants infected by pathogenic and mutualistic fungi. In: Fowden L, Mansfield T, Stoddart J, editors. Plant adaptation to environmental stress. London: Chapman & Hall; 1993. pp. 295–311. [Google Scholar]
- Ayres PG, Colin Press M, Spencer-Phillips PTN. Effects of pathogens and parasitic plants on source sink relationships. In: Zamski E, Schaffer AA, editors. Photoassimilate distribution in plants and crops. Source–sink relationships. New York: Marcel Dekker, Inc; 1996. pp. 479–499. [Google Scholar]
- Bancal M-O, Robert C, Ney B. Modelling wheat growth and yield losses from late epidemics of foliar diseases using loss of green leaf area per layer and pre-anthesis reserves. Annals of Botany. 2007;100:777–789. doi: 10.1093/aob/mcm163. [DOI] [PMC free article] [PubMed] [Google Scholar]
- Bancal P, Soltani F. Source-sink partitioning. Do we need Munch? Journal of Experimental Botany. 2002;53:1919–1928. doi: 10.1093/jxb/erf037. [DOI] [PubMed] [Google Scholar]
- Bastiaans L. Effects of leaf blast on photosynthesis of rice. 1. Leaf photosynthesis. European Journal of Plant Pathology. 1993;99:197–203. [Google Scholar]
- Berger S, Papadopoulos M, Schreiber U, Kaiser W, Roitsch T. Complex regulation of gene expression, photosynthesis and sugar levels by pathogen infection in tomato. Physiologia Plantarum. 2004;122:419–428. [Google Scholar]
- Boote KJ, Jones JW, Mishoe JW, Berger RD. Coupling pests to crop growth simulators to predict yield reductions. Phytopathology. 1983;73:1581–1587. [Google Scholar]
- Bushnell WR. Physiology of fungal haustoria. Annual Review of Phytopathology. 1972;10:151–176. [Google Scholar]
- Farrar JF. Beyond photosynthesis: the translocation and respiration of diseased leaves. In: Ayres PG, editor. Pest and pathogens: plant responses to foliar attack. Oxford: BIOS Scientific Publishers; 1992. pp. 107–127. [Google Scholar]
- Farrar JF, Lewis DH. Nutrient relations in biotrophic infections. In: Wood RKS, Jellis JG, editors. Fungal infections of plants. Oxford: Blackwell Scientific Publications; 1987. pp. 87–104. [Google Scholar]
- Garry G, Tivoli B, Jeuffroy MH, Citharel J. Effects of Ascochyta blight caused by Mycosphaerella pinodes on the translocation of carbohydrates and nitrogenous compounds from the leaf and hull to the seed of dried-pea. Plant Pathology. 1996;45:769–777. [Google Scholar]
- Gaunt RE, Wright AC. Disease–yield relationship in barley. 2. Contribution of stored stem reserves to grain filling. Plant Pathology. 1992;41:688–701. [Google Scholar]
- Genard M, Dauzat J, Franck N, et al. Carbon allocation in fruit trees: from theory to modelling Trees. 2008;22:269–282. [Google Scholar]
- Hayes MA, Feechan A, Dry IB. Involvement of abscisic acid in the coordinated regulation of a stress-inducible hexose transporter (VvHT5) and a cell wall invertase in grapevine in response to biotrophic fungal infection. Plant Physiology. 2010;153:211–221. doi: 10.1104/pp.110.154765. [DOI] [PMC free article] [PubMed] [Google Scholar]
- Johnson KB. Evaluation of a mechanistic model that describes potato crop losses caused by multiple pests. Phytopathology. 1992;82:363–369. [Google Scholar]
- Larson KC, Whitham TG. Competition between gall aphids and natural plant sinks: plant architecture affects resistance to galling. Oecologia. 1997;109:575–582. doi: 10.1007/s004420050119. [DOI] [PubMed] [Google Scholar]
- Manners JM, Gay JL. Transport, translocation and metabolism of 14C-photosynthates at the host parasite interface of Pisum sativum and Eryphise pisi. New Phytologist. 1982;91:221–244. [Google Scholar]
- Minchin PEH, Thorpe MR, Farrar JF. A simple mechanistic model of phloem transport which explains sink priority. Journal of Experimental Botany. 1993;44:947–955. [Google Scholar]
- Okwulehie IC. Translocation of 14C-(labelled) photosynthates in groundnut (Arachis hypogaea L.) infected with Macrophomina phaseoli (Maub) Ashby. Photosynthetica. 2000;38:473–476. [Google Scholar]
- Pérez-Garcia A, Pereira S, Pissarra J, et al. Cytosolic localization in tomato mesophyll cells of a novel glutamine synthetase induced in response to bacterial infection or phosphinothricin treatment. Planta. 1998;206:426–434. [Google Scholar]
- Pinnschmidt HO, Batchelor WD, Teng PS. Simulation of multiple species pest damage in rice using CERES-rice. Agricultural Systems. 1995;48:193–222. [Google Scholar]
- Robert C, Bancal M-O, Lannou C. Wheat leaf rust uredospore production and carbon and nitrogen export in relation to lesion size and density. Phytopathology. 2002;92:762–768. doi: 10.1094/PHYTO.2002.92.7.762. [DOI] [PubMed] [Google Scholar]
- Robert C, Bancal M-O, Nicolas P, Lannou C, Ney B. Analysis and modelling of effects of leaf rust and Septoria tritici blotch on wheat growth. Journal of Experimental Botany. 2004;55:1–16. doi: 10.1093/jxb/erh108. [DOI] [PubMed] [Google Scholar]
- Robert C, Bancal M-O, Ney B, Lannou C. Wheat leaf photosynthesis loss due to leaf rust, with respect to lesion development and leaf nitrogen status. New Phytologist. 2005;165:227–241. doi: 10.1111/j.1469-8137.2004.01237.x. [DOI] [PubMed] [Google Scholar]
- Rolland F, Baena-Gonzalez E, Sheen J. Sugar sensing and signaling in plants: conserved and novel mechanisms. Annual Review of Plant Biology. 2006;57:675–709. doi: 10.1146/annurev.arplant.57.032905.105441. [DOI] [PubMed] [Google Scholar]
- Sabri N, Dominy PJ, Clarke DD. The relative tolerances of wild and cultivated oats to infection by Erysiphe graminis f.sp. avenae: II. The effects of infection on photosynthesis and respiration. Physiological and Molecular Plant Pathology. 1997;50:321–335. [Google Scholar]
- Sache I. Effect of density and age of lesions on sporulation capacity and infection efficiency in wheat leaf rust (Puccinia recondita f.sp. tritici) Plant Pathology. 1997;46:581–589. [Google Scholar]
- Scholes JD, Rolfe SA. Photosynthesis in localised regions of oat leaves infected with crown rust (Puccinia coronata): quantitative imaging of chlorophyll fluorescence. Planta. 1996;199:573–582. [Google Scholar]
- Voegele RT, Mengden K. Rust haustoria: nutrient uptake and beyond. New Phytologist. 2003;159:93–100. doi: 10.1046/j.1469-8137.2003.00761.x. [DOI] [PubMed] [Google Scholar]
- Voegele RT, Struck C, Hahn M, Mendgen K. The role of haustoria in sugar supply during infection of broad bean by the rust fungus Uromyces fabae. Proceedings of the National Academy of Sciences USA. 2001;98:8133–8138. doi: 10.1073/pnas.131186798. [DOI] [PMC free article] [PubMed] [Google Scholar]
- Voegele RT, Wirsel SGR, Möll U, Lechner M, Mendgen K. Cloning and characterization of a novel invertase from the obligate biotroph Uromyces fabae and analysis of expression patterns of host and pathogen invertases in the course of infection. Molecular Plant–Microbe Interactions. 2006;19:625–634. doi: 10.1094/MPMI-19-0625. [DOI] [PubMed] [Google Scholar]
- Wahl R, Wippel K, Goos S, Kamper J, Sauer N. A novel high-affinity sucrose transporter is required for virulence of the plant pathogen Ustilago maydis. Plos Biology. 2010;8:e1000303. doi: 10.1371/journal.pbio.1000303. http://dx.doi.org/10.1371/journal.pbio.1000303 . [DOI] [PMC free article] [PubMed] [Google Scholar]
- West GB, Brown JH, Enquist BJ. A general model for the origin of allometric scaling laws in biology. Science. 1997;276:122–126. doi: 10.1126/science.276.5309.122. [DOI] [PubMed] [Google Scholar]
- Whipps JM, Lewis DH. Patterns of translocation, storage and interconversion of carbohydrates. In: Ayres PG, editor. Effects of disease on the physiology of the growing plant. Cambridge: Cambridge University Press; 1981. pp. 47–83. [Google Scholar]
- Wirsel SGR, Voegele RT, Mendgen KW. Differential regulation of gene expression in the obligate biotrophic interaction of Uromyces fabae with its host Vicia faba. Molecular Plant–Microbe Interactions. 2001;14:1319–1326. doi: 10.1094/MPMI.2001.14.11.1319. [DOI] [PubMed] [Google Scholar]