

SUMMARY
Skin papillomas arise as a result of clonal expansion of mutant cells. It has been proposed that the expansion of pretumoral cell clones is propelled not only by the increased proliferation capacity of mutant cells, but also by active cell selection. Previous studies in Drosophila describe a clonal selection process mediated by the Flower (Fwe) protein, whereby cells that express certain Fwe isoforms are recognized and forced to undergo apoptosis. It was further shown that knock down of fwe expression in Drosophila can prevent the clonal expansion of dMyc-overexpressing pretumoral cells. Here, we study the function of the single predicted mouse homolog of Drosophila Fwe, referred to as mFwe, by clonal overexpression of mFwe isoforms in Drosophila and by analyzing mFwe knock-out mice. We show that clonal overexpression of certain mFwe isoforms in Drosophila also triggers non-autonomous cell death, suggesting that Fwe function is evolutionarily conserved. Although mFwe-deficient mice display a normal phenotype, they develop a significantly lower number of skin papillomas upon exposure to DMBA/TPA two-stage skin carcinogenesis than do treated wild-type and mFwe heterozygous mice. Furthermore, mFwe expression is higher in papillomas and the papilloma-surrounding skin of treated wild-type mice compared with the skin of untreated wild-type mice. Thus, we propose that skin papilloma cells take advantage of mFwe activity to facilitate their clonal expansion.
INTRODUCTION
Tumor formation is preceded by clonal expansion of pretumoral mutant cells (Merlo et al., 2006; Rubin, 2011). Clones of pretumoral cells are often invisible to the naked eye owing to the absence of morphological alterations in the tissue. It has been proposed that such clones facilitate their own expansion by interacting with the surrounding normal cells (Slaughter et al., 1953; Prevo et al., 1999; Bisell and Radisky, 2001; Tabor et al., 2001; van Houten et al., 2002; Braakhuis et al., 2003; Diaz and Moreno, 2005; Laconi et al., 2008; Moreno, 2008; Rhiner and Moreno, 2009; Trevino et al., 2011). Such interaction can be driven by relative cell fitness status: cells of higher fitness are selected and persist in the tissue at the expense of less fit ones. For example, studies in Drosophila demonstrate that cells with higher levels of dMyc, the Drosophila homologue of the Myc proto-oncogene, interact with surrounding wild-type cells and eventually eliminate them from the tissue (de la Cova et al., 2004; Moreno and Basler, 2004).
Recent studies demonstrate that, in Drosophila, the mechanism through which cells of lower fitness are recognized and eliminated from a tissue depends on the function of an extracellular molecular code, called ‘the Flower code’ (Rhiner et al., 2010). This code is based on three isoforms of the Drosophila cell membrane protein Flower (dFwe): dFweubi, dFweLose-A and dFweLose-B. Basal levels of dFweubi are constantly produced in the Drosophila wing imaginal disc, but when cells of lower relative fitness (but which are viable on their own) appear, they are recognized owing to the upregulation of the dFweLose isoforms, which eventually leads to caspase-3 activation in such ‘loser’ cells. Interestingly, knock down of the Drosophila fwe gene (dfwe) was found to inhibit or delay the selection process, resulting in reduced clonal expansion of dMyc overexpressing epithelial cells (Rhiner et al., 2010). The dFweLose isoforms are sufficient to recognize, and essential to eliminate, cells of lower fitness.
The mammalian homologs of dfwe have not been studied so far and their function is not known. The dfwe gene has a single predicted homolog in mice: 5930434B04Rik (accession number: MGI:1924317). The mouse Fwe gene (mFwe) encodes six different transcripts, normally expressed at low levels in adult tissues, which are translated into four protein isoforms. In order to study the function of mFwe, we overexpressed the mFwe isoforms in Drosophila tissues such as wing imaginal discs. Furthermore, we used an mFwe constitutive knock-out mouse model to study the role of mFwe during skin tumorigenesis.
Here, we report that mFwe-deficient mice display normal development, phenotype and growth, but have lower susceptibility to skin papillomas induced by 7,12-dimethylbenz[α]anthracene (DMBA) and 12-O-tetradecanoylphorbol-13-acetate (TPA) (referred to as DMBA/TPA). Furthermore, we show that certain mFwe isoforms are upregulated during skin carcinogenesis, especially in areas surrounding skin papillomas. Because some of the mFwe isoforms seem to label cells as ‘losers’, as the dFweLoseA/B isoforms do, we propose that DMBA/TPA-induced skin papillomas use mFwe to grow at the expense of the surrounding normal skin.
RESULTS
5930434B04Rik is a likely homolog of dFwe
dFwe belongs to a unique superfamily of small proteins called CG6151-P, which are conserved from fungi to humans. All homologs share the putative conserved protein domain CG6151-P (Marchler-Bauer et al., 2009). Except for dFwe, the function of the remaining homologs is unknown. 5930434B04Rik is the single predicted homolog of dFwe, sharing 35% identity at the protein sequence level. The 5930434B04Rik locus produces six alternatively spliced protein-coding transcripts (Fig. 1A) (Flicek et al., 2010). These encode four protein isoforms, which we named mFwe1, mFwe2, mFwe3 and mFwe4, all predicted to be membrane proteins (Fig. 1B). The four isoforms differ in their number of transmembrane domains and in their C- or N-terminal domains (Néron et al., 2009; Hofmann and Stoffel, 1993; Krogh et al., 2001; Hirokawa et al., 1998; Tusnády and Simon, 1998).
Fig. 1.

The mFwe gene locus and mFwe protein isoforms, and their overexpression in Drosophila wing imaginal discs. (A) Schematic representation of the mFwe gene locus showing chromosome location and protein-coding alternative splice transcripts. The exon coding sequence is indicated with black boxes, whereas untranslated sequences are shown by white boxes. Exons are assigned a number, whereas alternative exons have been given a number and a letter (blue). The Ensembl transcript ID number (green) is provided next to each transcript. A red outline indicates the common exon that is targeted for deletion. (B) A cartoon displaying a membrane topology prediction for the four mFwe protein isoforms using the SOSUI algorithm. Identical transmembrane domains are indicated by a number. Protein domains that are encoded by exon 3 are shown in red. (C) Expression of HA-tagged mFwe proteins in Drosophila wing imaginal discs. Confocal fluorescence microscopy images of Drosophila wing imaginal discs stained with α-HA antibody. Expression of mFwe proteins is induced by hh-GAL4, the expression of which is restricted to the posterior EGFP-marked compartment. The images show overexpression of dFweLoseA-HA and mFwe4-HA. Panels to the right show z-sections of the same wing imaginal discs to visualize distribution of the proteins along the apico-basal axis of the epithelium. HA tag (red), EGFP (green), DAPI (blue). Magnification: 20×, 40×.
Expression levels of mFwe isoforms in adult mouse tissues
To analyze the expression of the mFwe splice variants in various tissues of adult C57BL/6 mice, we performed real-time quantitative PCR. We grouped mFwe mRNA splice variants into four different classes – mFwe1, mFwe2 (mFwe2a, mFwe2b, mFwe2c), mFwe3 and mFwe4 – because these different coding sequences generate four mFwe protein isoforms (Fig. 1A,B). The average expression level of these transcripts in several organs of adult wild-type mice is low, with mFwe1 and mFwe2 being the most abundant of all (supplementary material Fig. S1A–E). The higher expression of mFwe transcripts in tissues such as eyes and brain (supplementary material Fig. S1A–D), as compared with their abundance in the rest of the tissues analyzed, is consistent with the described expression and function of dFwe in the Drosophila nervous system (Yao et al., 2009).
Analysis of mFwe isoforms by gain-of-function assays in Drosophila
To find out whether mFwe protein isoforms could have a function similar to that of dFweLoseA/B proteins, we tested the effect of their overexpression on cell survival. A previous study showed that overexpression of dFweLoseA/B in Drosophila S2 cultured cells or in clones of cells in Drosophila larvae epithelia induced cell death and clone disappearance (Rhiner et al., 2010). When we overexpressed mFwe isoforms in several types of mammalian cells in culture, we did not observe a similar effect (data not shown). Thus, we assayed the function of mFwe isoforms by expressing them as transgenes in Drosophila (Fig. 1C). We observed that overexpression of HA-tagged mFwe1 and mFwe3 (mFwe1-HA and mFwe3-HA, respectively) in clones of cells in Drosophila wing imaginal discs over time induced apoptosis and reduced clone survival to a similar extent as the overexpression of dFweLoseA-HA did (Fig. 2A–C; supplementary material Fig. S2). By contrast, overexpression of mFwe2-HA and mFwe4-HA in clones, did not affect clone survival, similar to the overexpression of the lacZ control (Fig. 2A,B; supplementary material Fig. S2). The reduced clone survival upon overexpression of mFwe1-HA and mFwe3-HA was not due to a toxic effect of heterologous protein overexpression, because overexpression of mFwe1-HA or mFwe3-HA throughout the whole posterior imaginal disc compartment or in the entire fly did not compromise cell viability (Fig. 2D and data not shown). These results suggest that the ability of dFweLoseA/B to induce cell selection by non-autonomous apoptosis could be conserved in mammals.
Fig. 2.

Analysis of mFwe isoforms by gain-of-function assays in Drosophila and quantification of mFwe transcripts in skin papillomas and papilloma-surrounding skin in mice. (A) Assay of mFwe function by generation of random gain-of-function clones of cells in Drosophila wing imaginal discs. Confocal fluorescence microscopy images of Drosophila wing imaginal discs with Act>gal4 EGFP-marked clones that overexpress the indicated transgenes at 72 hours after clone induction (ACI). DAPI (blue), EGFP (green). Magnification: 20×. (B) Average area occupied by Act>gal4 EGFP-marked clones, represented as percent of total disc area, at 72 hours ACI. The percent area occupied by the clones of each genotype is compared to the lacZ-expressing clones (negative control): statistical significant difference (**P<0.01, ***P<0.001, Student’s t-test) is found for comparisons of UASmFwe1-HA and UASlacZ, UASmFwe3-HA and UASlacZ, UASdFweLoseA-HA and UASlacZ. Data are means ± s.e.m. For each transgene, at least 20 wing imaginal discs were analyzed. (C) Confocal microscopy image of activated caspase-3 (C3) immunofluorescence staining in Drosophila wing imaginal discs: mFwe1-HA is overexpressed in EGFP-marked clones of cells. The image to the left shows fluorescence signal from activated caspase-3 only, with delineation of EGFP-marked clones by white contours. (D) Confocal microscopy image of activated caspase-3 (C3) immunofluorescence staining in the Drosophila wing imaginal disc posterior compartment, marked by EGFP. The image to the left shows fluorescence signal from activated caspase 3 only, with delineation of the posterior compartment by white contours. (E) Real-time quantitative PCR analyses of the expression of mFwe1 transcript in wild-type papilloma and corresponding papilloma-surrounding skin samples. The plot represents fold change in mFwe1 expression relative to its expression in wild-type skin of age-matched mice not treated with DMBA/TPA. The mRNA expression was previously normalized to the expression of the β-actin housekeeping gene. The data represent means ± s.e.m. of analyses of samples from three mice per condition. *P<0.05, Student’s t-test of comparison between expression level in papilloma-surrounding skin (black) and untreated skin (gray).
mFwe mRNA is induced in papilloma-surrounding skin
Previous studies in Drosophila showed that the expression of two of the dfwe alternative transcripts, dfweLoseA and dfweLoseB, is restricted specifically to cells of lower fitness, for example those cells that surround dMyc-overexpressing clones of cells (Rhiner et al., 2010). We reasoned that, similarly, mammalian models of tumorigenesis could provide situations in which cells of different fitness levels are juxtaposed within a tissue. Therefore, measuring the expression level of mFwe transcripts in a tumor and the surrounding non-affected tissue could provide information on the fitness status of tumor cells relative to the adjacent normal cells. Thus, we checked whether the mFwe transcripts were differentially expressed in papillomas and surrounding normal tissue after subjecting C57BL/6 mice to the DMBA/TPA carcinogenesis protocol (Fig. 2E). We found that mFwe1 showed the highest expression level in DMBA/TPA-treated papilloma-surrounding tissue and the lowest expression in wild-type skin of age-matched mice that were not treated with DMBA/TPA (Fig. 2E). We observed a similar pattern of expression for mFwe2 (supplementary material Fig. S1F). Taken together, the study of mFwe isoform overexpression in Drosophila (Fig. 2A–D) and the expression pattern of mFwe isoforms in skin papillomas and papilloma-surrounding skin in mice (Fig. 2E; supplementary material Fig. S1F) suggest that, as is the case for dFweLoseA/B, mFwe1 could mark cells as ‘losers’.
mFwe knock-out mice
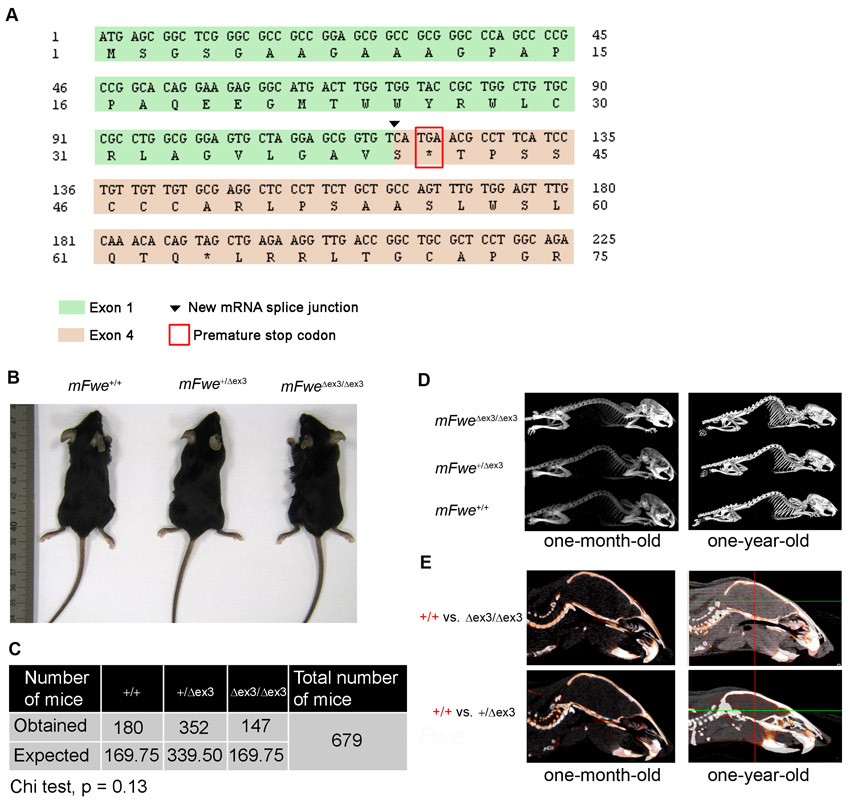
To further study the possible function of mFwe as a marker of potentially less fit cells in vivo, we generated mFwe knock-out mice by targeted deletion of exon 3, which affects all isoforms (Fig. 3A–C). Hereafter, we designate the mFwe targeted allele ‘Δex3’ to specify the deletion of mFwe exon 3 and we refer to the mice carrying this allele as mFwe knock-out mice. After Cre-mediated excision of the loxP-flanked exon 3 (Fig. 3A), a frameshift causes mRNA splicing to occur between exon 1 and exon 4, thus generating a premature stop codon at the beginning of exon 4 (supplementary material Fig. S3A). The resulting truncated protein, encoded by exon 1, is 41 amino acids long and is predicted to be a soluble protein (supplementary material Fig. S3A). Because it is not exposed to the cell surface, we presume that it does not have any function.
Fig. 3.

Generation of mFwe constitutive knock-out mice. (A) Schematic outline of the gene targeting strategy used to generate mFwe constitutive knock-out mice. Solid black line represents chromosome sequence; black and white rectangles represent coding and non-coding exons, respectively. Alternative exons are represented above the locus with gray and/or white rectangles. The translation initiation codon (ATG) and the stop codon (STOP) are indicated. loxP sequences are represented by red triangles. The PGK-Neo positive-selection cassette is indicated with a blue box. FRT sequences are represented by double magenta triangles. NheI restriction sites for 3′ Southern blot strategy are indicated by gray vertical lines. Gray horizontal lines indicate the length and location of the DNA fragments produced upon digestion with NheI enzyme during the Southern blot procedure. The length of these fragments is indicative of mFwe wild-type (WT) and knock-out (KO) alleles. The location of the external 3× probe for Southern blot is indicated with a red box. The forward and reverse primers used for PCR genotyping are indicated with white triangles. Black horizontal lines indicate the length and position of PCR fragments corresponding to the WT and mutant alleles. To generate constitutive knock-out mice, the loxP-flanked exon 3 (floxed allele) is removed by crossing to a germline::Cre deleter mouse. (B) Southern blot verification of the presence of the mFwe mutant (Δex3) allele. (C) PCR genotyping of mice carrying the mFwe Δex3 allele. (D) Semi-quantitative RT-PCR analyses of mFwe transcript expression in the indicated tissues using primers complementary to exon 3 and exon 4 confirms the absence of mFwe mRNA expression in the mFwe mutant animals and its decreased expression in mFwe+/Δex3 mice. Amplification of Gapdh cDNA serves as an internal PCR control.
We verified the absence of mFwe mRNA expression in mFweΔex3/Δex3 mice and the reduced mFwe mRNA expression in mFwe heterozygous mice (Fig. 3D). The deletion of exon 3 and the generation of a premature stop codon were confirmed by sequencing the corresponding mFwe transcripts in mFweΔex3/Δex3 mice (supplementary material Fig. S3A). We did not detect expression of the remaining short transcript upon transfection in cultured cells, suggesting that the truncated mFwe protein is non-functional and is rapidly degraded within the cell (data not shown).
mFwe-deficient mice show a normal phenotype and are protected against skin carcinogenesis
mFwe-deficient mice develop and grow normally (supplementary material Fig. S3B–E), unlike dfwe mutants (Rhiner et al., 2010; Yao et al., 2009), which are not viable. Anatomical and histological examinations did not reveal any abnormality in mFwe-deficient animals when compared with mFwe heterozygous or wild-type littermates (supplementary material Fig. S3B–E).
Because reduction of dFwe expression can slow down the expansion of dMyc-overexpressing pretumoral clones of cells without affecting normal tissue growth (Rhiner et al., 2010), we sought to test whether lack of mFwe could have a beneficial effect on tumorigenesis in mice. Therefore, we subjected constitutive mFwe knock-out, mFwe heterozygous and wild-type mice to the DMBA/TPA skin carcinogenesis protocol, which induces skin papilloma formation (Fig. 4A). This protocol entails a single treatment with a low dose of the DMBA carcinogen, which ‘initiates’ pretumoral lesions in the epidermis by causing oncogenic mutations in the ras gene (Quintanilla et al., 1986), and subsequent repeated treatments with the tumor promoter TPA, which promotes papilloma formation by stimulating the proliferation and clonal expansion of initiated (mutant) cells (DiGiovanni, 1992; Abel et al., 2009; Yuspa, 1998). We were particularly interested in analyzing the initiation and promotion phases of tumorigenesis because they represent the early, pre-neoplastic stages of skin carcinogenesis (Fig. 4A).
Fig. 4.

mFwe knock-out mice are resistant to DMBA/TPA-induced skin carcinogenesis. 8- to 12-week-old mFwe+/+, mFweΔex3/+ and mFweΔex3/Δex3 mice were subjected to two-step chemical carcinogenesis with DMBA and TPA. (A) Timing of DMBA/TPA skin carcinogenesis protocol. (B) Dorsal view of mFwe+/+ and mFweΔex3/Δex3 mice after 15 weeks of DMBA/TPA treatment. (C) Average number of papillomas per mouse. The difference in average tumor number between wild-type and knock-out or between heterozygous and knock-out mice becomes significant from week 10 onwards; *P<0.05, Student’s t-test. From week 13 onwards, the difference between the number of papillomas in wild-type and in mFweΔex3/Δex3 mice is also significant according to the Mann-Whitney test: P<0.05. (D) Tumor incidence. Comparison of mFwe+/+ and mFweΔex3/Δex3 incidence curves: P=0.06 (log-rank test) and P<0.05 (Gehan-Breslow-Wilcoxon test). (E) Immunohistochemical analyses of mFwe Δex3/Δex3 papillomas and papilloma-surrounding epidermis. Quantification of Ki67-positive area in papilloma and papilloma-surrounding epidermis of mFwe+/+ and mFweΔex3/Δex3 mice is shown to the right. Papilloma-surrounding skin is normal-looking skin that occupies 1000 μm at each side of the corresponding tumor analyzed. Data represent measurements from five mice per genotype. Bars are s.e.m. Panels to the left show representative images of the immunostainings. Brown color indicates immunostaining signal. Insets show magnified images of regions from the corresponding tissue. Red arrowheads indicate Ki67-positive cells at the basal layer of the skin epidermis. Scale bars: 200 μm (E, top); 100 μm (E, bottom).
The number of papillomas that appeared in mFwe-deficient mice was strongly reduced (1.5 papillomas/mouse at week 15) compared with the number of papillomas observed in wild-type (3.9 papillomas/mouse at week 15) or mFwe heterozygous (5 papillomas/mouse at week 15) littermates (Fig. 4B,C). This difference remained significant from week 10 until the end of the DMBA/TPA carcinogenesis protocol (Fig. 4A–C). Moreover, three out of 14 mFweΔex3/Δex3 mice did not develop any tumors during the entire protocol. All mFweΔex3/Δex3 mice started to develop papillomas at slightly later time points (Fig. 4D) than did wild-type or heterozygous mice, suggesting that the absence of mFwe protein was also delaying the process of papilloma formation in the skin.
Decreased proliferation of mFwe-deficient papilloma cells
To understand how deficiency of mFwe could account for the reduced number of skin papillomas induced by DMBA/TPA, we analyzed papillomas and papilloma-surrounding skin both macroscopically and at the tissue and cell level. Examination of tumor samples according to previous classification criteria (Klein-Szanto, 1997) and staining for the keratinocyte differentiation marker cytokeratin 10 revealed that papillomas from the three experimental groups were of similar size and consisted of well-differentiated, hyperplastic lesions with no atypical cells, or with very few atypical cells in the basal layer (supplementary material Fig. S4A,B). To evaluate whether the reduced number of papillomas observed in the mFwe-deficient mice could reflect compromised proliferation of mFwe-deficient pretumoral cells, we stained papillomas and papilloma-surrounding tissue of wild-type and mFwe-deficient mice with Ki67, a marker of proliferating cells (Fig. 4E). Interestingly, the level of cell proliferation was significantly higher (P<0.01, Student’s t-test) in wild-type papillomas than in papillomas of mFwe-deficient mice. By contrast, the proliferation level in the papilloma-surrounding skin was similar in wild-type and mFwe knock-out mice (Fig. 4E). Furthermore, we did not detect any significant difference in cell proliferation between wild-type and mFwe knock-out epidermis that was not treated with DMBA/TPA (supplementary material Fig. S4C). Thus, the lower cell proliferation observed in papillomas of mFwe-deficient mice compared with wild-type mice (Fig. 4E) is not due to an intrinsic, reduced capacity of mFwe-deficient skin cells to proliferate and is therefore specifically affected in mFwe-deficient skin papilloma cells. Thus, the lower number of papillomas in mFwe-deficient mice could be due, at least in part, to the reduced capacity of skin papilloma cells to proliferate in the absence of mFwe.
In Drosophila, increased expression of dFweLoseA/B triggers cell non-autonomous apoptosis (Rhiner et al., 2010). To check whether expression of mFwe affects apoptosis levels in papilloma-surrounding skin relative to papillomas, we measured the number of activated caspase-3-positive cells in papillomas and papilloma-surrounding skin of wild-type and mFweΔex3/Δex3 mice (supplementary material Fig. S4D,E). For both wild-type and mFweΔex3/Δex3mice, we observed a higher number of apoptotic cells, 0.006 cells/μm2 and 0.0016 cells/μm2, respectively, in papilloma-surrounding skin compared with papillomas (supplementary material Fig. S4E). We also observed that mFweΔex3/Δex3 mice showed an increased number of apoptotic cells in both papillomas and papilloma-surrounding skin compared with wild-type mice. We expressed the difference in apoptosis levels between papilloma-surrounding skin and papillomas as a ratio of the number of apoptotic cells in papilloma-surrounding skin and the number of apoptotic cells in papillomas (supplementary material Fig. S4E). By comparing the ratios obtained for both genotypes, we could estimate to what extent the level of apoptosis in a papilloma and in the adjacent skin differs, i.e. the relative levels of apoptosis. The ratio obtained for mFweΔex3/Δex3 mice showed that, for each cell dying inside a papilloma, there are 1.62 cells dying in the adjacent tissue, whereas, in wild-type mice, for each cell dying inside a papilloma, there are 1.74 cells dying outside it. The slightly smaller difference in apoptosis levels (1.62) between papilloma and papilloma-surrounding skin in the mFwe mutants suggests that, somehow, mFwe expression is needed for papillomas to grow by increasing apoptosis of the surrounding normal cells.
DISCUSSION
Here, we report for the first time data about the possible function of mFwe – the predicted homolog of the Drosophila cell competition gene dfwe. We find that, like dFweLoseA/B isoforms, mFwe1 and mFwe3 induce non-autonomous apoptosis when overexpressed in Drosophila wing imaginal disc cells: apoptosis was only observed when these proteins were overexpressed in clones of cells in the epithelial tissue, whereas no cell death was triggered if the entire tissue overexpressed mFwe1 or mFwe3 (Fig. 2A–D). These results suggest a functional conservation between mFwe1/3 and dFweLoseA/B; however, further mechanistic studies are needed to confirm this.
In Drosophila, cells of higher fitness use ‘the Flower code’ to proliferate by inducing expression of dFweLoseA/B in the surrounding loser cells (Rhiner et al., 2010). Similarly, we observe higher expression of certain mFwe isoforms in mice, mainly in papilloma-surrounding skin compared to papillomas (Fig. 2E). This finding again indicates a possible functional conservation between mFwe and dFwe, and further suggests that cellular selection based on relative fitness states could drive the clonal expansion of pretumoral cells at the expense of surrounding wild-type cells.
Here, we find that, during skin papilloma formation, the expression of mFwe1 and mFwe2 isoforms increases significantly (Fig. 2E; supplementary material Fig. S1F); however, in Drosophila, only mFwe1 overexpression is able to mark cells as ‘losers’ (Fig. 2A,B). Similarly, mFwe3 and mFwe4 tend to increase their expression during skin papilloma formation (supplementary material Fig. S1F); however, overexpression of mFwe3, but not of mFwe4, labels cells as ‘losers’ in Drosophila (Fig. 2A,B). Taken together, we suggest that the function of mFwe during skin papilloma formation can be based on a molecular code that relies simply on the overexpression of the mouse ‘Lose’-like isoforms (mFwe1 and to a lesser extent mFwe3). Likewise, overexpression of dFweLose isoforms in Drosophila wing imaginal discs is sufficient and necessary to label cells as ‘losers’ (Rhiner et al., 2010). Thus, in mice, ‘healthy’ cells seem to express nothing similar to dFweubi, but ‘loser’ cells express the mFwe1 isoform, which behaves as dFweLose does. Further experiments using inducible knock-in mice and cell-specific deletion of mFwe could help to understand the function of each isoform and reveal whether mFwe functions to label cells that are going to be eliminated during cell selection processes.
Another indication of a functional conservation between these proteins is our finding that mFwe deficiency reduces the capacity of skin papilloma cells to proliferate (Fig. 4E; supplementary material Fig. S4C). The slower growth of a clone of pretumoral cells could partially explain why mFwe-deficient mice develop a lower number of papillomas when treated with DMBA/TPA (Fig. 4C). Importantly, this growth disadvantage occurs only in skin papilloma cells and does not affect mouse development or organ size (supplementary material Fig. S3B–E).
In addition, we report that papilloma-surrounding skin, in which the ‘Lose’-like mFwe1 isoform is upregulated, shows an increased number of apoptotic cells as compared with papillomas in both wild-type and mFweΔex3/Δex3 mice (supplementary material Fig. S4D,E). However, the difference in apoptosis levels between a papilloma and papilloma-surrounding skin is slightly reduced in mFweΔex3/Δex3 mice, suggesting that expression of mFwe1 could be the cause for the increased apoptosis in papilloma-surrounding skin relative to a papilloma. At present, we do not know why mFwe mutant mice have an elevated number of apoptotic cells in both papillomas and papilloma-surrounding skin compared with wild-type mice (supplementary material Fig. S4E). Further studies are needed to clarify the relationship between apoptosis, mFwe expression and cell selection.
If a role of mFwe for selecting the fittest cells within a tissue were confirmed, it would be interesting to test whether mFwe-deficient mice develop signs of tissue fitness ‘decay’ with age and whether this is due to the accumulation of less fit cells. In addition, it would be important to further examine the role of mFwe in described cell competition scenarios in mammals (Tamori et al., 2010; Bondar and Medzhitov, 2010; Oliver et al., 2004; Oertel et al., 2006) and during carcinogenesis (Hogan et al., 2009; Sansom et al., 2007). In particular, it would be interesting to explore to what extent cell selection processes occurring within tumors and at the border between a tumor and normal tissue contribute to tumor growth. Detailed analyses using mFwe mosaic mice should shed light on these questions.
In summary, we provide evidence that mFwe deficiency specifically impairs skin papilloma formation and proliferation without affecting normal tissue growth, thus suggesting a similar role of Fwe in Drosophila and mice. Furthermore, our study could provide an additional tool to study the interaction between cancer and normal cells.
METHODS
Generation of mFwe knock-out mice
The mFwe knock-out mouse was developed using genOway technical services (genOway, France). The targeting vector for generation of the mFwe targeted allele was constructed using genomic DNA (21.3 kb) from a 129Sv/Pas miniBAC library and was electroporated into 129Sv/Pas mouse embryonic stem (ES) cells. Screening for homologous recombination was done by PCR and Southern blot strategies. The 3′ Southern blot screening is based on digestion of genomic DNA with NheI and hybridization of an external 523 bp probe downstream of the 3′ homology sequence of the mFwe targeting vector. ES cells from positive ES cell clones were microinjected into C57BL/6 blastocysts. To generate constitutive knock-out mice, the loxP-flanked exon 3 was removed by crossing to germline::Cre deleter mice. Constitutive mFwe knock-out mice were screened by PCR using the primers FW 5′-CTAACTACCCAAGCATCCTG-3′, RVex4 5′-CGCAGTTGAAGAGTCCAGAG-3′ and RVex3 5′-TACACCAAAGAATGACCCAC-3′, which yield 685 bp and 415 bp products for the mutant and wild-type alleles, respectively.
Mice maintenance and breeding
Mice were housed in a specific pathogen-free animal facility at the Spanish National Cancer Research Center (Madrid) according to the current legislation. All experiments with mice were previously approved by the Bioethics Committee of Instituto de Salud Carlos III. The animals were maintained by crossing to mice of a C57BL/6J genetic background. All experiments were performed using littermate mice.
Induction of skin papillomas
The back skin of 2- to 3-month old mFwe+/+, mFweΔex3/+ and mFweΔex3/Δex3 littermate mice was shaved and 1 day later was painted with a single dose of 25 μg DMBA (Sigma) dissolved in 200 μl acetone. 2 days later, tumor growth was promoted by applying 12.5 μg of TPA (Calbiochem) dissolved in 200 μl acetone twice a week for a period of 15 weeks. The mice were observed every 3 days and size, number and characteristics of the skin lesions were annotated. Measurement of tumor size was done twice per week using a digital caliper.
Histology and immunohistochemistry
Skin papillomas and surrounding skin were fixed in neutral-buffered formalin for 24 hours and subsequently embedded in paraffin. Sections of ∼5 μm were stained with hematoxylin and eosin following standard procedures. For immunohistochemistry, ∼5-μm tissue sections were incubated with anti-Ki67 (TEC-3; DAKO) or anti-activated caspase-3 antibody (R&D Systems).
RNA isolation and real-time qPCR
Total RNA of mouse tissues was extracted using Trizol reagent (Invitrogen) following the manufacturer’s instructions. It was treated with DNase I (Promega) and additionally purified using Qiagen RNeasy columns. cDNA was synthesized using SuperScript II reverse transcriptase (Invitrogen). Semi-quantitative PCR was done using an mFwe-specific primer that hybridizes to mFwe exon 3 (5′-CTCTTCAACTGCGTCACTAT-3′), a primer that hybridizes to mFwe exon 4 (5′-TGCCCACTGCTATCAAATAA-3′), and Gapdh-specific primers 5′-GTATGTCGTGGAGTCTACTG-3′ and 5′-TCATCATACTTGGCAGGTTT-3′. To quantify the abundance of mFwe transcripts in wild-type mice treated with the DMBA/TPA carcinogenesis protocol, total RNA was extracted separately from skin papillomas and the corresponding papilloma-surrounding skin, and was analyzed by real-time quantitative PCR. The expression level of each transcript in both samples was compared with its expression in the skin of age-matched wild-type mice not treated with DMBA/TPA. Papilloma-surrounding skin was normal-looking skin located within a diameter of approximately 1 cm from a papilloma. To determine the expression level of mFwe transcripts in different tissues of wild-type mice, total RNA was extracted from skin, brain, liver, pancreas, small intestine, colon, muscle, heart, spleen and eye tissue samples, and was analyzed by real-time quantitative PCR. Real-time quantitative PCR was performed using 0.5 μl of cDNA prepared from 3 μg of total RNA, 2× Power SYBR green PCR master mix (Applied Biosystems) and BioRad Single-Color PCR detection apparatus. All PCR reactions were set up in triplicates and the experiments were performed with at least three different samples. Data were analyzed using the comparative Ct method (Schmittgen and Livak, 2008). The Ct values of samples and controls were normalized to the expression level of the 18S endogenous housekeeping gene. The primers used were 18S-Fw 5′-GTAACCCGTTGAACCCCATT-3′, 18S-Rv 5′-CCATCCAATCGGTAGTAGCG-3′, mFwe1-Fw 5′-TCCACACTTCTCTGGTTCTG-3′, mFwe1-Rv 5′-GTGAGTACTGCTGTCTAGCC-3′, mFwe2-Fw 5′-CGATGCCATTTCTTATGCTC-3′, mFwe2-Rv 5′-TGACACTCAGTCTTCTCCAG-3′, mFwe3-Fw 5′-CAAACACAGTAGCTGAGAAGG-3′, mFwe3-Rv 5′-TAGAGGGAAATGGTGTTTCTG-3′, and mFwe4-Fw 5′-GTTTGCTAAATCCTGGGTGTC-3′, mFwe4-Rv 5′-GCGTTCATGATCATCCACAC-3′.
Cloning
cDNA encoding mFwe isoforms was amplified from total spleen cDNA of adult C57BL/6 mice using the primers: mFwe1 (5′-GCAGCGTTTAGCATGAG-3′, 5′-TCACCCGCAGTAGAAGAC-3′), mFwe2 (5′-GCAGCGTTTAGCATGAG-3′, 5′-CTCGAAAGTCTCCGCCA-3′), mFwe3 (5′-GCAGCGTTTAGCATGAG-3′, 5′-AAATGGTGTTTCTGTTCGG-3′) and mFwe4 (5′-AGCGGCTCGGGCGCCGCCGGA-3′, 5′-CTCGAAAGTCTCCGCCA-3′). Human Flower isoforms, which are very similar to the mouse isoforms, were also cloned (not shown; European Patent Application number EP12156256). An HA-tag sequence was included at the 3′ end of each mFwe cDNA by PCR. The cDNAs were cloned into pUASp vector (DGRC) using BamHI and XbaI restriction sites (for mFwe1-HA and mFwe3-HA), XbaI sites (for mFwe2-HA), or NotI and XbaI sites (for mFwe4-HA). Microinjection of these cDNA constructs into fly embryos was performed according to standard protocols.
TRANSLATIONAL IMPACT.
Clinical issue
Human epithelial cancers result from the successive accumulation of genetic alterations in the tissue. Clonal expansion of mutant cells is necessary for the accumulation of additional mutations and subsequent tumor formation. It is proposed that an active process of cell selection determines which cell persists in a tissue and forms a tumor. Such cell selection is based on a cell’s fitness status: a mutant cell of higher fitness can proliferate at the expense of cells of lower fitness, such as normal cells or cells carrying other types of mutations. A process of clonal expansion of mutant cells that causes no visible morphological change in the tissue is referred to as ‘field cancerization’. This term was first used in the clinic to explain the appearance of multiple primary tumors in the same region of a tissue or the local recurrence of secondary tumors following surgical resection. Field cancerization precedes tumor formation and is reported to occur in a wide variety of epithelial cancers. But is there a way to detect cancer cells before a tumor appears? Can the expansion of pretumor cell clones (i.e. the formation of cancer fields) be prevented so that tumors do not form? Biomarkers of cancerization fields are needed to address these issues. Treatment at the earliest possible stage is the most promising option for cancer therapy, but such an approach is precluded owing to the difficulty in detecting the early pretumor stages of cancer.
Results
In Drosophila, Flower protein can serve to delineate clones of pretumoral cells owing to the fact that it is specifically upregulated in normal cells that surround pretumoral clones of cells overexpressing the oncoprotein dMyc. Similarly, in this study, the authors demonstrate that its predicted mouse homolog, mFlower (mFwe), has increased expression in skin that surrounds papillomas in mice. They also show that Drosophila cells that express certain mFwe isoforms die by apoptosis only when surrounded by wild-type cells. Finally, they demonstrate that mFwe-deficient mice are resistant to skin papilloma formation when subjected to a protocol of chemically induced skin carcinogenesis. Because mFwe-deficient papillomas have a lower level of proliferation compared with wild-type controls, the authors suggest that mFwe expression at the border of skin papillomas somehow helps the clonal expansion of pretumoral cells.
Implications and future directions
These data indicate that future studies of mFwe are warranted because it has the potential to serve as a marker for delineation of field cancerization, as a biomarker for early cancer detection and/or, given the fact that mFwe deficiency does not affect normal growth and development, as a drug target for skin cancer treatment.
Computer tomography
Micro-computer tomography analyses were done in the Molecular Imaging Unit of CNIO using eXplore Vista micro PET-CT (GE Healthcare, UK) and MMWKS Vista-CT 4.7 software following standard procedures.
Transgenic flies and clone induction
Expression of transgenes encoding the different mFwe isoforms in Drosophila, gain-of-function assays and their analyses were performed as described previously (Rhiner et al., 2010).
Quantifications
Areas of EGFP-marked clones and wing discs were quantified using Adobe Photoshop (Adobe Systems). Quantification of Ki67-stained sections of papillomas and papilloma-surrounding skin (five mice per genotype) was performed automatically using AxioVision software (Carl Zeiss, Germany). All papillomas per mouse were analyzed. Papilloma-surrounding skin is normal-looking skin located within a distance of 1000 μm at each side of a tumor. The data represent the Ki67-positive area as a percentage of total area measured. For quantification of cell proliferation in wild-type and knock-out mice not treated with DMBA/TPA, Ki67-positive cells were counted manually in 20 photos at 40× magnification per mouse. The data represent the number of Ki67-positive cells per μm2 measured. Quantification of apoptosis in sections of papillomas and papilloma-surrounding skin stained for activated caspase-3 (three mice per genotype) was performed manually by counting the number of activated-caspase-3-positive cells in photos at 40× magnification that contain all papillomas and 1000 μm of normal skin at each side of every papilloma. The data represent the number of activated-caspase-3-positive cells per μm2 measured.
Statistical analyses
Statistical analyses were performed by Student’s t, chi and Mann-Whitney tests using Excel (Microsoft Office) or GraphPad Prism (GraphPad Software). For tumor-free curves, the log-rank test was used. Data represent means ± s.e.m.
Supplementary Material
Acknowledgments
We thank Sagrario Ortega, Giovanna Roncador, Isabel Blanco and Marta Cañamero for help.
Footnotes
COMPETING INTERESTS
A patent has been filed based on this work (European Patent Application number EP12156256).
AUTHOR CONTRIBUTIONS
E.M., J.M.L.-G. and E.P. conceived and designed the experiments, and wrote the paper; E.P. and J.M.L.-G. performed the experiments and analyzed the data; E.M., J.M.L.-G. and C.R. contributed reagents/materials/analysis tools.
FUNDING
This work was funded by the European Research Council [200130-2, ‘Supercompetitors’]; Caja Madrid; Mutua Madrileña Science Foundation [31003A_138359]; Swiss National Science Foundation; Josef Steiner Foundation; and Comunidad de Madrid.
SUPPLEMENTARY MATERIAL
Supplementary material for this article is available at http://dmm.biologists.org/lookup/suppl/doi:10.1242/dmm.008623/-/DC1
REFERENCES
- Abel E. L., Angel J. M., Kiguchi K., DiGiovanni J. (2009). Multi-stage chemical carcinogenesis in mouse skin: fundamentals and applications. Nat. Protoc. 4, 1350–1362 [DOI] [PMC free article] [PubMed] [Google Scholar]
- Bissell M. J., Radisky D. (2001). Putting tumours in context. Nat. Rev. Cancer 1, 46–54 [DOI] [PMC free article] [PubMed] [Google Scholar]
- Bondar T., Medzhitov R. (2010). p53-mediated hematopoietic stem and progenitor cell competition. Cell Stem Cell 6, 309–322 [DOI] [PMC free article] [PubMed] [Google Scholar]
- Braakhuis B. J., Tabor M. P., Kummer J. A., Leemans C. R., Brakenhoff R. H. (2003). A genetic explanation of Slaughter’s concept of field cancerization: evidence and clinical implications. Cancer Res. 63, 1727–1730 [PubMed] [Google Scholar]
- de la Cova C., Abril M., Bellosta P., Gallant P., Johnston L. A. (2004). Drosophila myc regulates organ size by inducing cell competition. Cell 117, 107–116 [DOI] [PubMed] [Google Scholar]
- Díaz B., Moreno E. (2005). The competitive nature of cells. Exp. Cell Res. 306, 317–322 [DOI] [PubMed] [Google Scholar]
- DiGiovanni J. (1992). Multistage carcinogenesis in the mouse skin. Pharmac. Ther. 54, 63–128 [DOI] [PubMed] [Google Scholar]
- Flicek P., Aken B. L., Ballester B., Beal K., Bragin E., Brent S., Chen Y., Clapham P., Coates G., Fairley S., et al. (2010). Ensembl’s 10th year. Nucleic Acids Res. 38, D557–D562 [DOI] [PMC free article] [PubMed] [Google Scholar]
- Hirokawa T., Boon-Chieng S., Mitaku S. (1998). SOSUI: classification and secondary structure prediction system for membrane proteins. Bioinformatics 14, 378–387 [DOI] [PubMed] [Google Scholar]
- Hofmann K., Stoffel W. (1993). TMBASE-a database of membrane spanning protein segments. Biol. Chem. HoppeSeyler 374, 166 [Google Scholar]
- Hogan C., Dupré-Crochet S., Norman M., Kajita M., Zimmermann C., Pelling A. E., Piddini E., Baena-López L. A., Vincent J. P., Itoh Y., et al. (2009). Characterization of the interface between normal and transformed epithelial cells. Nat. Cell. Biol. 11, 460–467 [DOI] [PubMed] [Google Scholar]
- Klein-Szanto A. J. P. (1997). Neoplastic and preneoplastic lesions of the mouse skin. In Pathology of Neoplasia and Preneoplasia in Rodents, Vol. 2 (ed. Bannash P., Gössner W.), pp. 1–18 Stuttgart: Schattauer Verlagsgesellschaft [Google Scholar]
- Krogh A., Larsson B., von Heijne G., Sonnhammer E. L. L. (2001). Predicting transmembrane protein topology with a hidden Markov model: application to complete genomes. J. Mol. Biol. 305, 567–580 [DOI] [PubMed] [Google Scholar]
- Laconi E., Doratiotto S., Vineis P. (2008). The microenvironments of multistage carcinogenesis. Semin. Cancer Biol. 18, 322–329 [DOI] [PubMed] [Google Scholar]
- Marchler-Bauer A., Anderson J. B., Chitsaz F., Derbyshire M. K., DeWeese-Scott C., Fong J. H., Geer L. Y., Geer R. C., Gonzales N. R., Gwadz M., et al. (2009). CDD: specific functional annotation with the Conserved Domain Database. Nucleic Acids Res. 37, D205–D210 [DOI] [PMC free article] [PubMed] [Google Scholar]
- Merlo L. M. F., Pepper J. W., Reid B. J., Maley C. C. (2006). Cancer as an evolutionary and ecological process. Nat. Rev. Cancer 6, 924–935 [DOI] [PubMed] [Google Scholar]
- Moreno E. (2008). Is cell competition relevant to cancer? Nat. Rev. Cancer 8, 141–147 [DOI] [PubMed] [Google Scholar]
- Moreno E., Basler K. (2004). dMyc transforms cells into supercompetitors. Cell 117, 117–129 [DOI] [PubMed] [Google Scholar]
- Néron B., Ménager H., Maufrais C., Joly N., Maupetit J., Letort S., Carrere S., Tuffery P., Letondal C. (2009). Mobyle: a new full web bioinformatics framework. Bioinformatics 25, 3005–3011 [DOI] [PMC free article] [PubMed] [Google Scholar]
- Oertel M., Menthena A., Dabeva M. D., Shafritz D. A. (2006). Cell competition leads to a high level of normal liver reconstitution by transplanted fetal liver stem/progenitor cells. Gastroenterology 130, 507–520 [DOI] [PubMed] [Google Scholar]
- Oliver E. R., Saunders T. L., Tarlé S. A., Glaser T. (2004). Ribosomal protein L24 defect in Belly spot and tail (Bst), a mouse Minute. Development 131, 3907–3920 [DOI] [PMC free article] [PubMed] [Google Scholar]
- Prevo L. J., Sanchez C. A., Galipeau P. C., Reid B. J. (1999). p53-mutant clones and field effects in Barrett’s esophagus. Cancer Res. 59, 4784–4787 [PubMed] [Google Scholar]
- Quintanilla M., Brown K., Ramsden M., Balmain A. (1986). Carcinogen-specific mutation and amplification of Ha-ras during mouse skin carcinogenesis. Nature 322, 78–80 [DOI] [PubMed] [Google Scholar]
- Rhiner C., Moreno E. (2009). Super competition as a possible mechanism to pioneer precancerous fields. Carcinogenesis 30, 723–728 [DOI] [PubMed] [Google Scholar]
- Rhiner C., López-Gay J., Soldini D., Casas-Tinto S., Martin F., Lombardía L., Moreno E. (2010). Flower forms an extracellular code that reveals the fitness of a cell to its neighbors in Drosophila. Dev. Cell 18, 1–14 [DOI] [PubMed] [Google Scholar]
- Rubin H. (2011). Fields and field cancerization: The preneoplastic origins of cancer. BioEssays 33, 224–231 [DOI] [PubMed] [Google Scholar]
- Sansom O. J., Meniel V. S., Muncan V., Phesse T. J., Wilkins J. A., Reed K. R., Vass J. K., Athineos D., Clevers H., Clarke A. R. (2007). Myc deletion rescues Apc deficiency in the small intestine. Nature 446, 676–679 [DOI] [PubMed] [Google Scholar]
- Schmittgen T. D., Livak K. J. (2008). Analyzing real-time PCR data by the comparative CT method. Nat. Protoc. 3, 1101–1108 [DOI] [PubMed] [Google Scholar]
- Slaughter D. P., Southwick H. W., Smejkal W. (1953). Field cancerization in oral stratified squamous epithelium; clinical implications of multicentric origin. Cancer 6, 963–968 [DOI] [PubMed] [Google Scholar]
- Tabor M. P., Brakenhoff R. H., van Houten V. M., Kummer J. A., Snel M. H., Snijders P. J., Snow G. B., Leemans C. R., Braakhuis B. J. (2001). Persistence of genetically altered fields in head and neck cancer patients: biological and clinical implications. Clin. Cancer Res. 7, 1523–1532 [PubMed] [Google Scholar]
- Tamori Y., Bialucha C. U., Tian A. G., Kajita M., Huang Y. C., Normam M., Harrison N., Poulton J., Ivanovitch K., Disch L., et al. (2010). Involvement of Lgl and Mahjong/VprBP in cell competition. PLoS Biol. 8, e1000423. [DOI] [PMC free article] [PubMed] [Google Scholar]
- Trevino V., Tadesse M. G., Vannucci M., Al-Shahrour F., Antczak P., Durant S., Bikfalvi A., Dopazo J., Campbell M. J., Falciani F. (2011). Analysis of normal-tumour tissue interaction in tumours: prediction of prostate cancer features from the molecular profile of adjacent normal cells. PLoS ONE 6, e16492. [DOI] [PMC free article] [PubMed] [Google Scholar]
- Tusnády G. E., Simon I. (1998). Principles governing amino acid composition of integral membrane proteins: application to topology prediction. J. Mol. Biol. 283, 489–506 [DOI] [PubMed] [Google Scholar]
- van Houten V. M., Tabor M. P., van den Brekel M. W., Kummer J. A., Denkers F., Dijkstra J., Leemans R., van der Waal I., Snow G. B., Brakenhoff R. H. (2002). Mutated p53 as a molecular marker for the diagnosis of head and neck cancer. J. Pathol. 198, 476–486 [DOI] [PubMed] [Google Scholar]
- Yao C., Lin Y. Q., Ly C. V., Ohyama T., Haueter C. M., Moiseenkova-Bell V. Y., Wensel T. G., Bellen H. J. (2009). A synaptic vesicle-associated Ca2+ channel promotes endocytosis and couples exocytosis to endocytosis. Cell 138, 947–960 [DOI] [PMC free article] [PubMed] [Google Scholar]
- Yuspa S. H. (1998). The pathogenesis of squamous cell cancer: lessons learned from studies of skin carcinogenesis. J. Dermatol. Sci. 17, 1–7 [DOI] [PubMed] [Google Scholar]
Associated Data
This section collects any data citations, data availability statements, or supplementary materials included in this article.