

Abstract
Objective
We report results of a pilot clinical study of a subcutaneous fluorescence affinity sensor (FAS) for continuous glucose monitoring conducted in people with type 1 and type 2 diabetes. The device was assessed based on performance, safety, and comfort level under acute conditions (4 h).
Research Design and Methods
A second-generation FAS (BioTex Inc., Houston, TX) was subcutaneously implanted in the abdomens of 12 people with diabetes, and its acute performance to excursions in blood glucose was monitored over 4 h. After 30–60 min the subjects, who all had fasting blood glucose levels of less than 200 mg/dl, received a glucose bolus of 75 g/liter dextrose by oral administration. Capillary blood glucose samples were obtained from the finger tip. The FAS data were retrospectively evaluated by linear least squares regression analysis and by the Clarke error grid method. Comfort levels during insertion, operation, and sensor removal were scored by the subjects using an analog pain scale.
Results
After retrospective calibration of 17 sensors implanted in 12 subjects, error grid analysis showed 97% of the paired values in zones A and B and 1.5% in zones C and D, respectively. The mean absolute relative error between sensor signal and capillary blood glucose was 13% [±15% standard deviation (SD), 100–350 mg/dl] with an average correlation coefficient of 0.84 (±0.24 SD). The actual average “warm-up” time for the FAS readings, at which highest correlation with glucose readings was determined, was 65 (±32 SD) min. Mean time lag was 4 (±5 SD) min during the initial operational hours. Pain levels during insertion and operation were modest.
Conclusions
The in vivo performance of the FAS demonstrates feasibility of the fluorescence affinity technology to determine blood glucose excursions accurately and safely under acute dynamic conditions in humans with type 1 and type 2 diabetes. Specific engineering challenges to sensor and instrumentation robustness remain. Further studies will be required to validate its promising performance over longer implantation duration (5–7 days) in people with diabetes.
Keywords: concanavalin A, fluorescence, fluorescence resonance energy transfer, optical affinity glucose sensor
Introduction
Type 1 and type 2 diabetes are diseases of glucose metabolism associated with significant long-term morbidity when glycemic levels remain uncontrolled.1–4 External restoration of glycemic levels through diet, lifestyle, and insulin therapy have been shown to dramatically reduce associated comorbidities. However, for optimal glycemic control, near-continuous measurement of blood glucose levels will be required. While several continuous glucose monitors—all of which are based on the electro-enzymatic principle—have been commercially released,5–10 they are indicated as adjunctive devices, used only for identifying trends, and cannot be relied upon without taking blood glucose readings with glucometers. Despite their unreliability, closed-loop studies performed in a clinical environment with these types of sensors demonstrated excellent glycemic control in people with diabetes over several days.11–14 This is mostly because of frequent daily in vivo recalibrations. However, no studies have been performed yet that have demonstrated reliable operation as part of a closed-loop feedback control system in a home setting. Therefore, the development of an accurate glucose-sensing device with high intrinsic system stability for blood glucose remains of utmost importance for the successful implementation of a reliable closed-loop system for improving glycemic control. The disadvantages of enzymatic glucose-sensing technologies are as follows: glucose diffusion is the rate-limiting step, its oxygen-dependence, the generation of self-destructive byproducts (e.g., hydrogen peroxide), and potential interferences of electrode-sensitive compounds in plasma (e.g., various drugs). Therefore, various groups have developed novel glucose-sensing schemes that are not hampered by those shortcomings. These promising technologies are relying not on signal generation as a result of an enzymatic reaction, but on an affinity-type binding reaction between a glucose-specific receptor (e.g., boronate group),15–17 a lectin [concanavalin A (ConA)],18–23 or an apoprotein (apo-GOx, an inactive form of glucose oxidase)24 and glucose itself or a glucose analog.
Our group at BioTex Inc. addressed this challenge by significantly advancing the concept of a fluorescence affinity sensor (FAS) that measures the glucose-depending change of fluorescence as the result of the reaction of a glucose-sensitive chemistry inside a hollow dialysis fiber coupled to optical fiber.25–28 The chemical reaction of the FAS can be described by the following equations:
| (1) |
| (2) |
The fluorescence signal is generated as the result of displacing the glucose analog (dextran) from the ConA-binding site by glucose based on fluorescence resonance energy transfer between a donor and an acceptor dye.27,28 We have improved on previous fluorescent chemistry assays developed by other groups29,30 by equipping the sensor with a number of advantageous parameters and by utilizing new fluorescent dyes among other things. These long-wavelength dyes possess strong fluorescent efficiency and excellent photostability. Further, the near-infrared wavelength region confers the ability to monitor inexpensive excitation and detection components. We have implemented an innovative process to achieve a viable dry sensor formulation that ensures good storage stability and high operational recovery upon rewetting. Also, it isnoteworthy to mention that the BioTex FAS successfully passed sterilization validation [e-beam, validation lab was North American Science Associates (NAMSA), Northwood, OH], demonstrating compliance of the manufacturing process with regulatory standards and compatibility of the sensor materials with the sterilization procedure. Furthermore, we have assessed biotoxicity of ConA for in vivo glucose sensing and published our results in a review paper.31 Our main conclusion is that the very low dose of ConA used in sensor implants in the adipose and subcutaneous tissue is safe. Various other in vivo studies in small and large animals were performed20,32 that further demonstrated safety and feasibility of our technology for continuous glucose sensing under in vivo conditions.
The goal of this study was to investigate the performance, overall mechanical robustness, safety, and comfort level of the FAS for glucose in a pilot study under acute in vivo conditions (4 h). The clinical accuracy and “warm-up” time required for correlation of sensor signal to changes in blood glucose was investigated.
Subjects and Methods
Subjects
The subjects included 12 adults (8 women and 4 men) with a mean age of 51 ± 13.6 years and type 1 (n = 2) or type 2 (n = 10) diabetes. Additional demographic descriptions are given in Table 1.
Table 1.
Demographics
| Sex | |
| Female | 8 |
| Male | 4 |
| Age (years; n = 14) | 51 ± 13.6 |
| Race | |
| Caucasian | 2 (17%) |
| Hispanic | 3 (25%) |
| African American | 7 (58%) |
| Body mass index (kg/m2) | 33.4 ± 4.8 |
| Baseline hemoglobin A1c (%; n = 9) | 7.2 ± 1.16 |
| Duration of diabetes (years; n = 8) | |
| Insulin prescription (n = 12) | 7.8 ± 4.3 |
| Pumps | 3 (25%) |
| Multiple daily injections | 2 (17%) |
| Oral agents | 7 (58%) |
Study Protocol
This pilot study was conducted at the practice managed by our collaborator Dr. Eric Orzeck in Houston, TX. Subjects arrived at the study site in a fasting state. An initial blood sample was taken to ensure that the eligibility criterion of blood glucose less than 200 mg/dl would be met. One or two FAS units were placed in the subcutaneous tissue at the abdomen lateral to the umbilicus on opposite sides. Note that the abdomen was decided as the preferred implantation site after initial results showed superior FAS performance in the abdomen over the lower forearm. After a sensor warm-up period (30–60 min), the subject drank 1 liter of dextrose solution containing 75 g/liter of dissolved glucose. This time point was chosen because FAS signal recovery after sensor rehydration (warm-up time) was completed as was demonstrated in previous in vitro experiments. Capillary blood glucose samples were taken every 20 min from the finger tip and measured with a blood glucose meter (Freestyle, Abbott Diabetes Care, Alameda, CA). Subjects remained seated in a chair for the duration of the experiment. After removal of the sensor, the implantation site was inspected for bleeding or red spots. The study protocol was approved by an independent institutional review board (TABS, Houston, TX). Written informed consent by the subjects was obtained prior to the start of the study.
Pain Level Assessment
All subjects were then asked to fill out a questionnaire to score pain levels during sensor insertion, during operation, and during sensor removal, using the analog Wong pain scale.33 The Wong pain scale rates pain from 0, “no hurt,” to 5, “hurts worst.”
BioTex Fluorescence Affinity Sensor
The BioTex FAS is a minimally invasive prototype device for monitoring glucose concentration in the interstitial space. The FAS consists of a platform to which the sensor is attached and an introducer needle for skin penetration (see Figure 1A). The platform facilitated the introduction of the 20 G introducer needle. After deployment of the introducer needle, the needle was retracted back into the introducer and the FAS remained beneath the surface of the skin (depth approximately 0.7–1 cm). The device was held in place by adhering the platform to the skin with TransporeTM tape (3M, St. Paul, MN). The glucose-sensitive fluorescence chemistry was contained inside glucose-permeable membrane housing at the distal tip of an optical fiber. After the installation of the platform and adherence to the skin, the FAS was connected to the FAS detector instrumentation via an optical fiber (approximate length 100 cm) through a magnetically coupled optical connector. The FAS detector instrumentation consisted of a light source and a wavelength-specific light detector (USB-2000 spectrophotometer) connected to a laptop computer that runs the glucose-signal analyzing software GSpectrum. The optical fiber connecting the FAS with the FAS instrumentation transmitted excitation light (λ = 647 nm) to the sensor. The fluorescence generated by the FAS chemistry in response to glucose was coupled back through the same optical fiber into the light detector. The light detector captured wavelength-specific fluorescence between 650 and 900 nm. Raw spectral intensity data were obtained by averaging three spectra taken within 30 s at 5 min intervals. Raw spectral data were then corrected by subtracting background intensity calculated as mean value from 1500 to 1800 pixels, and the ratio of the average of 20 pixels at 675 nm (glucose-sensitive peak) and 780 nm (glucose-insensitive peak) was calculated. This is defined as ratio signal. The software automatically updated the FAS signal every 5 min.
Figure 1.

(A) Schematics of the first-generation FAS, and (B) photographic image of an implanted FAS in the abdomen. A magnet-based optical coupler was employed to couple and uncouple the sensor platform with and from light source and detector unit (see A when uncoupled).
Fluorescence Affinity Sensor Sterilization
Fluorescence affinity sensor assembly was performed under clean conditions in a clean room facility. The sensor platform and the introducer were packaged in a pouch and sterilized by electron-beam irradiation (BeamOne, Denver, CO). The sterilization method passed sterilization validation performed by NAMSA. Sterilized sensor packages were stored in the dark at 4 °C until use.
Statistical Fluorescence Affinity Sensor Glucose Response Analysis
During this study, 17 sensors were successfully tested on 12 subjects. Individual FAS data points were generated by averaging ratio signal readings of three successive measurements within a 30 s time interval. R-stat software package (version 2.11.1 (1)) was used for retrospective data analysis. For calibration, the Deming method was employed, which fits the squared difference between the subcutaneous FAS data and the capillary blood glucose data to both sides.34 Standard errors of reference measurements and sensor values were assumed to be equal because the deviation between the different sampling compartments cannot be attached to one of the methods. The correlation coefficient (R) and mean absolute relative error (MARE) were computed in order to assess measurement accuracy. For each data pair, the minima of R and MARE was calculated for different warm-up times and for different lag-time offsets (delay in sensor response over glucose concentration change in capillary blood) from 0 to 20 min at 5 min intervals. Because of sensor-to-sensor differences in equilibration with the adipose tissue environment, calculated warm-up times were found varying between 25 and 90 min (see also Figure 2). Data pairs collected during this time frame that showed low correlation (R < 0.7) with blood glucose were, therefore, excluded from the analysis. As a result, the total number of paired values from the FAS and the blood glucose meter was n = 132. Clark error grid analysis35 was used to investigate the therapeutic significance of the differences in glucose concentrations between references and all sensor readings. For assessing clinical significance, the percentage of points in the A, B, C, D, and E regions of the Clarke error grid was then calculated for all matched data pairs.
Figure 2.

Response curves of various FASs implanted in different subjects during oral glucose tolerance test. (A) Two sensors responded successfully in one subject to changes in blood glucose (solid circles). W represents warm-up time, defined as adjustment period of FAS response in adipose tissue. This time period was not included in retrospective data analysis. D indicates the time point at which subject drank 1 liter of 75 g/ml-1 dextrose. B indicates time point at which sensor readings were interrupted by visit to bathroom. I indicates the administration of insulin. Asterisks indicate sensor readings that were omitted due to out-of-range values.
Results
Robustness of Optical Performance of the “Wired” Fluorescence Affinity Sensor
To ensure low-noise optical reading from the implanted FAS, the optical connector linking the sensor optical fiber to the optical fiber connected with the light source and detector needed to be immune to mechanical (movement) and external optical (fluorescent bulb light) perturbation. During the trial, it was determined that none of the potential noise sources had a significant impact on the optical signal. Visits of the subjects to the bathroom necessitated disconnection and reconnection of the optical fiber from the implanted sensor. In approximately 70% of the cases, the optical signal was the same as before recoupling. In the other 30% of cases, a slight shift in the ratio signal was observed. This signal shift was accounted for during postanalysis by adjusting the ratio signal to the signal measured prior to the event of decoupling. Such shifts could have been caused by slight changes in coupling efficiency as the result of the nonstandardized magnetic couplers that were used. However, it should be noted here that this artifact will be absent from the final device design, which will rely on a wireless design by integrating the light source and detector mounted inside the platform. This will entirely eliminate the need of any optical connector.
Acute Glucose Response of Fluorescence Affinity Sensor during Oral Glucose Tolerance Test
Figure 2 illustrates the response of different FASs tested in various people with diabetes during an oral glucose tolerance test. In Figure 2A, the glucose response of two sensors in one subject is shown. Both sensors behaved very similarly. The initial warm-up time (indicated as gray area in Figure 2) was very short (25 min), and both sensors followed the increase in blood glucose level after oral dextrose administration (indicated with capital D in Figure 2). In 90% of the subjects, the sensor had to be disconnected one to three times from the instrumentation for a visit to the bathroom (indicated as B). After sensor reconnection, glucose monitoring resumed without a significant effect on the sensor readings. Note that the warm-up time (indicated as W) of the sensors implanted in the same subject required equilibrating with the glucose concentration in adipose tissue varied from 25 min for the two sensors shown in Figure 1A to 90 min in Figures 1B and C. Possible reasons for this phenomenon will be discussed later. After the warm-up phase, the subsequent sensor readings behaved relatively closely to glycemic changes in adipose tissue with Rs ranging from 0.78 to 0.95 for all sensors.
Acute Performance Parameters of Fluorescence Affinity Sensor
Retrospective analysis was carried out by first performing a spectral deconvolution of the glucose-sensitive fluorescence at 675 nm from the excitation peak at 649 nm, followed by calibrating the synchronously measured FAS values and the capillary blood glucose concentrations by Deming regression. To account for individual differences in sensor readiness, data analysis was performed by calculating the time point at which MARE was lowest. At a mean ± standard deviation (SD) warm-up time of 65 ± 32 min, MARE ± SD was 13 ± 15% (100–350 mg/dl) of all 17 sensorspooled. The calculated in vivo warm-up time was therefore slightly higher than the warm-up (30–60 min) observed in vitro, and showing larger variation. Accounting for this time shift, the limits of agreement of the differences between capillary blood glucose values and FAS values versus their means was ±78 mg/dl. The mean R ± SD of all 17 sensors with blood glucose was 0.84 ± 0.24, and the mean ± SD time lag was 4 ± 5 min. The percentage of sensor values with different error margins after offset and time lag adjustment was calculated. Thirty-nine percent were within the 5% range of the relative error, 57% were within the 10%, 78% within the 20%, and 87% were within the 30% range, respectively.
Clinical Significance of Fluorescence Affinity Sensor In Vivo Data
The clinical relevance of the differences in the glucose concentrations between the FAS readings and the capillary blood glucose was analyzed with the Clarke error grid method. For the 132 data pairs, 77% of the data fell in zone A, 20% in zone B, 1.5% in zone C, and 1.5% in zone D (see Figure 3).
Figure 3.
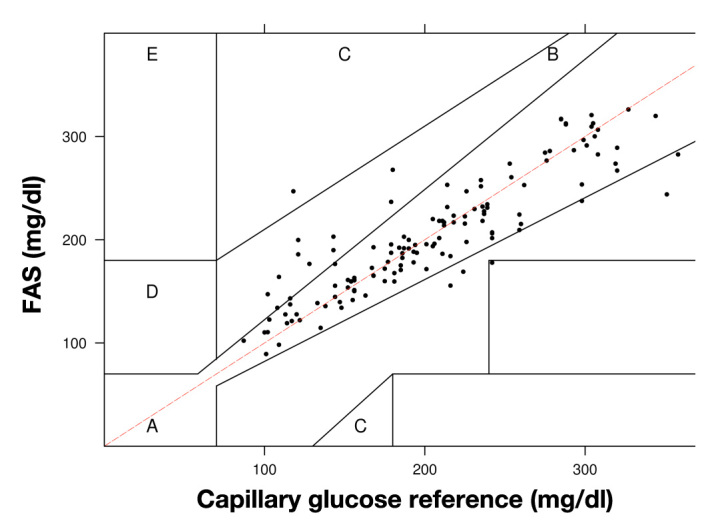
Clarke error grid analysis of capillary glucose reference and FAS readings. Data pairs (n = 132) were obtained from 17 sensors implanted in 12 subjects with diabetes type 1 or 2. The range of reference blood glucose levels was 100–350 mg/dl.
Safety and Comfort Levels
Side effects during insertion, operation, and removal of the FAS were recorded and the wound site inspected immediately after the experiment and 7 days later. Besides occasional minor bleeding during insertion and redness after sensor removal, no adverse effects (e.g., hematoma or anaphylactic shock) were observed. Subjects’ rating of pain level for sensor insertion, operation, and removal ranged from medium to low (or 2 to 1 on Wong pain scale).
Discussion
Development of a stable and accurate blood glucose monitoring device to implement the artificial pancreas was the driving force behind this research study. Previously, the FAS prototype went through various development and research phases in which its feasibility could be successfully demonstrated for glucose monitoring in in vitro experiments and in small and large animal in vivo experiments.20,32 The logical next step was to investigate the accuracy and safety of the FAS in a human pilot study. One key objective was to identify the warm-up time required for demonstrating sensor readiness—the ability of the sensor to track blood glucose—after sensor implantation. In the experiments, after retrospective correlation analysis between capillary blood glucose concentration and FAS readings, an average warm-up time of approximately 65 min (±32 min) among the 17 sensors was determined. For comparison, typical warm-up times for commercial glucose-sensing devices can range from 2 to 8 h.6,7 In contrast, readiness of the FAS under in vitro conditions was established after 30–90 min. Readiness of the FAS device is governed by the rehydration kinetics of the freeze-dried sensor formulation in subcutaneous skin tissue and the time required for the implanted sensor to reach an equilibrium with glucose diffusion in the interstitial fluid. The latter can be impacted by the invasive nature of sensor deployment, which can cause tissue and cell damage accompanied by blood clots. Both can affect diffusion of glucose to the sensor during the initial time period during implantation. Other factors, such as lower moisture content in adipose tissue (approximately 15%36), individual differences in ratio of fat/water in adipose tissue, and different degrees of skin trauma varying from subject to subject could also have affected the rehydration kinetics and, thereby, the time until correlation between sensor signal and blood glucose levels was established. In any case, for the sake of user convenience, fast sensor readiness within 60–120 min would be desirable. To further minimize the sensor-to-sensor variation in warm-up timeand to obtain consistent rehydration of the sensor components, we will consider bioinert additives that could act as “wicking” agents, such as mannitol—a Food and Drug Administration-approved bioinert drug additive.37
Data analysis of the FAS readings was performed retro-spectively, instead of prospectively as performed in the case of commercial enzyme-based sensors.38–43 Certainly, implementing prospective sensor data analysis relying on a one-point in vivo calibration will be an imperative feature of the next-generation FAS device in the near future. In order to achieve this, our research efforts are focused on developing a production process that needs to ensure low tolerances in the manufacturing process. For any sensor to be successfully implemented in a closed-loop system with an insulin pump, maintaining high accuracy with low recalibration frequency is of utmost importance in order to ensure that user-based errors (e.g., failure to recalibrate) in a home environment would not result in fatalities due to an inadvertent overdose of automatically administered insulin. In this study, the stability of the FAS response over 3 h was stable. This was not surprising, as we have previously demonstrated that the protein ConA exhibits high chemical stability under physiological conditions.20–22 In vitro data obtained with the FAS showed that, under optimal conditions, sensors maintained signal stability, i.e., with an average error of less than 20%, at an average calibration frequency of 0.5 per day or one recalibration every other day (unpublished data). For comparison, current commercial electroenzymatic sensors require a daily in vivo recalibration frequency (calibrations per day) of 0.8 (Freestyle Navigator, Abbott), 2.1 (Seven System,DexCom), and 2.3 (Guardian, Minimed). Loss of sensitivity of the enzyme-based sensor during in vivo operation has been determined as the primary reason to recalibrate them several times a day. It is generally accepted that the sensitivity to glucose in blood or serum appears to be retained best in electrodes that exhibit minimum responsiveness to electrode-interfering substances, e.g., plasma components or drugs.44,45 In comparison, the intrinsic binding reaction of the FAS has been shown to be resistant to physiological and nonphysiological interferrents. For example, results from an acute in vivo glucose-monitoring study with a viscometric affinity assay employing ConA, which showed a stable signal generation over 8 h, can further be taken as evidence for the robustness of the affinity-based sensing concepts relying on a non-electrode-based glucose detection system.23 Therefore, the FAS device could potentially lead to a superior alternative for its integration in a closed-loop system.
To summarize, this study generated the following results: (1) The sensor tracked blood glucose after an average warm-up time period of approximately 1 h with an average time lag of 4 min (±5 min) during the initial 2–3 h. (2) Sufficient optical signal was available throughout the experiment, and external light (ambient room light) did not seem to have a significant effect on readings. (3) Accuracy and the therapeutic value of the FAS device were promising. (4) The pain level during FAS insertion, operation, and removal was not problematic. (5) Good safety of the device could be established. To further validate the accuracy and stability of the FAS device in humans, future studies will be needed. The focus will be on performing a 7-day in vivo trial with the purpose of investigating the FAS accuracy after prospective calibration, the requirement for recalibration of the sensor under chronic conditions, and, last but not least, the capability of the FAS to detect hypoglycemic episodes, especially during nighttime.
Acknowledgments
This project was funded by a National Institutes of Health/Small Business Innovation Research grant (DK076352). We thank Kevin Pham and Charles Houssiere for their engineering support. We are indebted to the nurses Rachel Taylor and Pashona Woodrow for their support in providing assistance in performing the human trials.
Glossary
Abbreviations
- (ConA)
concanavalin A
- (FAS)
fluorescence affinity sensor
- (MARE)
mean absolute relative error
- (NAMSA)
North American Science Associates
- (R)
correlation coefficient
- (SD)
standard deviation
Disclosures
All authors, excluding Eric Orzeck, are employees of BioTex Inc. No competing financial interests exist.
References
- 1.National Institute of Diabetes and Digestive and Kidney Diseases. Diabetes overview. NIH-Pub 94-3235. 1994 [Google Scholar]
- 2.Cotran RS, Kumar V, Robbins SL. Robbins pathologic basis of disease. 4th ed. Philadelphia: W.B. Saunders; 1989. pp. 994–1005. [Google Scholar]
- 3.The Diabetes Control and Complication Trial Research Group. The effect of intensive treatment of diabetes on the development and progression of long-term complications in insulin-dependent diabetes mellitus. N Engl J Med. 1993;329(14):977–986. doi: 10.1056/NEJM199309303291401. [DOI] [PubMed] [Google Scholar]
- 4.Hanssen KF, Dahl-Jørgensen K, Lauritzen T, Feldt-Rasmussen B, Brinchmann-Hansen O, Deckert T. Diabetic control and microvascular complications: the near-normoglycaemic experience. Diabetologia. 1986;29(10):677–684. doi: 10.1007/BF00870275. [DOI] [PubMed] [Google Scholar]
- 5.Klonoff DC. Continuous glucose monitoring: roadmap for 21st century diabetes therapy. Diabetes Care. 2005;28(5):1231–1239. doi: 10.2337/diacare.28.5.1231. [DOI] [PubMed] [Google Scholar]
- 6.Mastrototaro JJ. The MiniMed continuous glucose monitoring system. Diabetes Technol Ther. 2000;(2 Suppl 1):S13–8. doi: 10.1089/15209150050214078. [DOI] [PubMed] [Google Scholar]
- 7.Feldman B, Brazg R, Schwartz S, Weinstein R. A continuous glucose sensor based on wired enzyme technology—results from a 3-day trial in patients with type 1 diabetes. Diabetes Technol Ther. 2003;5(5):769–779. doi: 10.1089/152091503322526978. [DOI] [PubMed] [Google Scholar]
- 8.The Diabetes Research in Children Network (DirecNet) Study Group. The accuracy of the Freestyle NavigatorTM continuous glucose monitoring system in children with type 1 diabetes. Diabetes Care. 2007;30(1):59–64. doi: 10.2337/dc06-1407. [DOI] [PMC free article] [PubMed] [Google Scholar]
- 9.Garg SK, Schwartz S, Edelman SV. Improved glucose excursions using an implantable real-time continuous glucose sensor in adults with type 1 diabetes. Diabetes Care. 2004;27(3):734–738. doi: 10.2337/diacare.27.3.734. [DOI] [PubMed] [Google Scholar]
- 10.Garg S, Zisser H, Schwartz S, Bailey T, Kaplan R, Ellis S, Jovanovic L. Improvement in glycemic excursions with a transcutaneous, real-time continuous glucose sensor: a randomized controlled trial. Diabetes Care. 2006;29:44–50. doi: 10.2337/diacare.29.01.06.dc05-1686. [DOI] [PubMed] [Google Scholar]
- 11.Steil GM, Rebrin K, Darwin C, Hariri F, Saad MF. Feasibility of automating insulin delivery for the treatment of type 1 diabetes. Diabetes. 2006;55(12):3344–3350. doi: 10.2337/db06-0419. [DOI] [PubMed] [Google Scholar]
- 12.Weinzimer SA, Steil GM, Swan KL, Dziura J, Kurtz N, Tamborlane WV. Fully automated closed-loop insulin delivery versus semiautomated hybrid control in pediatric patients with type 1 diabetes using an artificial pancreas. Diabetes Care. 2008;31(5):934–939. doi: 10.2337/dc07-1967. [DOI] [PubMed] [Google Scholar]
- 13.El-Khatib FH, Russell SJ, Nathan DM, Sutherlin RG, Damiano ER. A bihormonal closed-loop artificial pancreas for type 1 diabetes. Sci Transl Med. 2010;2(27) doi: 10.1126/scitranslmed.3000619. 27ra27. [DOI] [PMC free article] [PubMed] [Google Scholar]
- 14.Hovorka R, Kumareswaran K, Harris J, Allen JM, Elleri D, Xing D, Kollman C, Nodale M, Murphy HR, Dunger DB, Amiel SA, Heller SR, Wilinska ME, Evans ML. Overnight closed loop insulin delivery (artificial pancreas) in adults with type 1 diabetes: crossover randomised controlled studies. BMJ. 2011;342 doi: 10.1136/bmj.d1855. d1855. [DOI] [PMC free article] [PubMed] [Google Scholar]
- 15.Muscatello MM, Stunja LE, Asher SA. Polymerized crystalline colloidal array sensing of high glucose concentrations. Anal Chem. 2009;81(12):4978–4986. doi: 10.1021/ac900006x. [DOI] [PubMed] [Google Scholar]
- 16.Billingsley K, Balaconis MK, Dubach JM, Zhang N, Lim E, Francis KP, Clark HA. Fluorescent nano-optodes for glucose detection. Anal Chem. 2010;82(9):3707–3713. doi: 10.1021/ac100042e. [DOI] [PMC free article] [PubMed] [Google Scholar]
- 17.Tierney S, Falch BM, Hjelme DR, Stokke BT. Determination of glucose levels using a functionalized hydrogel-optical fiber biosensor: toward continuous monitoring of blood glucose in vivo. Anal Chem. 2009;81(9):3630–3636. doi: 10.1021/ac900019k. [DOI] [PubMed] [Google Scholar]
- 18.Schultz JS, Sims G. Affinity sensors for individual metabolites. Biotechnol Bioeng Symp. 1979;(9):65–71. [PubMed] [Google Scholar]
- 19.Ballerstadt R, Evans C, Gowda A, McNichols R. In vivo performance evaluation of a transdermal near- infrared fluorescence resonance energy transfer affinity sensor for continuous glucose monitoring. Diabetes Technol Ther. 2006;8(3):296–311. doi: 10.1089/dia.2006.8.296. [DOI] [PubMed] [Google Scholar]
- 20.Ballerstadt R, Evans C, Gowda A, McNichols R. Fiber-coupled fluorescence affinity sensor for 3-day in vivo glucose sensing. J Diabetes Sci Technol. 2007;1(3):384–393. doi: 10.1177/193229680700100311. [DOI] [PMC free article] [PubMed] [Google Scholar]
- 21.Ballerstadt R, Gowda A, McNichols R. Fluorescence resonance energy transfer-based near-infrared fluorescence sensor for glucose monitoring. Diabetes Technol Ther. 2004;6(2):191–200. doi: 10.1089/152091504773731375. [DOI] [PubMed] [Google Scholar]
- 22.Ehwald R, Ballerstädt R, Dautzenberg H. Viscosimetric affinity assay. Anal Biochem. 1996;234(1):1–8. doi: 10.1006/abio.1996.0040. [DOI] [PubMed] [Google Scholar]
- 23.Diem P, Kalt L, Haueter U, Krinelke L, Fajfr R, Reihl B, Beyer U. Clinical performance of a continuous viscometric affinity sensor for glucose. Diabetes Technol Ther. 2004;6(6):790–799. doi: 10.1089/dia.2004.6.790. [DOI] [PubMed] [Google Scholar]
- 24.Chinnayelka S, Zhu H, McShane M. Near-infrared resonance energy transfer glucose biosensors in hybrid microcapsule carriers. J Sensors. 2008 346016. [Google Scholar]
- 25.Schultz JS, Mansouri S, Goldstein IJ. Affinity sensor: a new technique for developing implantable sensors for glucose and other metabolites. Diabetes Care. 1982;5(3):245–253. doi: 10.2337/diacare.5.3.245. [DOI] [PubMed] [Google Scholar]
- 26.Mansouri S, Schultz JS. A miniature optical glucose sensor based on affinity binding. Nature Biotechnol. 1984;2:885–890. [Google Scholar]
- 27.Meadows DL, Schultz JS. Design, manufacture and characterization of an optical fiber glucose affinity sensor based on a homogenous fluorescence energy transfer assay system. Anal Chim Acta. 1993;280:21–30. [Google Scholar]
- 28.Ballerstadt R, Schultz JS. Competitive-binding assay method based on fluorescence quenching of ligands held in close proximity by a multivalent receptor. Anal Chim Acta. 1997;345(3-1):203–212. [Google Scholar]
- 29.Russell RJ, Pishko MV, Gefrides CC, McShane MJ, Coté GL. A fluorescence-based glucose biosensor using concanavalin A and dextran encapsulated in a poly(ethylene glycol) hydrogel. Anal Chem. 1999;71(15):3126–3132. doi: 10.1021/ac990060r. [DOI] [PubMed] [Google Scholar]
- 30.Tolosa L, Malak H, Gao R, Lakowicz JR. Optical assay for glucose based on luminescence decay time of the long wavelength dye Cy5™. Sensors Actuators B Chemicals. 1997;45:93–99. doi: 10.1016/S0925-4005(97)00275-X. [DOI] [PMC free article] [PubMed] [Google Scholar]
- 31.Ballerstadt R, Evans C, McNichols R, Gowda A. Concanavalin A for in vivo glucose sensing: a biotoxicity review. Biosens Biolectron. 2006;22(2):275–284. doi: 10.1016/j.bios.2006.01.008. [DOI] [PubMed] [Google Scholar]
- 32.Dutt-Ballerstadt R, Evans C, Gowda A, McNichols R. Preclinical in vivo study of a fluorescence affinity sensor for short-term continuous glucose monitoring in a small and large animal model. Diabetes Technol Ther. 2008;10(6):453–460. doi: 10.1089/dia.2008.0033. [DOI] [PMC free article] [PubMed] [Google Scholar]
- 33.Wong DL, Hockenberry-Eaton M, Wilson D, Winkelstein ML, Ahmann E, DiVito-Thomas PA. Whaley and Wong’s nursing care of infants and children. 6th ed. St. Louis: Mosby; 1999. [Google Scholar]
- 34.Deming WE. Statistical adjustment of data. New York: Dover; 1964. [Google Scholar]
- 35.Clarke WL, Cox D, Gonder-Frederick LA, Carter W, Pohl SL. Evaluating clinical accuracy of systems for self-monitoring of blood glucose. Diabetes Care. 1987;10(5):622–628. doi: 10.2337/diacare.10.5.622. [DOI] [PubMed] [Google Scholar]
- 36.Wang J, Pierson RN., Jr Disparate hydration of adipose and lean tissue require a new model for body water distribution in man. J Nutr. 1976;106(12):1687–1693. doi: 10.1093/jn/106.12.1687. [DOI] [PubMed] [Google Scholar]
- 37.Punitha S, Vedha Hari BN, Karthikeyan D. Enhancement of celecoxib solubility by solid dispersion using mannitol. Int J Pharm Pharm Sci. 2010;2(4):109–111. [Google Scholar]
- 38.Guerci B, Floriot M, Böhme P, Durain D, Benichou M, Jellimann S, Drouin P. Clinical performance of CGMS in type 1 diabetic patients treated by continuous subcutaneous insulin infusion using insulin analogs. Diabetes Care. 2003;26(3):582–589. doi: 10.2337/diacare.26.3.582. [DOI] [PubMed] [Google Scholar]
- 39.Metzger M, Leibowitz G, Wainstein J, Glaser B, Raz I. Reproduci-bility of glucose measurements using the glucose sensor. Diabetes Care. 2002;25(7):1185–1191. doi: 10.2337/diacare.25.7.1185. [DOI] [PubMed] [Google Scholar]
- 40.Food and Drug Administration. PMA P980022. Rockville: Food and Drug Administration; 1999. Summary of safety and effective-ness data for the MiniMed Continuous Glucose Monitoring System (CGMS) [Google Scholar]
- 41.Food and Drug Administration. PMA P050012. Rockville: Food and Drug Administration; 2006. DexComTM STSTM Continuous Glucose Monitoring System. [Google Scholar]
- 42.Food and Drug Administration. PMA P050020. Rockville: Food and Drug Administration; 2008. Summary of safety and effective-ness data for the FreeStyle Navigator continuous glucose monitoring system. [Google Scholar]
- 43.Maran A, Crepaldi C, Tiengo A, Grassi G, Vitali E, Pagano G, Bistoni S, Calabrese G, Santeusanio F, Leonetti F, Ribaudo M, Di Mario U, Annuzzi G, Genovese S, Riccardi G, Previti M, Cucinotta D, Giorgino F, Bellomo A, Giorgino R, Poscia A, Varalli M. Continuous subcutaneous glucose monitoring in diabetic patients: a multicenter analysis. Diabetes Care. 2002;25(2):347–352. doi: 10.2337/diacare.25.2.347. [DOI] [PubMed] [Google Scholar]
- 44.Linke B, Kiwit M, Thomas K, Krahwinkel M, Kerner W. Prevention of the decrease in sensitivity of an amperometric glucose sensor in undiluted human serum. Clin Chem. 1999;45(2):283–285. [PubMed] [Google Scholar]
- 45.Desai MA, Ghosh S, Crump PW, Benmakroha Y, Vadgama PM. Internal membranes and laminates for adaptation of amperometric enzyme electrodes to direct biofluid analysis. Scand J Clin Lab Invest Suppl. 1993;214:53–60. doi: 10.3109/00365519309090679. [DOI] [PubMed] [Google Scholar]