Abstract
Trabecular plates play an important role in determining elastic moduli of trabecular bone. However, the relative contribution of trabecular plates and rods to strength behavior is still not clear. In this study, individual trabeculae segmentation (ITS) and nonlinear finite element (FE) analyses were used to evaluate the roles of trabecular types and orientations in the failure initiation and progression in human vertebral trabecular bone. Fifteen human vertebral trabecular bone samples were imaged using micro computed tomography (μCT), and segmented using ITS into individual plates and rods by orientation (longitudinal, oblique, and transverse). Nonlinear FE analysis was conducted to perform a compression simulation for each sample up to 1% apparent strain. The apparent and relative trabecular number and tissue fraction of failed trabecular plates and rods were recorded during loading and data were stratified by trabecular orientation. More trabecular rods (both in number and tissue fraction) failed at the initiation of compression (0.1–0.2% apparent strain) while more plates failed around the apparent yield point (>0.7% apparent strain). A significant correlation between plate bone volume fraction (pBV/TV) and apparent yield strength was found (r2 = 0.85). From 0.3% to 1% apparent strain, significantly more longitudinal trabecular plate and transverse rod failed than other types of trabeculae. While failure initiates at rods and rods fail disproportionally to their number, plates contribute significantly to the apparent yield strength because of their larger number and tissue volume. The relative failed number and tissue fraction at apparent yield point indicate homogeneous local failure in plates and rods of different orientations.
Keywords: Finite element model, Trabecular plate/rod, Individual trabeculae segmentation, Trabecular orientation, Trabecular bone strength
1. Introduction
Trabecular bone plays an important role in load transmission and energy absorption in vertebral bodies. Previous study suggested that more than 75% of the load adjacent to endplates is carried by trabecular bone in a vertebral body (Eswaran et al., 2006, 2007; Silva et al., 1997). With aging, perforations of trabecular plates and breakages of trabecular rods in vertebral bone lead to a weakened trabecular bone network, which impairs the strength of vertebral bodies. Several studies have recognized the importance of trabecular types (plates and rods) in determining the mechanical properties of trabecular bone (Liu et al., 2006, 2008; Stauber and Muller, 2006; Stauber et al., 2006). Our previous study suggested that trabecular plates play an important role in determining the elastic moduli of human trabecular bone (Liu et al., 2006, 2008). However, as regards the role of rods vs. plates for failure behavior, trabecular rods may have their unique role in the initiation and progression of failure at sites of low bone density, such as vertebral body, which is more susceptible to large-deformation failure mechanisms (Bevill et al., 2006). It has also been qualitatively observed in computational simulations on a whole vertebral body that vertical trabeculae generally carry most of the load compared to the transverse ones (Bayraktar et al., 2004a; Homminga et al., 2004), and quantitatively confirmed by a recent study that the axially aligned trabeculae play an essential role in the axial elastic moduli (Liu et al., 2008). However, the roles of trabecular microstructure including trabecular types (plate vs. rod) and trabecular orientations in the damage initiation and accumulation within vertebral trabecular bone tissue are still unclear. Such knowledge of failure mechanisms at individual trabecula level can provide insight into the etiology of spontaneous vertebral fracture.
The high-resolution, voxel-based micro finite element (μFE) model is a commonly used technique and undoubtedly has a great potential for studying trabecular bone failure (Nagaraja et al., 2005; Niebur et al., 2000; van Rietbergen et al., 1995). It has been used to study failure properties of trabecular bone, and showed excellent agreement between experimental and the predicted apparent compressive and tensile strengths, and failure strains across the anatomic sites (Niebur et al., 1999, 2000, 2001). More recently, the effect of large deformation, which is significant to the strength prediction, especially within the low-density bone (Bevill et al., 2006; Morgan et al., 2004), was successfully implemented in nonlinear FE analysis of trabecular bone failure (Bevill et al., 2006). However, challenges still remain in quantifying the relative roles of trabeculae in different types and orientations in failure behavior of trabecular bone.
Recently, methods have been developed to decompose and classify trabecular bone microarchitecture as plate- and rod-like structures (Liu et al., 2006, 2008; Stauber and Muller, 2006; Stauber et al., 2006). Our previous study has reported that a novel 3D image analysis technique, individual trabeculae segmentation (ITS), is able to fully decompose trabecular bone microarchitecture into individual plates and rods (Liu et al., 2008). It has been successfully applied to high-resolution images of human trabecular bone samples obtained from various anatomic sites to study the contributions of morphological features of trabecular bone microarchitecture, such as plate/rod volume fraction, thickness, number density, orientation, and trabecular connections to the anisotropic elastic properties of trabecular bone (Liu et al., 2008). The newly developed ITS technique, in conjunction with materially and geometrically nonlinear micro computed tomography (μCT) based μFE analysis (Bevill et al., 2006), allows explicit examinations of the temporal and spatial development of failure of individual trabecular plates and rods. The overall goal of the current study was to evaluate the roles of (1) trabecular types (plates vs. rods) and (2) trabecular orientations (longitudinal vs. transverse/oblique) in the initiation and progression of failure in vertebral trabecular bone. This represents a first quantitative and computational study on the micromechanics of failure of individual trabecular plates vs. rods of human vertebral trabecular bone.
2. Materials and methods
2.1. Trabecular bone sample preparation and imaging
From the human lumbar vertebral bodies (L4: n = 14 and L5: n = 1; 75.4±14.4 year old, six males and nine females) 15 cylindrical (8 mm diameter, 20 mm length) axial trabecular bone samples (along superior–inferior direction) were obtained following the previously published protocol (Keaveny et al., 1994). The subjects were screened to exclude all possible metabolic bone diseases or bone cancer, and X-ray radiographs were taken to ensure that there was no evidence of damage or other bone pathologies. Three-dimensional high resolution images of central gage with a length of 20 mm were obtained for each specimen using μCT systems (μCT 20, SCANCO Medical AG, Bassersdorf, Switzerland) at 21 × 21 × 22 μm3 resolution. The central ~5 × 5 × 5 mm3 cubical sub-volume of each specimen was extracted from the reconstructed image and coarsened to 42 × 42 × 44 μm3 resolution. This voxel size can be considered an upper bound for use in both elastic and fully nonlinear μFE analysis (Bevill et al., 2006; Niebur et al., 1999). The grayscale images were thresholded such that the bone volume fraction (BV/TV) matched the experimentally measured values. The average BV/TV of the fifteen vertebral trabecular bone samples was 0.105±0.036.
2.2. Nonlinear finite element analysis
A FE model was constructed from each ~5 × 5 × 5 mm3 image by converting each voxel into an eight-node brick element (Hollister et al., 1994). Geometrically nonlinear FE analysis, using nonlinear material properties with tension–compression strength asymmetry of the hard tissue, were conducted on an IBM SP4 parallel supercomputer (IBM Corporation, Armonk, NY) to perform a compression from 0 to 1% apparent strain with ten even steps. Trabecular bone tissue was modeled as 15 GPa tissue modulus, 0.3 Poisson’s ratio, and a post-yield modulus equal to 5% of the initial modulus (Bayraktar et al., 2004b) by a finite deformation-based plasticity model (Gupta et al., 2007). The tissue-level yield strain was 0.33% in tension and 0.81% in compression (Bayraktar et al., 2004b). The uniaxial compression loading was imposed along the longitudinal direction (the principal direction of trabeculae). A custom parallel FE solver was used to solve these problems. Every voxel element which reached yielding was marked and its failure mode (tension or compression) was indicated at each loading step. The apparent yield point was determined from the apparent stress–strain curve of each specimen using the 0.2% offset method. Details of FE analysis were described elsewhere (Bevill et al., 2006). In order to provide more accurate estimates of in situ behavior of trabecular bone, the FE modeling results of 0.5-mm-thick outside layer of bone cube were excluded due to the influence of the side-artifact (Bevill et al., 2007; Un et al., 2006). The image of the interior 4 × 4 × 5 mm3 rectangular bone block of each specimen was used for further image analysis.
2.3. Individual trabeculae segmentation (ITS) of plates and rods
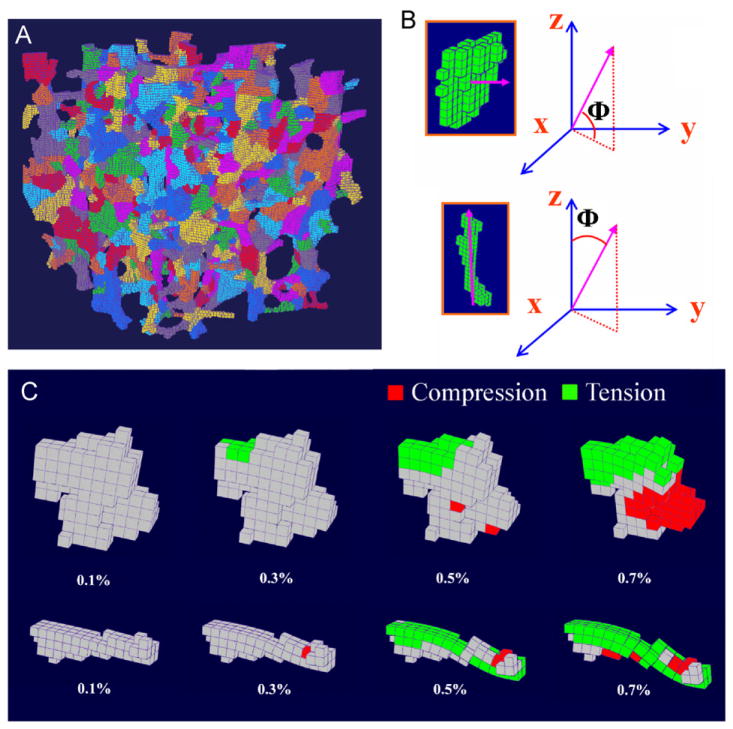
ITS technique was applied to segment the original trabecular bone image into individual trabecular plates and rods according to their microstructures (Fig. 1A). The description of detailed procedure of ITS and the illustration on high-resolution trabecular bone images can be found elsewhere (Liu et al., 2006, 2008). For a trabecular rod, an angle Φ was defined as the angle between the orientation of the rod and the z-axis of bone image (axial direction of vertebra). For a trabecular plate, the angle Φ was defined as the angle between the normal of the plate and the x–y axes plane (transverse plane) (Fig. 1B). Orientation of each trabecula was then determined according to its angle Φ (longitudinal (0 ≤ Φ ≤30°), oblique (30° < Φ ≤ 60°), or transverse (60° < Φ ≤ 90°)). BV/TV, plate bone volume fraction (pBV/TV), and rod bone volume fraction (rBV/TV) were also calculated for each trabecular bone image (Liu et al., 2008).
Fig. 1.
(A) Illustration of the individual trabeculae segmentation (ITS) on an image of vertebral trabecular bone sample (5 × 5 ×5 mm3); (B) definition of Φ for trabecular plates (top) and rods (bottom); (C) a longitudinal trabecular plate (top) and a transverse trabecular rod (bottom) under 0.1%, 0.3%, 0.5%, and 0.7% apparent strain. Red indicates local failure under compression and green indicates local failure under tension. The nodal displacement was amplified by a factor of 10.
2.4. Statistical analyses
We defined failure of a trabecula by yielding of any voxel within it. Therefore, the number of failed trabecular plates or rods was counted at each loading step, and then normalized by the total number of trabeculae within the sample to obtain the apparent failed plate or rod number fraction. In addition, the failed bone tissue volume within yielded trabecular plate or rod was also calculated. Then the volume of failed trabecular plates or rods was normalized by the total bone volume within the sample to calculate the apparent failed plate or rod tissue fraction. Furthermore, we defined the relative failed plate or rod number fraction as the failed plate or rod number divided by the total plate or rod number, respectively. The relative failed plates or rods tissue fraction was defined in a similar fashion. Subsequently, these data were stratified by the orientations. Paired Student t-tests were performed first to test the significant difference in structural types of trabecular bone (plate and rod) in terms of the apparent and relative failed number and tissue fraction at each step. Then the difference in orientations (transverse, oblique, and longitudinal) of the failed trabecular plate and rod in terms of the apparent and relative number and tissue fraction were tested at each loading step, respectively. The apparent failed plate tissue fraction and rod tissue fraction by different failure mode (tension and compression) were also quantified and the difference was examined at each loading step. In addition, linear correlations of the apparent yield strength (σy) with BV/TV or pBV/TV were studied. All the statistical analyses were performed by KaleidaGraph 3.6 software (Synergy Software, Reading, PA) on a PC workstation with p ≤ 0.05 considered as a statistical significance.
3. Results
The ITS technique successfully segmented the vertebral trabecular bone images into individual trabecular plates and rods (Fig. 1A). The failure of individual trabeculae can be qualitatively visualized by using nodal displacement data calculated via the nonlinear FE analysis (Fig. 1C). On an average, the apparent yield strain was 0.80±0.07%, and the apparent yield strength was 2.39±1.35 MPa.
On an average, the number of trabecular plates within a specimen was about 1.4 times greater than the number of trabecular rods, with a marginal statistical difference (p = 0.06). The total plate volume was 2.5 times the total volume of rods (p < 0.05) (Table 1). According to both trabecular number and trabecular bone volume, there were more plates than rods in the specimen while significantly more plates were in the longitudinal direction and significantly more rods in the transverse direction (Table 1).
Table 1.
Summary of trabecular number, bone volume fraction, and trabecular orientation for trabecular plate and rod (mean±SD).
| Trabecular plate | Trabecular rod | Total | |
|---|---|---|---|
| Trabecular number | 362±160 | 271±85 | 634±190 |
| BV/TV | 0.075±0.035* (pBV/TV) | 0.030±0.011* (rBV/TV) | 0.105±0.036 |
| Trabecular number fraction | |||
| Transverse | 0.04±0.02* | 0.26±0.07* | 0.30±0.06 |
| Oblique | 0.13±0.06 | 0.12±0.04 | 0.25±0.06 |
| Longitudinal | 0.39±0.10* | 0.06±0.03* | 0.45±0.06 |
| Trabecular tissue fraction | |||
| Transverse | 0.05±0.03* | 0.18±0.07* | 0.23±0.07 |
| Oblique | 0.13±0.07 | 0.09±0.04 | 0.21±0.07 |
| Longitudinal | 0.51±0.13* | 0.04±0.03* | 0.56±0.11 |
SD: standard deviation.
Significant difference between trabecular plate and rod (p < 0.05).
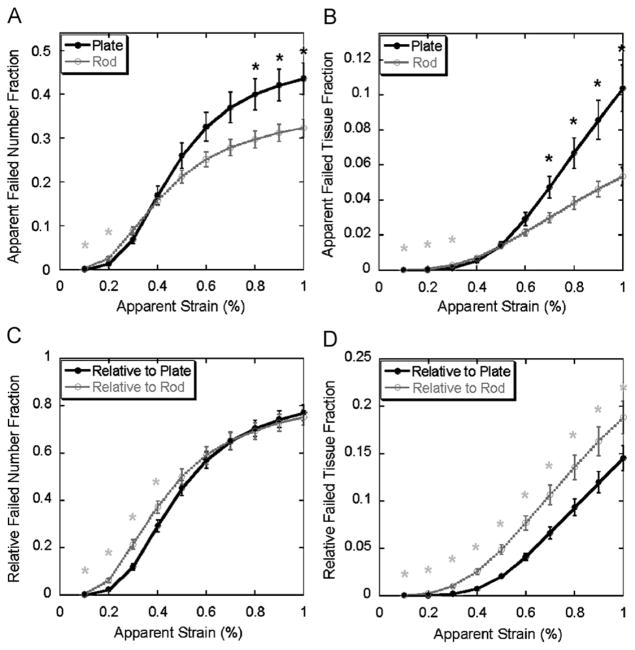
In terms of the apparent failed trabecular number fraction, significantly more trabecular rods failed at the initial stage of straining (0.1–0.2% apparent strain) and then more plates failed around apparent yield point (>0.7% apparent strain) (Fig. 2A). Consistently, more trabecular rod tissue was observed to fail at the initial stage while more trabecular plate tissue failed approaching apparent yield point (Fig. 2B). Furthermore, the relative failed plate and rod number fraction suggested that a higher proportion of trabecular rods failed at the early stage (0.1–0.3% apparent strain) and then plates and rods failed at equal percentage until 1% apparent strain is reached (Fig. 2C). The importance of trabecular rod was further highlighted in Fig. 2D, which shows that the percentage of failed tissue within trabecular rods was greater than the percentage within trabecular plates through the entire loading from 0.1% to 1% apparent strain.
Fig. 2.
Top: apparent failed number fraction (A) and tissue fraction (B) (Mean±SE) of trabecular plate and rod under 0.1–1% apparent strain. Bottom: relative failed number fraction (C) and tissue fraction (D) (mean±SE) of trabecular plate and rod under 0.1–1% apparent strain. Light grey star indicates significantly higher failed rod fraction than failed plate fraction (p <0.05); black star indicates significantly higher failed plate fraction than failed rod fraction (p <0.05). SE: standard error.
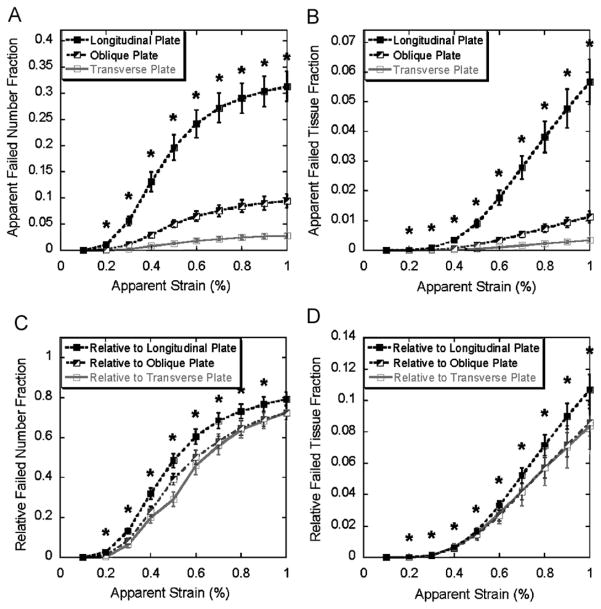
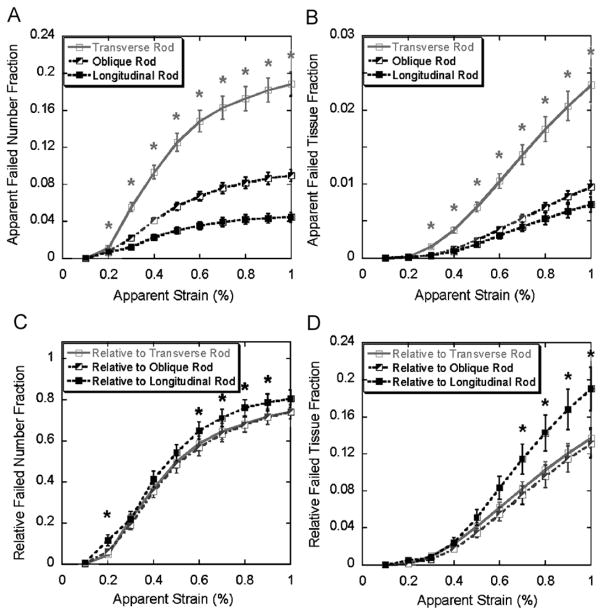
From 0.2% to 1% apparent strain, significantly more longitudinal trabecular plates failed than oblique or transverse plates in both apparent number fraction and tissue fraction (Fig. 3A and B). However, the difference between the relative failed number and tissue fractions of trabecular plates in different orientations was less significant, especially between the oblique and transverse plates, although the proportion of the failed longitudinal plates was still statistically greater than that of the oblique or transverse ones in terms of trabecular number (0.2–0.9% apparent strain, Fig. 3C) and tissue volume (0.2–1.0% apparent strain, Fig. 3D). Significant difference was shown between the apparent failed number and tissue fractions of rods at various orientations, nevertheless, in opposite trend comparing with trabecular plates (longitudinal<oblique<transverse) (Fig. 4A and B). The difference diminished in the relative number and tissue fractions of rods, but the relative proportion of failed longitudinal rods was actually greater than those of the oblique and transverse ones in terms of trabecular number (0.2, and 0.6–0.9% apparent strain, Fig. 4C) and tissue volume (0.7–1% apparent strain, Fig. 4D).
Fig. 3.
Top: apparent failed trabecular number fraction (A) and tissue fraction (B) of longitudinal, oblique, and transverse plates (mean±SE) under 0.1–1% apparent strain. Bottom: relative failed trabecular number fraction (C) and tissue fraction (D) of longitudinal, oblique, and transverse plates (mean±SE) under 0.1–1% apparent strain. * indicates significantly higher failed longitudinal plate fraction than failed oblique and transverse plate fractions (p < 0.05). SE: standard error.
Fig. 4.
Top: apparent failed trabecular number fraction (A) and tissue fraction (B) of transverse, oblique, and longitudinal rods (mean±SE) under 0.1–1% apparent strain. Bottom: relative failed trabecular number fraction (C) and tissue fraction (D) of transverse, oblique, and longitudinal rods (mean±SE) under 0.1–1% apparent strain. Light grey star indicates significantly higher failed transverse rod fraction than failed oblique and longitudinal rod fraction (p < 0.05); black star indicates significantly higher failed longitudinal rod fraction than failed oblique and transverse rod fraction (p < 0.05). SE: standard error.
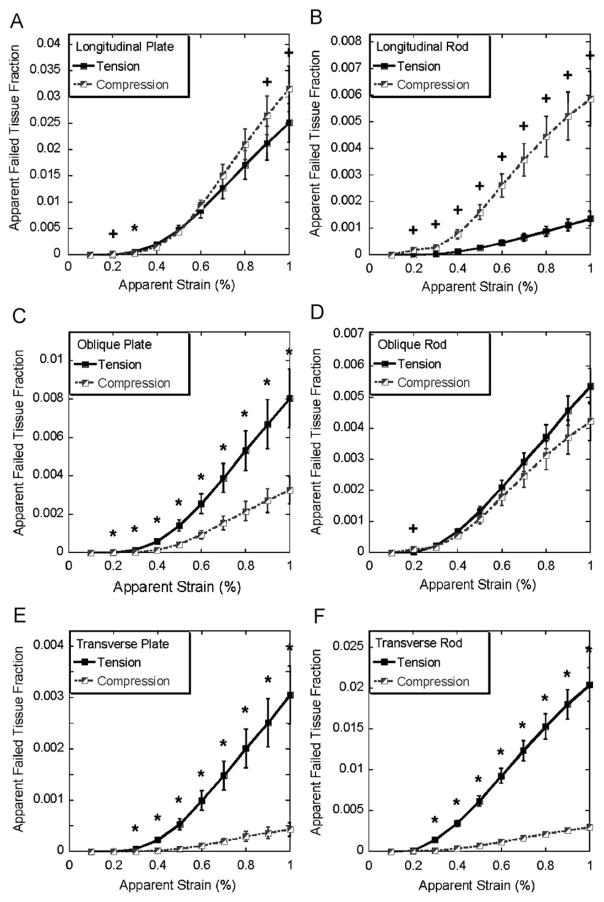
For longitudinal trabecular plates, compression became the dominant failure mode at the later stage (0.9–1% apparent strain, Fig. 5A) while for longitudinal trabecular rods the compression remained as the dominant failure mode throughout the entire loading (Fig. 5B). In most loading steps, failure of the oblique trabecular plates resulted more from tension than compression while tension and compression contributed equally to the failure of oblique trabecular rods (Fig. 5C and D). Furthermore, significantly more bone tissue fraction failed under tension than compression for both transverse trabecular plates and rods (Fig. 5E and F).
Fig. 5.
Apparent failed tissue fraction of longitudinal, oblique, and transverse trabecular plate and rod in tension and compression (mean±SE) under 0.1–1% apparent strain, SE: standard error. * indicates significantly higher tissue fraction failed in tension, + indicates significantly higher tissue fraction failed in compression (p < 0.05).
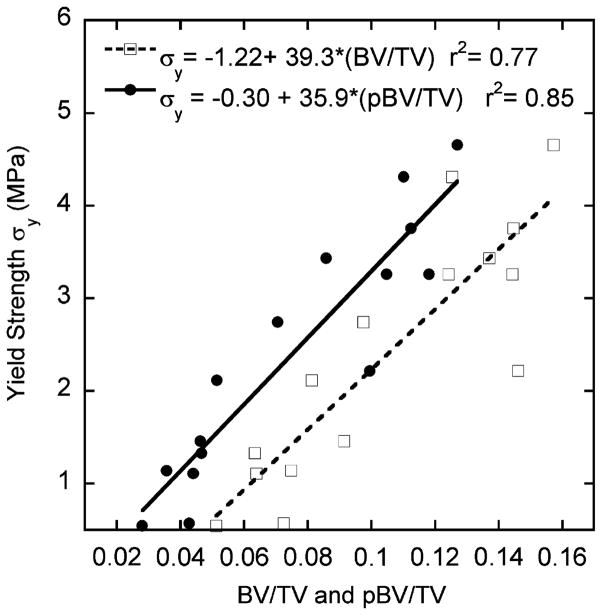
The correlations of apparent yield strength σy with both BV/TV (r2 = 0.77) and pBV/TV (r2 = 0.85) were statistically significant (Fig. 6). However, no correlation was found between rBV/TV and σy (r2 < 0.01, p = 0.94).
Fig. 6.
Results of correlation analysis of apparent yield strength (σy) with bone volume fraction (BV/TV), and with plate bone volume fraction (pBV/TV) by linear regression.
4. Discussion
In this study, a novel ITS technique was combined with nonlinear FE analysis to quantitatively study the failure behaviors of decomposed “individual” trabecular plates and rods. The relative contributions of trabecular plates and rods to the failure initiation and progression were quantitatively examined for the first time. In the simulated axial loading toward apparent yielding, the local failure in trabeculae can be observed starting from 0.1% apparent strain, although the apparent yielding is not evident until 0.7–0.8% apparent strain. Results suggested that trabecular bone failure initiated at rods at small strains (0.1–0.2% apparent strain, Fig. 2A and B); moreover, rods failed disproportionally to their number and volume at the beginning of failure (0.1–0.4% apparent strain, Fig. 2C and D).
While apparent strain approached global yield point (0.7–1% apparent strain), the dominance of failure shifted from rods to plates. In general, a significant amount of trabecular plate in terms of both number and tissue volume failed before the apparent yielding of whole specimen (0.80±0.07% apparent strain). Consistent with this finding, it is intriguing that there was a strong correlation between pBV/TV and apparent yield strength (Fig. 6); on the contrary, apparent yield strength was independent of rBV/TV (r2 < 0.01, p = 0.94, data not shown). Previous studies have quantitatively demonstrated that trabecular plates dominate the apparent elastic moduli of trabecular bone (Liu et al., 2006). The current study showed trabecular plates also play an essential role in the apparent yield strength due to their large number and tissue volume. It should be noted that the apparent failed number or tissue fraction is a concept quantitatively describing the amount of failed number and bone tissue volume in either plates or rods. Therefore, they quantify the relative roles of each trabecular type to failure process or yield strength of vertebral trabecular bone. On the other hand, the relative failed number or tissue fraction describes the distribution of failure in either plates or rods. Interestingly, in terms of relative failed number fraction, an equal proportion of plate and rod failed at 0.5–1% apparent strain, indicating homogeneous local failure among plates and rods. According to the relative failed bone volume, a higher proportion of rod tissue failed throughout the initiation and progression of failure. Combining the above findings, we conclude that the accumulation of failure within the failed rods was much severe than plates toward the apparent yield point.
During the loading of 0.2–1% apparent strain, failure of longitudinal trabecular plates and transverse trabecular rods was dominant compared to failure of trabeculae in other orientations (Figs. 3 and 4). Therefore, longitudinal plates and transverse rods may play key roles in determining the yield strength of trabecular bone. Moreover, failure mode predicted by the FE analysis revealed that the mechanisms of failure depended on the structural types and orientations of the individual trabeculae. The results from these analyses suggest that longitudinal trabecular plates stand most axial loading while transverse trabecular rods serve as essential links to stabilize the whole structure in vertebral body under compressive loading. It confirms our earlier hypothesis but now with more detailed and quantitative models.
Strikingly, the differences among the curves of relative failed plate number and tissue fraction in three directions were minimal (Fig. 4C and D). Similar phenomena can also be observed in trabecular rods that the differences of the relative number and tissue fraction of failed rods in different orientations were far less distinctive than the apparent number or tissue fraction (Fig. 5C and D). Once again, it demonstrates that the microstructure of trabecular bone network, such as trabecular type and orientation, effectively adapts to its biomechanical functions. It should also be noted that the relative failed number and tissue fractions of longitudinal plates and rods are statistically higher than those of oblique and transverse plates and rods. This could result from the imposed loading direction, which was well aligned with longitudinal trabeculae.
It should be noted that several limitations are associated with this study. First, the prediction of yielding of bone voxel and individual trabecula has not been experimentally validated. However, predictions of these models in apparent elastic modulus, apparent yield strength, and yield strain have been validated experimentally in previous studies (Bevill et al., 2006; Niebur et al., 1999, 2000, 2001). In addition, the mechanisms of local failure predicted by FE models have been qualitatively observed in the microcompression test combined with high-resolution imaging (Muller et al., 1998; Nagaraja et al., 2005; Nazarian and Muller, 2004; Thurner et al., 2006). Potentially microcompression could be used to quantitatively determine the 3D strain field based on stepwise high-resolution image and eventually verify the FE predictions at the individual trabecula level. Second, the results and conclusions of this study were based on models of on-axis loading. However, the results may not be the same if the loading is along transverse axis. It will be of our future interest to explore the influence of different loading orientations. Third, homogeneous tissue material properties were assumed for all the specimens in the simulation. The variations in mineralization may affect the results of failure analysis. This should be explored more carefully in the future studies as well. The micromechanical analyses of individual trabeculae highly depended on the results of segmentation and classification of individual trabecular plates and rods. The ITS technique, which decomposes trabecular microstructure according to its topology and geometry, was the only method adopted in this study. One should be aware that there are other techniques for decomposing trabecular microstructure (Stauber and Muller, 2006; Stauber et al., 2006) and it will be of interest to compare the influence of different methods in the future. To evaluate the importance of trabecular types in the initiation of local failure, the different responses of trabecular plates and rods were recorded stepwise. However, limited by the high computational cost of large-scale models, the computations were performed at an increment of 0.1% apparent strain. Among 15 vertebral bone images, 9 specimens showed the initial local failure in both plates and rods occurring at the same loading step. Thus, it would be difficult to confirm if first local failure always occurred in trabecular rod. Nevertheless, results of FE analyses from all the other 6 specimens showed that the first local failure occurred at trabecular rods. Moreover, at the initiation of the local failure (0.1–0.3% apparent strain), the apparent number and tissue fraction of failed trabecular rods exceeded those of the failed trabecular plate (Fig. 2A and B), supporting our hypothesis that local failure of vertebral trabecular bone initiates primarily at trabecular rods.
While the importance of plate-like trabeculae has been fully recognized and the structure model index, a parameter describing the plate-likeness of trabecular architecture (Hildebrand and Ruegsegger, 1997), has been widely used as an indicator of bone quality, the results from this study suggest that attention should also be given to the quality of trabecular rod, as it may determine the initiation of the local failure at small strain. Furthermore, for the first time, the importance of longitudinal plates and transverse rods during the yielding of trabecular bone under axial compression was quantitatively confirmed. Thus, the new morphological parameters stratified by trabecular types and orientations may help us better assess the quality of vertebral trabecular bone and predict vertebral bone fragility.
Acknowledgments
This work was partially supported by grants from the US National Institute of Health (AR051376 and AR043784), and a grant from the National Natural Science Foundation of China (10628205).
Footnotes
Conflict of interest
Drs. Guo, Sajda, and Liu are inventors of a software derived from this work. All other authors have no relevant conflicts of interest.
Contributor Information
X. Sherry Liu, Email: xl2014@columbia.edu.
Grant Bevill, Email: gbevill@me.berkeley.edu.
Tony M. Keaveny, Email: tmk@me.berkeley.edu.
Paul Sajda, Email: ps629@columbia.edu.
References
- Bayraktar HH, Adams MF, Hoffmann PF, Lee DC, Gupta A, Papadopoulos P, Keaveny TM. Micromechanics of the human vertebral body. Transactions of the 51st Annual Meeting of Orthopaedic Research Society; Washington, DC, USA. 2004a. p. 1129. [Google Scholar]
- Bayraktar HH, Morgan EF, Niebur GL, Morris GE, Wong EK, Keaveny TM. Comparison of the elastic and yield properties of human femoral trabecular and cortical bone tissue. Journal of Biomechanics. 2004b;37:27–35. doi: 10.1016/s0021-9290(03)00257-4. [DOI] [PubMed] [Google Scholar]
- Bevill G, Eswaran SK, Gupta A, Papadopoulos P, Keaveny TM. Influence of bone volume fraction and architecture on computed large-deformation failure mechanisms in human trabecular bone. Bone. 2006;39:1218–1225. doi: 10.1016/j.bone.2006.06.016. [DOI] [PubMed] [Google Scholar]
- Bevill G, Easley SK, Keaveny TM. Side-artifact errors in yield strength and elastic modulus for human trabecular bone and their dependence on bone volume fraction and anatomic site. Journal of Biomechanics. 2007;40:3381–3388. doi: 10.1016/j.jbiomech.2007.05.008. [DOI] [PMC free article] [PubMed] [Google Scholar]
- Eswaran SK, Gupta A, Adams MF, Keaveny TM. Cortical and trabecular load sharing in the human vertebral body. Journal of Bone and Mineral Research. 2006;21:307–314. doi: 10.1359/jbmr.2006.21.2.307. [DOI] [PubMed] [Google Scholar]
- Eswaran SK, Gupta A, Keaveny TM. Locations of bone tissue at high risk of initial failure during compressive loading of the human vertebral body. Bone. 2007;41:733–739. doi: 10.1016/j.bone.2007.05.017. [DOI] [PMC free article] [PubMed] [Google Scholar]
- Gupta A, Bayraktar HH, Fox JC, Keaveny TM. Constitutive modeling and algorithmic implementation of a plasticity-like model for trabecular bone structures. Computational Mechanics. 2007;40:61–72. [Google Scholar]
- Hildebrand T, Ruegsegger P. Quantification of bone microarchitecture with the structure model index. Computer Methods in Biomechanics and Biomedical Engineering. 1997;1:15–23. doi: 10.1080/01495739708936692. [DOI] [PubMed] [Google Scholar]
- Hollister SJ, Brennan JM, Kikuchi N. A homogenization sampling procedure for calculating trabecular bone effective stiffness and tissue level stress. Journal of Biomechanics. 1994;27:433–444. doi: 10.1016/0021-9290(94)90019-1. [DOI] [PubMed] [Google Scholar]
- Homminga J, van Rietbergen B, Lochmuller EM, Weinans H, Eckstein F, Huiskes R. The osteoporotic vertebral structure is well adapted to the loads of daily life, but not to infrequent “error” loads. Bone. 2004;34:510–516. doi: 10.1016/j.bone.2003.12.001. [DOI] [PubMed] [Google Scholar]
- Keaveny TM, Guo XE, Wachtel EF, McMahon TA, Hayes WC. Trabecular bone exhibits fully linear elastic behavior and yields at low strains. Journal of Biomechanics. 1994;27:1127–1136. doi: 10.1016/0021-9290(94)90053-1. [DOI] [PubMed] [Google Scholar]
- Liu XS, Sajda P, Saha PK, Wehrli FW, Guo XE. Quantification of the roles of trabecular microarchitecture and trabecular type in determining the elastic modulus of human trabecular bone. Journal of Bone and Mineral Research. 2006;21:1608–1617. doi: 10.1359/jbmr.060716. [DOI] [PMC free article] [PubMed] [Google Scholar]
- Liu XS, Sajda P, Saha PK, Wehrli FW, Bevill G, Keaveny TM, Guo XE. Complete volumetric decomposition of individual trabecular plates and rods and its morphological correlations with anisotropic elastic moduli in human trabecular bone. Journal of Bone and Mineral Research. 2008;23:223–235. doi: 10.1359/JBMR.071009. [DOI] [PMC free article] [PubMed] [Google Scholar]
- Morgan EF, Bayraktar HH, Yeh OC, Majumdar S, Burghardt A, Keaveny TM. Contribution of inter-site variations in architecture to trabecular bone apparent yield strains. Journal of Biomechanics. 2004;37:1413–1420. doi: 10.1016/j.jbiomech.2003.12.037. [DOI] [PubMed] [Google Scholar]
- Muller R, Gerber SC, Hayes WC. Micro-compression: a novel technique for the nondestructive assessment of local bone failure. Technology and Health Care. 1998;6:433–444. [PubMed] [Google Scholar]
- Nagaraja S, Couse TL, Guldberg RE. Trabecular bone microdamage and microstructural stresses under uniaxial compression. Journal of Biomechanics. 2005;38:707–716. doi: 10.1016/j.jbiomech.2004.05.013. [DOI] [PubMed] [Google Scholar]
- Nazarian A, Muller R. Time-lapsed microstructural imaging of bone failure behavior. Journal of Biomechanics. 2004;37:55–65. doi: 10.1016/s0021-9290(03)00254-9. [DOI] [PubMed] [Google Scholar]
- Niebur GL, Yuen JC, Hsia AC, Keaveny TM. Convergence behavior of high-resolution finite element models of trabecular bone. Journal of Biomechanical Engineering. 1999;121:629–635. doi: 10.1115/1.2800865. [DOI] [PubMed] [Google Scholar]
- Niebur GL, Feldstein MJ, Yuen JC, Chen TJ, Keaveny TM. High-resolution finite element models with tissue strength asymmetry accurately predict failure of trabecular bone. Journal of Biomechanics. 2000;33:1575–1583. doi: 10.1016/s0021-9290(00)00149-4. [DOI] [PubMed] [Google Scholar]
- Niebur GL, Yuen JC, Burghardt AJ, Keaveny TM. Sensitivity of damage predictions to tissue level yield properties and apparent loading conditions. Journal of Biomechanics. 2001;34:699–706. doi: 10.1016/s0021-9290(01)00003-3. [DOI] [PubMed] [Google Scholar]
- Silva MJ, Keaveny TM, Hayes WC. Load sharing between the shell and centrum in the lumbar vertebral body. Spine. 1997;22:140–150. doi: 10.1097/00007632-199701150-00004. [DOI] [PubMed] [Google Scholar]
- Stauber M, Muller R. Volumetric spatial decomposition of trabecular bone into rods and plates—a new method for local bone morphometry. Bone. 2006;38:475–484. doi: 10.1016/j.bone.2005.09.019. [DOI] [PubMed] [Google Scholar]
- Stauber M, Rapillard L, van Lenthe GH, Zysset P, Muller R. Importance of individual rods and plates in the assessment of bone quality and their contribution to bone stiffness. Journal of Bone and Mineral Research. 2006;21:586–595. doi: 10.1359/jbmr.060102. [DOI] [PubMed] [Google Scholar]
- Thurner PJ, Wyss P, Voide R, Stauber M, Stampanoni M, Sennhauser U, Muller R. Time-lapsed investigation of three-dimensional failure and damage accumulation in trabecular bone using synchrotron light. Bone. 2006;39:289–299. doi: 10.1016/j.bone.2006.01.147. [DOI] [PubMed] [Google Scholar]
- Un K, Bevill G, Keaveny TM. The effects of side-artifacts on the elastic modulus of trabecular bone. Journal of Biomechanics. 2006;39:1955–1963. doi: 10.1016/j.jbiomech.2006.05.012. [DOI] [PubMed] [Google Scholar]
- van Rietbergen B, Weinans H, Huiskes R, Odgaard A. A new method to determine trabecular bone elastic properties and loading using micromechanical finite-element models. Journal of Biomechanics. 1995;28:69–81. doi: 10.1016/0021-9290(95)80008-5. [DOI] [PubMed] [Google Scholar]


