Abstract.
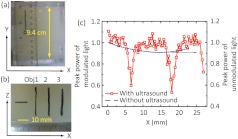
Ultrasound-modulated optical tomography (UOT) has the potential to reveal optical contrast deep inside soft biological tissues at an ultrasonically determined spatial resolution. The optical imaging depth reported so far has, however, been limited, which prevents this technique from broader applications. Our latest experimental exploration has pushed UOT to an unprecedented imaging depth. We developed and optimized a UOT system employing a photorefractive crystal-based interferometer. A large aperture optical fiber bundle was used to enhance the efficiencies for diffuse light collection and photorefractive two-wave-mixing. Within the safety limits for both laser illumination and ultrasound modulation, the system has attained the ability to image through a tissue-mimicking phantom of 9.4 cm in thickness, which has never been reached previously by UOT.
Keywords: optical imaging, ultrasound-modulated optical tomography, acousto-optic imaging, ultrasound modulation, fiber bundle, light guide, photorefractive crystal, two-wave-mixing, tissue-mimicking phantom
1. Introduction
Ultrasound-modulated optical tomography (UOT), also referred to as acousto-optic imaging (AOI), has been proposed in an effort to improve the spatial resolution of optical imaging through thick turbid media, such as biological tissue.1–3 In this technique, ultrasound waves are applied to phase-modulate the propagation of diffused light by periodically displacing the scattering sites and varying the local refractive index.4,5 Both the modulated photon flux and the ultrasound modulation efficiency are sensitive to local optical properties,6–8 i.e., an increase in optical absorption and/or optical scattering in the ultrasonic modulation volume reduces the UOT signal. Therefore, UOT allows one to image the optical contrast several centimeters deep with a spatial resolution defined by the ultrasonic modulation volume, which is typically governed by the ultrasound beam.
Most of the UOT experimental studies to date, however, were performed in tissue-mimicking phantoms or ex vivo tissue possessing thicknesses less than the clinically useful depth (usually 5 to 10 cm).9 Such depth insufficiency arises from the nature of how ultrasonically modulated light is generated, detected, and demodulated into a signal (e.g., intensity information) that is measurable with an optical detector. Inside a turbid medium,10 photons are multiply scattered and only those traversing the ultrasound focal region could be effectively modulated. Therefore, for a given light exposure level permitted by the American National Standards Institute (ANSI),11 the flux of the modulated photons is extremely low; it is buried in a much stronger background of unmodulated photons. As a result of strong diffusion, only a small portion of these tagged photons is collected outside of the sample. In addition, the low efficiency and the slow response of the phase demodulation/detection scheme further decrease the signal-to-noise ratio (SNR).
To enhance the signal detection sensitivity, various detection schemes have been developed, such as parallel detection based on a CCD camera,12,13 interferometry without14 or with photorefractive crystals (PRC),6,7,15,16 and Fabry-Perot interferometry8,17 or spectral hole burning-based spectral filtering detection.18 These detection schemes have been employed for conventional optical contrast imaging, multi-wavelength imaging,19 mechanical contrast imaging,20,21 quantitative measurement of optical properties,15,22 real-time monitoring of thermal necrosis,23 as well as assisting optical near-infrared spectroscopy24 and diffuse optical tomography.25 However, it remains an open question as to which detection technique is best suited for in vivo biomedical studies in terms of the SNR and the response time of the detection scheme—e.g., the time for the PRC to build up a saturated space charge field following the formation of an index grating by the signal beam and the reference beam. Unfortunately, most of these investigations were carried out in relatively thin tissue or tissue-like samples. In the only published work that surpassed a sample thickness of 5 cm, a pulsed laser with high peak power (), but low averaged power was used to generate more tagged photons17,26 during the ultrasonic modulation period. By doing so, ex vivo tissue (chicken breast) as thick as 6 cm could be imaged in UOT. This method, however, is limited by the accessibility of the pulsed laser source, which is not commercially available and may be challenging to assemble.
In this article, we propose to use a large aperture, high numerical aperture (NA) optical fiber bundle (OFB) to collect and relay as much diffused light as possible onto a PRC-based demodulation scheme. The etendue (defined as the product of the surface area and the acceptance solid angle) of the fiber bundle is fully accommodated by that of the PRC. By simultaneously optimizing other experimental aspects, such as the photorefractive two-wave-mixing and the ultrasound modulation efficiencies, we experimentally achieved an unprecedented imaging thickness up to 9.4 cm through tissue-mimicking phantoms (, ) with acceptable SNR.
2. Materials and Methods
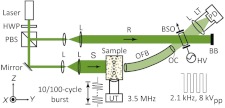
Figure 1 shows a diagram of the experimental setup. A continuous-wave laser operating at 532 nm (Verdi V-10, Coherent) served as the coherent light source. The linear polarization of the laser beam was converted into circular polarization by the half-wave plate. A polarizing beam splitter split the beam into the signal and reference beams. The signal beam (S), after expansion to a diameter of 35 mm, illuminated the front surface of a tissue-mimicking gel phantom with an optical intensity of , which was in the vicinity of the laser safety limit at 532 nm optical wavelength.11 The phantom was made by adding 10% (by weight) porcine gelatin (Sigma-Aldrich), and 1% Intralipid (Fresenius Kabi) into de-ionized water, heating and then solidifying the mixture. At the chosen Intralipid concentration, the phantom has a reduced scattering coefficient of ,27 close to that of regular human breast tissue in the near-infrared spectral region.28 A focused ultrasonic wave propagated along the axis in the phantom. The diffuse light traversing the ultrasonic beam was modulated by the applied ultrasound wave. The transmitted light, comprising both modulated and un-modulated components, was collected and transported with an OFB (NT38-659, Edmund Optics) mounted closely to the phantom surface. This 305-mm long OFB has an active aperture of 12.7 mm, an NA of 0.55, and a full acceptance angle of 68-deg. At the output end of the OFB, the diverging beam was reshaped by two lenses (optical condenser (OC) in Fig. 1) such that the tip of the OFB was imaged onto the entrance aperture of a (BSO) crystal (, Elan, Russia). The plane-wave reference beam evenly illuminated the crystal entrance aperture with an intensity of , and intersected the signal beam at an angle around 13.6-deg. The interference induced a two-wave-mixing process in the PRC, resulting in an intensity-enhanced signal.6,15,23 The enhanced signal was relayed and finally detected with a photodiode (PD, PDA36A, Thorlabs). The response time of the PRC was under the experimental conditions to be described below. A lens tube was used between the lens and the photodiode to block the ambient light.
Fig. 1.
Schematic of the experimental setup. The component labels are defined as follows: HWP, half-wave plate; PBS, polarizing beam splitter; L, lens; S, signal beam; R, reference beam; UT, ultrasound transducer; OFB, optical fiber bundle; OC, optical condenser; BSO, photorefractive crystal; HV, high voltage electric field; BB, beam block; LT, lens tube; PD, photodiode detector; , system coordinates.
A function generator (33250A, Agilent) produced a sine-burst waveform with a 3.5-MHz central frequency at 100 Hz repetition rate, while its pulse duration was determined by the specific imaging requirements. This waveform was amplified by a power amplifier and sent to drive a single element focused ultrasound transducer (UT, Panametrics A381S, Olympus) which was used as the ultrasound source in the system. The acoustic beam profile from this transducer had been calibrated beforehand, possessing a focal length of 38.1 mm and a focal region (6 dB full width half maximum, FWHM) of 15.8 mm long and 0.875 mm wide. Throughout the study, focal pressures of 2.60 MPa (peak-to-peak) were employed.
The Agilent function generator was also synchronized with the generation of a 2.1 kHz, 8 V (peak-to-peak) square wave from another function generator (DS345, Stanford Research). This AC field was voltage-amplified by 60 dB (609E-6, Trek) and applied across the PRC, with which we measured the highest two-wave-mixing gain through thick diffused media (all else being identical).29
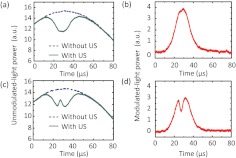
The unmodulated-light power transmitted through a 6-cm thick phantom (, ) was detected at the photodiode without and with the modulation of 10-cycle ( in length) ultrasound pulses. An optically absorbing inclusion (, ) was embedded at the center of this sample. Figure 2(a) shows a typical signal when the ultrasound pulses propagated through the phantom outside the inclusion. As shown, without ultrasound modulation, the detected light intensity followed a temporal profile (2.1 kHz, although not shown completely in the plot) from the high voltage AC electric field applied across the crystal. However, when the ultrasound burst was launched at the time , the unmodulated-light power was reduced whenever/wherever the light and the ultrasound interacted. When the time was around 25 to 30 μs, corresponding to the focal position of the ultrasound field, the interaction/modulation was highest because both in situ light and sound were strongest. Thus, one gets minimum unmodulated-light power at the detector, forming the valley of the “V-shaped” signal, in response to an optically homogeneous region. The difference between the two signals gives the ultrasonically modulated-light power, i.e., the UOT signal, shown in Fig. 2(b). In comparison, Fig. 2(c) shows the unmodulated-light power obtained when the sample was moved to a position such that the ultrasound pulses traversed the absorption inclusion. The blip around 25 to 30 μs suggests a reduction in local modulation strength and photon flux due to the increased optical absorbance within the inclusion, and is used as the signature of the optical inhomogeneity. The corresponding modulated-light power is shown in Fig. 2(d).
Fig. 2.
Examples of detected unmodulated-light power transmitted through a 6 cm-thick phantom with the embedded absorption object (a) outside and (c) inside the ultrasound beam, in the form of 10-cycle bursts. The difference between signals obtained without and with ultrasound modulation gives the ultrasonically modulated-light power shown in (b) and (d), respectively.
The UOT scan lines shown above and throughout this study were averaged over 64 time-domain sweeps at a repetition rate of 100 Hz to improve the SNR. To image through thicker turbid media, we enlarged the ultrasonic modulation zone along the axis by using longer ultrasound bursts, which enhances the signal strength.20 However, when the number of ultrasound cycles () was greater than 100, as shown in Fig. 3(a), the modulated-light power from the same phantom as in Fig. 2(a) reached a slightly enhanced highest level during the ultrasound burst duration, and reached a second peak around 1 ms after the onset of the ultrasound burst due to the additional acoustic radiation force and shear wave effects20,21 even though the transducer had been turned off. Within 5 to 6 ms, the second peak faded away as the shear waves propagated out of the ultrasound focus. This effect has been demonstrated20,21 to be useful for sensing mechanical contrasts in additional to optical changes in turbid media. However, since the present work only focused on optical contrast detection and the shear wave propagation that was perpendicular to the ultrasound axis led to a compromised lateral spatial resolution, was preferred. Figure 3(b) shows how the peak power of the modulated light increases with increasing ultrasound burst length. As approached 100 ( temporally and spatially), the peak power of the modulated light plateaued as the ultrasound burst filled up the entire probing region, whose spatial extent can be inferred from Fig. 2. Therefore, 100-cycle ultrasound bursts were used for thicker turbid media at the expense of axial resolution.
Fig. 3.
(a) Modulated-light powers corresponding to ultrasound bursts with 200, 600, and 1000 cycles, respectively. (b) Peak power of modulated light as a function of ultrasound burst length varied from 10 to 1000 cycles.
3. Experimental Results
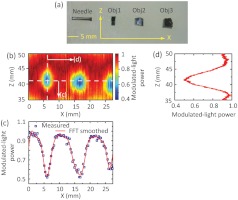
To demonstrate UOT through thick turbid media, two phantoms were prepared with thicknesses of 6 and 9.4 cm, respectively. Figure 4(a) shows the cross-section of the 6 cm thick phantom, where a needle and three absorption objects (, , and along , , and , respectively) were embedded 3 cm deep. The objects were made of the same material as the background except that Indian ink was added to have a higher absorption coefficient (). The ultrasound field was positioned beforehand such that its focus centrally aligned to the needle in both and directions by using a pulse receiver (5072PR, Olympus). During the experiment, both light and ultrasound elements remained stationary, but the phantom was scanned along the direction with a step size of 0.3175 mm. At each position, 10-cycle ultrasound bursts were applied for modulation, and one UOT scan line (“A line”) was obtained as discussed in Fig. 2. The resulting 2-D “B-mode” image in the plane is given in Fig. 4(b), where the distance along the direction was derived from multiplying the sound speed in the phantom () and the temporal position. Note that the displayed scan lines were each normalized to its peak power. As we can see, the three objects were clearly identified despite that Obj3 was not fully scanned due to the limited range of the translation stage. A profile across these objects along the horizontal dashed line in Fig. 4(b) can identify the position and the dimension of Obj1 and Obj2 as shown in Fig. 4(c), where the blue squares are measured data and the red curve is the FFT smoothed result: Obj1 was centered around , and wide, as measured by the FWHM; Obj2 was centered around , and wide. Therefore, the two object centers are separated by 10.9 mm. These measurements are in agreement with the actual features of the objects as shown in Fig. 4(a): Obj1 and Obj2 are and wide, respectively; and they are separated by along the direction. Approximated from the span between ¼ and ¾ of the contrasts in Fig. 4(c), the imaging resolution was along the direction, which was slightly wider than the ultrasound focal width (0.875 mm). An A-line across Obj1, as shown in Fig. 4(d) [corresponding to the vertical dashed line in Fig. 4(b)], indicates a dimension of for Obj1, which is also consistent with the actual object dimension of .
Fig. 4.
(a) Photograph of the cross-section of the 6 cm-thick phantom at the central plane () showing three embedded absorption objects. The needle is used as an ultrasonic fiducial marker for the alignment of the and positions between the embedded objects and the ultrasound focus. (b) UOT image at the central plane. The color bar corresponds to the modulated-light power normalized to the peak of each A-line. (c) Modulated-light power distribution along the horizontal dashed line in (b). The blue squares are the measured data, and the red curve the FFT smoothed results. (d) Modulated-light power distribution along the vertical dashed line in (b).
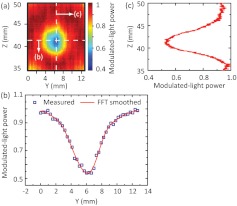
Another group of measurements was performed within the same sample. This time the sample was fixed at the position of as in Fig. 4(b), and the ultrasound field was scanned along the direction. Similar to Fig. 4(b), a “B-mode” image corresponding to Obj1 in the plane was obtained and displayed in Fig. 5(a). Figure 5(b) shows the profile along the horizontal dashed line in (a), from which we can tell that Obj1 is around 3.80 mm wide, and the imaging resolution is along the direction. Figure 5(c) shows an A-line across Obj1 [corresponding to the vertical dashed line in Fig. 5(a)], suggesting an object dimension of along the axis. These measurements are consistent with the actual object dimension and the findings from Fig. 4(d).
Fig. 5.
(a) UOT image at the central plane for Obj1 [ plane in Fig. 4(b)], where the positive axis is the signal beam incident direction. Modulated-light power distributions along the horizontal and vertical dashed lines in (a) are given in (b) and (c), respectively.
To image through a phantom with a thickness of 9.4 cm, the burst length was increased from 10 to 100 cycles while the other parameters of the ultrasound field were kept the same. As shown in Fig. 6(a) and 6(b), three absorbing objects and a needle were embedded at a depth of 4.7 cm within the 9.4-cm phantom. Since the employment of longer ultrasound bursts compromises the imaging resolution and contrast along the acoustic axis, these three objects were intentionally made sufficiently long with respect to the ultrasound focal dimension along the direction. By doing so, we expected a larger contrast between the modulated-light peak powers obtained with ultrasound traversing and away from the absorbers. Following similar protocols as for Fig. 4(b), the phantom was scanned along the direction, and one scan line was obtained at each position. However, because of the lack of resolution along the acoustic axis ( axis), no “B-mode” image was pursued here. Instead, the peak power of the modulated light from each scan line was extracted, normalized to the mean of values far away from the objects, and shown as a function of the phantom’s position in Fig. 6(c). The peak power of the unmodulated light as a function of the phantom’s position (blue dashed curve), in the absence of ultrasound, is included for comparison. As we can see, the unmodulated light cannot resolve the absorbers, confirming light is highly diffused at such a depth. The ultrasound-modulated light, conversely, is able to distinguish, locate and measure the width of each object accurately: Obj1 was centered around , and wide; Obj2 was centered around , and wide; Obj3 was not completely scanned owing to the limited range of the scanning translation stage. Therefore, the separation between the first two object centers is 11.4 mm. The UOT image is consistent with the photograph in Fig. 6(b), where Obj1 and 2 are respectively and wide, and separated by along the direction. The imaging resolution is estimated to be along the direction, which is consistent with the previous result [Fig. 4(c)] and reasonably close to the ultrasound field focal width.
Fig. 6.
(a) Photograph of the 9.4 cm-thick phantom in the plane. (b) Photograph of the cross-section of the phantom at the central plane (). (c) Peak power of the modulated-light along the direction. Measured peak power of the unmodulated-light distribution without ultrasound modulation is also included (blue dashed curve) for comparison.
4. Summary and Discussion
In summary, we investigated UOT at new depths in turbid media. A large aperture fiber bundle was mounted very close to the turbid media so that we could efficiently collect diffused light. Unmodulated light was filtered through a photorefractive crystal (PRC)-based system operating at 532 nm optical wavelength. The etendue of the whole system was currently limited by that of the PRC. The output from the fiber bundle was reshaped such that it interfered with the reference beam at an angle around 13.6-deg, resulting in a high two-wave-mixing efficiency (gain coefficient ). These two factors—the large collection etendue and two-wave-mixing efficiency—in combination enable us to extract the modulated-light response originating from the ultrasound focus that was positioned deep inside the turbid media. In comparison, using regular lenses to relay light onto the PRC, in practice, often results in a tradeoff in efficiency between diffused light collection and two-wave-mixing process (angle dependent). Because the reference beam had the same frequency as the unmodulated signal beam, the PRC beam coupling was sensitive to the changes in the flux of unmodulated portion from the collected diffused signal beam. Therefore, the modulated-light response was obtained indirectly through the difference between the detected unmodulated-light without and with ultrasound modulation. Experimental results demonstrated the feasibility of UOT to image optical inhomogeneities through tissue-mimicking phantoms with thickness up to 9.4 cm, which corresponds to transport mean free paths. To the best of our knowledge, in the UOT field, this is an unprecedented imaging depth. In theory, another modulation detection scheme based on spectral hole burning can have an even larger etendue than the PRC-based setup,18,30 and has the potential too for deep imaging.
It also must be noted at this point that the background material of phantoms used in this study was composed of water, 10% gelatin, and 1% Intralipids (by weight). At 532 nm optical wavelength, the mixture of water and gelatin provides an absorption coefficient of measured by a spectrophotometer (Cary 50, Varian). The 1% intralipids, estimated from 10% intralipid solution,27 contributes an absorption coefficient of , and a reduced scattering coefficient of . Therefore, the phantoms had an effective attenuation coefficient [] of at this wavelength. However, for biological tissue such as regular human breast tissue, at 532 nm is (Table 1), suggesting a lesser imaging depth attainable than in phantom. Nevertheless, at wavelengths of 700, 800, and 1064 nm, this type of phantom mimics breast tissue quite well in terms of , the parameter that governs the fluence decay of diffused light in turbid media. Therefore, operating at a near-infrared wavelength, e.g., 1064 nm would assure a feasible maximum imaging depth approaching 10 cm in real tissue, just as in the phantom under similar conditions. Transition to 1064 nm optical wavelength also allows us to further increase, if needed for deeper imaging and/or better SNR, the signal beam incident intensity without violating the safety limit () at 1064 nm.11 Moreover, photorefractive crystals operating at this wavelength, for example GaAs31 and ,16 can have a response time less than 1 ms under a illumination, potentially accommodating the speckle decorrelation induced by physiological motion in vivo. Therefore, to further enhance the system toward in vivo applications such as the diagnosis of early stage breast cancer, it will be upgraded to 1064 nm in the near future.
Table 1.
Optical properties of regular human breast tissue ( are calculated based on the and data extracted from Ref. 28), Fig. 5, Subject #3).
| Wavelength (nm) | |||
|---|---|---|---|
| 532 | 0.950 | 21 | 7.91 |
| 700 | 0.052 | 15 | 1.53 |
| 800 | 0.062 | 12 | 1.49 |
| 1064 | 0.103 | 8 | 1.58 |
Acknowledgments
The authors thank Sandra Matteucci for editing the manuscript. This research is sponsored in part by National Academies Keck Futures Initiative grant IS 13 and National Institute of Health grants R01 EB000712 and U54 CA136398. L.W. has a financial interest in Microphotoacoustics, Inc. and Endra, Inc., which, however, did not support this work.
References
- 1.Dolfi D., Micheron F., “Imaging process and system for transillumination with photon frequency marking,” International Patent WO No. 89/00278 (1989).
- 2.Marks F. A., Tomlinson H. W., Brooksby G. W., “A comprehensive approach to breast cancer detection using light: photon localization by ultrasound modulation and tissue characterization by spectral discrimination,” Proc. SPIE 1888, 500–510 (1993). 10.1117/12.154670 [DOI] [Google Scholar]
- 3.Wang L. V., Jacques S. L., Zhao X., “Continuous-wave ultrasonic modulation of scattered laser light to image objects in turbid media,” Opt. Lett. 20(6), 629–631 (1995). 10.1364/OL.20.000629 [DOI] [PubMed] [Google Scholar]
- 4.Leutz W., Maret G., “Ultrasonic modulation of multiply scattered light,” Phys. B. 204(1), 14–19 (1995). 10.1016/0921-4526(94)00238-Q [DOI] [Google Scholar]
- 5.Wang L. V., “Mechanisms of ultrasound modulation of multiply scattered coherent light: an analytic model,” Phys. Rev. Lett. 87(4), 043903 (2001). 10.1103/PhysRevLett.87.043903 [DOI] [PubMed] [Google Scholar]
- 6.Murray T. W., et al. , “Detection of ultrasound-modulated photons in diffuse media using the photorefractive effect,” Opt. Lett. 29(21), 2509–2511 (2004). 10.1364/OL.29.002509 [DOI] [PubMed] [Google Scholar]
- 7.Ramaz F., et al. , “Photorefractive detection of tagged photons in ultrasound modulated optical tomography of thick biological tissues,” Opt. Express 12(22), 5469–5474 (2004). 10.1364/OPEX.12.005469 [DOI] [PubMed] [Google Scholar]
- 8.Sakadzic S., Wang L. V., “High resolution ultrasound-modulated optical tomography in biological tissues,” Opt. Lett. 29(23), 2770–2772 (2004). 10.1364/OL.29.002770 [DOI] [PubMed] [Google Scholar]
- 9.Wang L. V., “Ultrasonic modulation of scattered in turbid media and a potential novel tomography in biomedicine,” Photochem. Photobiol. 67(1), 41–49 (1998). 10.1111/php.1998.67.issue-1 [DOI] [PubMed] [Google Scholar]
- 10.Wang L. V., Wu H., Biomedical Optics: Principles and Imaging, John Wiley and Sons, Hoboken, NJ: (2007). [Google Scholar]
- 11.“American National Standard for the Safe Use of Laser in Health Care Facilities, ANSI Z1361.1,” American National Standards Institute, New York: (2000). [Google Scholar]
- 12.Leveqe-Fort S., et al. , “Ultrasonic tagging of photon paths in scattering media: parallel speckle modulation processing,” Opt. Lett. 24(3), 181–183 (1999). 10.1364/OL.24.000181 [DOI] [PubMed] [Google Scholar]
- 13.Yao G., Wang L. V., “Theoretical and experimental studies of ultrasound-modulated optical tomography in biological tissue,” Appl. Opt. 39(4), 659–664 (2000). 10.1364/AO.39.000659 [DOI] [PubMed] [Google Scholar]
- 14.Le Clerc F., Collot L., Gross M., “Numerical heterodyne holography with two-dimensional photodetector arrays,” Opt. Lett. 25(10), 716–718 (2000). 10.1364/OL.25.000716 [DOI] [PubMed] [Google Scholar]
- 15.Lai P., Roy R. A., Murray T. W., “Quantitative characterization of turbid medium using pressure contrast acousto-optic imaging,” Opt. Lett. 34(18), 2850–2852 (2009). 10.1364/OL.34.002850 [DOI] [PubMed] [Google Scholar]
- 16.Farahi S., et al. , “Photorefractive acousto-optic imaging in thick scattering media at 790 nm with a crystal,” Opt. Lett. 35(11), 1798–1800 (2010). 10.1364/OL.35.001798 [DOI] [PubMed] [Google Scholar]
- 17.Rousseau G., Blouin A., Monchalin J.-P., “Ultrasound-modulated optical imaging using a high-power pulsed laser and a double-pass confocal Fabry-Perot interferometer,” Opt. Lett. 34(21), 3445–3447 (2009). 10.1364/OL.34.003445 [DOI] [PubMed] [Google Scholar]
- 18.Li Y., et al. , “Detection of ultrasound-modulated diffuse photons using spectral hole burning,” Opt. Express 16(19), 14862–14874 (2008). 10.1364/OE.16.014862 [DOI] [PMC free article] [PubMed] [Google Scholar]
- 19.Kim C., Wang L. V., “Multi-optical-wavelength ultrasound-modulated optical tomography: a phantom study,” Opt. Lett. 32(16), 2285–2287 (2007). 10.1364/OL.32.002285 [DOI] [PubMed] [Google Scholar]
- 20.Xu X., et al. , “Photorefractive detection of tissue optical and mechanical properties by ultrasound modulated optical tomography,” Opt. Lett. 32(6), 656–658 (2007). 10.1364/OL.32.000656 [DOI] [PubMed] [Google Scholar]
- 21.Li R., et al. , “Effects of acoustic radiation force and shear waves for absorption and stiffness sensing in ultrasound modulated optical tomography,” Opt. Express 19(8), 7299–7311 (2011). 10.1364/OE.19.007299 [DOI] [PubMed] [Google Scholar]
- 22.Bratchenia A., Molenaar R., Kooyman R. P. H., “Feasibility of quantitative determination of local optical absorbances in tissue-mimicking phantoms using acousto-optic sensing,” Appl. Phys. Lett. 92(11), 113901 (2008). 10.1063/1.2898884 [DOI] [Google Scholar]
- 23.Lai P., et al. , “Real time monitoring of high-intensity focused ultrasound lesion formation using acousto-optic sensing,” Ultrasound Med. Biol. 37(2), 239–252 (2011). 10.1016/j.ultrasmedbio.2010.11.004 [DOI] [PubMed] [Google Scholar]
- 24.Gunadi S., Leung T. S., “Spatial sensitivity of acousto-optic and optical near-infrared spectroscopy sensing measurements,” J. Biomed. Opt. 16(12), 127005 (2011). 10.1117/1.3660315 [DOI] [PubMed] [Google Scholar]
- 25.Bratchenia A., et al. , “Acousto-optic-assisted diffuse optical tomography,” Opt. Lett. 36(9), 1539–1541 (2011). 10.1364/OL.36.001539 [DOI] [PubMed] [Google Scholar]
- 26.Rousseau G., Blouin A., Monchalin J.-P., “Ultrasound-modulated optical imaging using a powerful long pulse laser,” Opt. Express 16(17), 12577–12590 (2008). 10.1364/OE.16.012577 [DOI] [PubMed] [Google Scholar]
- 27.Flock S. T., et al. , “Optical properties of intralipid: a phantom medium for light propagation studies,” Laser Surg. Med. 12(5), 510–519 (1992). 10.1002/(ISSN)1096-9101 [DOI] [PubMed] [Google Scholar]
- 28.Pifferi A., et al. , “Spectroscopy time-resolved diffuse reflectance and transmittance measurements of the female breast at different interfiber distances,” J. Biomed. Opt. 9(6), 1143–1151 (2004). 10.1117/1.1802171 [DOI] [PubMed] [Google Scholar]
- 29.Stepanov S. I., “Applications of photorefractive crystals,” Rep. Prog. Phys. 57(1), 39–116 (1994). 10.1088/0034-4885/57/1/002 [DOI] [Google Scholar]
- 30.Li Y., et al. , “Pulsed ultrasound-modulated optical tomography using spectral-hole burning as a narrowband spectral filter,” Appl. Phys. Lett. 93(1), 011111 (2008). 10.1063/1.2952489 [DOI] [PMC free article] [PubMed] [Google Scholar]
- 31.Gross M., et al. , “Detection of the tagged or untagged photons in acousto-optic imaging of thick scattering media by photorefractive adaptive holography,” Eur. Phys. J. E 28(2), 173–182 (2009). 10.1140/epje/i2008-10408-2 [DOI] [PubMed] [Google Scholar]


