Abstract
Chemical shift anisotropy (CSA) tensors are essential in the structural and dynamic studies of proteins using NMR spectroscopy. Results from relaxation studies in biomolecular solution and solid-state NMR experiments on aligned samples are routinely interpreted using well-characterized CSA tensors determined from model compounds. Since CSA tensors, particularly the 15N CSA, highly depend on a number of parameters including secondary structure, electrostatic interaction and the amino acid sequence, there is a need for accurately determined CSA tensors from proteins. In this study we report the backbone amide-15N CSA tensors for a 16.7-kDa membrane-bound and paramagnetic-heme containing protein, rabbit cytochrome b5 (cytb5), determined using the 15N CSA/15N-1H dipolar transverse cross-correlation rates. The mean values of 15N CSA determined for residues in helical, sheet and turn regions are −187.9, −166.0, and −161.1 ppm, respectively, with an overall average value of −171.7 ppm. While the average CSA value determined from this study is in good agreement with previous solution NMR experiments on small globular proteins, the CSA value determined for residues in helical conformation is slightly larger which may be attributed to the paramagnetic effect from Fe(III) of the heme unit in cytb5. However, like in previous solution NMR studies, the CSA values reported in this study are larger than the values measured from solid-state NMR experiments. We believe that the CSA parameters reported in this study will be useful in determining the structure, dynamics and orientation of proteins, including membrane proteins, using NMR spectroscopy.
Keywords: Chemical Shift Anisotropy (CSA) tensors, membrane protein cytochrome b5 (cytb5), CSA/dipolar transverse cross-correlation rates
Introduction
Solving high-resolution structures and characterization of dynamics of biomolecules has become one of the most important goals of modern structural biology. Both solution and solid-state NMR spectroscopic techniques are increasingly used to study the structure and dynamics of proteins. In these NMR studies, chemical shift anisotropy (CSA) tensors play a vital role in providing valuable information about the local structure and motions surrounding a nucleus. In solids molecular motions are restricted, as a result anisotropic interactions such as CSA, dipolar interactions are present in totality. CSA tensors from solids can be determined using various methods: static powder patterns,1–4 2D separated-local-field (SLF) experiments5,6, magic angle spinning (MAS) spectra7–12, recoupling techniques13,14 and single-crystal studies.15–17 In addition, quantum chemical calculations have also contributed significantly towards computing and understanding the variation of CSA tensors.18–25 Solid-state NMR spectroscopy is also commonly used for CSA measurements from samples that are site specifically labeled with an isotope (such as 15N or 13C). However, this technique is less practical for large proteins that are isotopically labeled at multiple sites due to difficulties associated with severe spectral overlap. On the other hand, this problem can be overcome by studying these proteins in solution. The rapid tumbling of the molecules in solution results in a faster change of molecular orientations than the magnitude of anisotropic interactions leading to well-resolved narrow lines at the isotropic chemical shift values. Hence information about individual components of the CSA tensor cannot be determined from the peak positions. However, recent studies have shown that the CSA tensor elements for globular proteins in solution can be determined in solution from nuclear spin relaxation measurements where chemical shift anisotropy contributes to relaxation through a cross-correlation relaxation mechanism with a dipolar coupling tensor.26–33
There is a growing interest in determining amide-15N CSA tensors associated with the backbone of a protein. Well-characterized amide-15N CSA tensors are essential to determine the structure and local dynamics, and to distinguish the residues undergoing conformational exchange. Structural dependence of 1H and 13C chemical shifts are well studied by experimental as well as computational approaches both in solids and solutions.10,14,34–40 15N CSA, on the other hand, is relatively less known as it is influenced by many factors such as torsion angles, hydrogen bonding interactions (both intra and inter residue), intra-residue angles, the chemical nature of a side chain, electrostatic interactions and solvent interactions.23,41–47 Many attempts have also been made towards theoretical determination of 15N-CSA using quantum chemical methods by several groups in the recent past.19,43,48–55 Experimentally, the most widely used method to obtain 15N-CSA values from proteins in solution is by measuring the cross-correlation rate arising due to the interference between 15N CSA and 15N-1H dipolar coupling tensors that lead to differential line broadening of the 15N in doublet components in 1H-coupled 15N-1H HSQC (Hetero nuclear Single Quantum Coherence) spectra.28–31,56–59 Long range cross-correlation rate measurements have also been reported for 13CO CSA and weak long-range dipolar interaction between same carbonyl and neighboring amide proton.26,33,60 A recent study makes use of different motional models to describe local motions for the determination of CSA tensor components in human ubiquitin and shows that the measured CSA values are weakly dependent on the choice of model used for the study.26 Hall and Fushman obtained similar results for backbone amide-15N CSA values in protein G by applying a combination of relaxation and CSA/dipolar cross-correlation measurements at five different magnetic fields using various model independent approaches.61 Damberg et al. have shown limited variations in the magnitude and orientation of site-specific backbone amide-15N CSA in ubiquitin measured at four different magnetic field strengths.62 In another study, site-specific backbone amide-15N CSA tensors for the well-ordered B3 domain of globular binding protein were determined from residual chemical shift anisotropy (RCSA) measurements.63 In the present study, we measure the backbone amide-15N CSA in combination with transverse CSA/dipolar cross-correlation rates for a membrane protein cytochrome b5 (cytb5) using a 1H coupled 15N-1H HSQC type spectra by comparing the observed difference in line widths of the 15N doublet components using a model independent method developed by Fushman et al.29 Cytb5 is a 16.7-kDa (134 amino acid residues) electron transfer protein present in eukaryotic organisms. It contains a structured water-soluble domain with a paramagnetic heme unit, a transmembrane helical domain, and an unstructured about 14-residue long linker region which connects the transmembrane and soluble domains of cytb5.64–66 Since this membrane-bound protein is rich in different secondary structural elements and domains exhibiting a range of dynamics and a paramagnetic center, it makes an excellent model system to study the variations in the amide-15N CSA tensors with structure and dynamics. Our results indeed provide an explanation for the variation of experimentally measured amide-15N CSA tensors that will be useful in the structural studies of water-soluble as well as membrane-associated proteins.
Experimental Section
A membrane bound cytb5 was expressed in E. coli and purified as explained elsewhere.67 The 1H-15N HSQC type proton coupled IPAP (In Phase Anti Phase) experiments56 for transverse cross-correlation rate measurements were performed on a 900 MHz Bruker Avance NMR spectrometer using a cryo probe. A 5 mm Shigemi tube containing 0.5 mL of a 0.3 mM uniformly labeled 13C, 2H, 15N cytb5 sample incorporated in 45 mM perdeuterated dodecylphosphocholine (DPC) in 100 mM potassium phosphate (KPi) buffer at pH 7.4, containing 5% glycerol and 35% D2O at 25°C was used in all NMR experiments. The relaxation delay (Δ) values were set to 10.64, 15.96, 21.28, 26.60 and 31.92 ms and the IPAP spectra were collected in an interleaved manner as pseudo-3D experiments where the first 2D-plane corresponds to in-phase (IP) and second plane to anti-phase (AP) spectra. The same number of scans was used for the in-phase and anti-phase experiments for a given delay, while it was varied from 24 for the smallest to 96 for the largest delay to compensate for the loss of signal due to a large delay Δ in the IPAP pulse sequence. Experimental data processing and the subsequent addition/subtraction of in-phase and anti-phase spectra were performed using NMRpipe68 while resonance peak assignments for cytb5 were done using Sparky.69
Results and Discussion
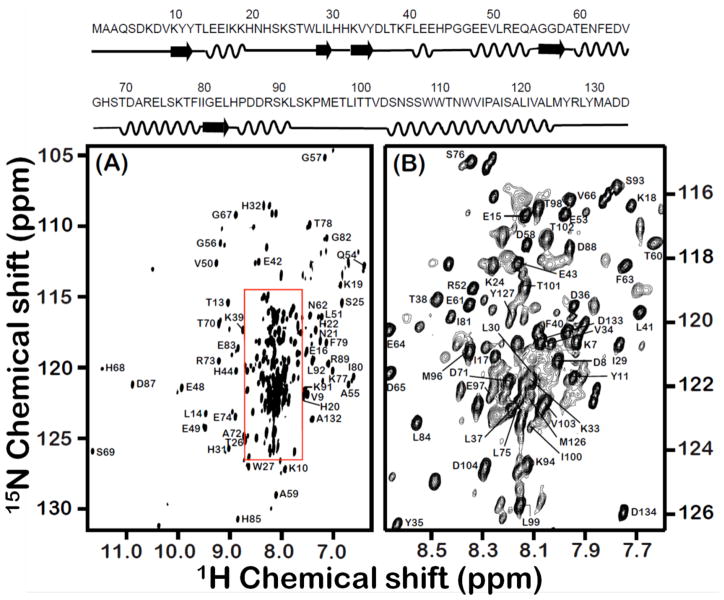
The amino acid sequence of a 16.7-kDa rabbit cytb5 and a 2D 1H-15N TROSY-HSQC70 spectrum of U-13C, 15N, 2H labeled full-length cytb5 incorporated in perdeuterated DPC detergent micelles at 25°C are given in Figure 1. The amide NH resonances from the soluble domain (6 to 91 residues) and the linker region (92 to 104 residues) are well resolved as seen in Figure 1. Resonances from the N-terminal (1–5) and transmembrane region of the protein (105 to 125 residues) were not observed due to their fast spin-spin relaxation that leads to broadening of spectral lines. The structure and orientation of the transmembrane domain was characterized using the 2D HIMSELF (heteronuclear isotropic mixing leading to spin exchange via the local field) sequence71 based on the PIWIMz (polarization inversion by windowless isotropic mixing) pulse scheme72 solid-state NMR experiment, on a full-length cytb5 incorporated in aligned DMPC/DHPC bicelles. Details on the resonance assignment and the 3D structure of cytb5 will be reported elsewhere. In this study, we report experimentally measured backbone amide-15N CSA tensors of 84 residues from cytb5 incorporated in DPC micelles. The backbone amide-15N CSA tensors for remaining residues could not be measured due to overlapping resonances.
Figure 1. Backbone amide resonance assignment for the 16.7-kDa rabbit cytb5 incorporated in DPC micelles.
A full 2D 1H-15N TROSY-HSQC spectrum of U-13C, 15N, 2H labeled full-length cytb5 in DPC micelles along with resonance assignments is shown in panel A while panel B represents expanded region of the box shown in panel A. The amino acid sequence with its secondary structure is shown at the top.
Backbone amide-15N CSA/dipolar transverse cross-correlation rate measurement
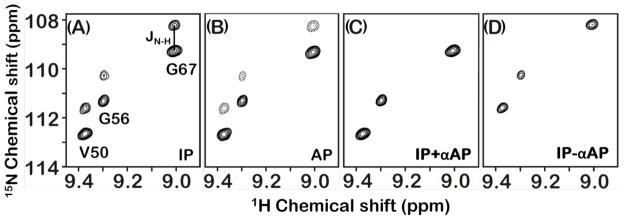
To determine backbone amide-15N CSA, we measured 15N CSA/dipolar transverse cross-correlation rates for various residues of cytb5 by following the method as described by Hall and Fushman.56 The transverse cross-correlation rates were measured by implementing the IPAP method73 wherein two spectra that are representatives of the inphase (IP) and the antiphase (AP) 15N doublet components were recorded as part of a single experiment. The transverse cross-correlation rate measurement depends on the ratio of the signal intensities of the difference (up-field) and the sum (down-field) spectra, which decays mono exponentially with increase in relaxation delays. A small region of the 1H coupled 15N-1H HSQC (IPAP) spectrum with resolved inphase and antiphase 15N spin doublet components are shown in Figure 2A and 2B, respectively. The up-field (Iup,2IySz+Iy) and the down-field (Idn,2IySz−Iy) components of the inphase and antiphase doublets were subsequently added and subtracted leading to simplified sum (IP+αAP) and difference (IP−αAP) spectra (Figure 2C and 2D, respectively). A scaling factor α = 1.2 was applied to the AP spectrum before its addition or subtraction to the IP spectrum to compensate for the signal losses and to obtain a complete removal of unwanted signals.
Figure 2. Representative regions of 1H coupled 2D 15N-1H HSQC spectra.
The plot is extracted from a small region of the 2D 15N-1H HSQC spectrum of a uniformly-15N, 13C and 2H-labeled cytb5 incorporated in DPC micelles. The spectra were recorded using a relaxation delay of 10.64 ms from a 900 MHz NMR spectrometer. Protons were not decoupled during the t1 period of the pulse sequence and therefore the transverse magnetization of 15N nuclei was allowed to evolve under 15N chemical shift and 15N-1H scalar couplings. Panels A, B, C and D represent the inphase (IP) 15N-1H doublets, the antiphase (AP) 15N-1H doublets, the simplified sum (IP+αAP) and the difference (IP−αAP) spectra, respectively.
The intensity of peaks from the sum (IP+αAP) and the difference (IP−αAP) HSQC spectra was measured using Sparky. The ratio of intensities of the up-field and the down-field peaks for various residues of cytb5 was then calculated and plotted against the delay time used in the experiment; representative plots for residues G67, G56 and V50 of cytb5 are shown in Figure 3. The 15N transverse cross-correlation rates (ηxy) were measured by fitting the mono-exponential decay curves obtained from the ratio of the up-field and the down-field peak intensities using Iup,2IySz+Iy/Idn,2IySz−Iy = Ce−ηxyΔ; where C is the ratio of signal decays (or t1-dependent functions) associated with the up-field and the down-field intensities, Δ is the relaxation delay which was taken as multiples of 1/(2JN-H), and JN-H represents the one bond scalar 15N-1H coupling.
Figure 3. Determination of transverse cross-correlation rates, ηxy.
The plots represent mono-) exponential decay curves for the measurement of transverse cross-correlation rates (ηxy) from the ratio of the up-field and the down-field peak intensities (Iup/Idn) for residues G67, G56 and V50 against the delay time (Δ). The corresponding values of ηxy for these residues are 12.43±0.50 s−1, 13.29±1.10 s−1 and 16.05±1.12 s−1, respectively.
The backbone amide-15N transverse cross-correlation rates (ηxy) determined from the best-fitting mono-exponential decay curves for various residues of cytb5 are given in Table S1 (see the Supporting Information) and are plotted in Figure 4. As expected and also evident from Figure 4, the values of backbone amide-15N transverse cross-correlation rates fall rapidly for residues in the N-terminus (residues 7–9), the C-terminus (residues 132–134) and the linker-region (residues 92–104) of cytb5 which suggests a highly dynamic and flexible nature of the protein in these regions as compared to the structured regions.
Figure 4. Backbone amide-15N transverse cross-correlation rates, ηxy, for residues in a membrane-bound cytb5.
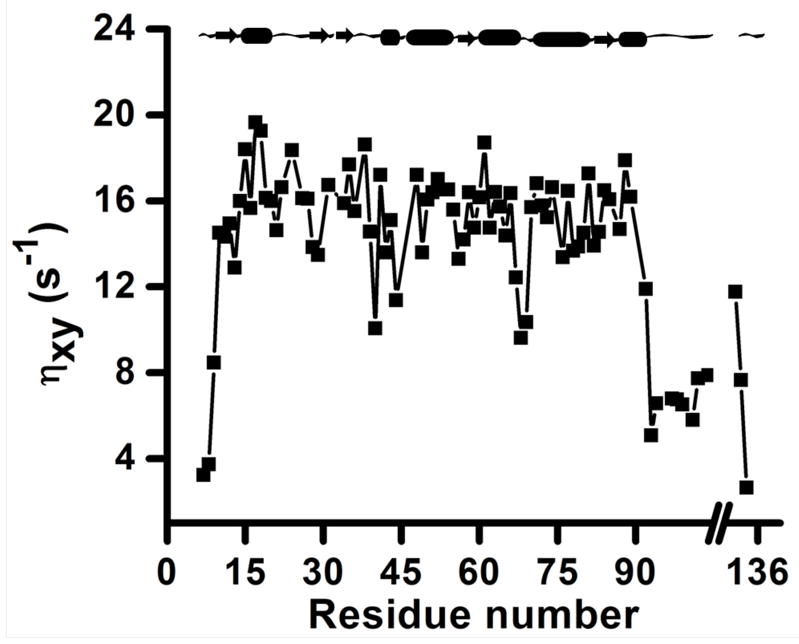
Backbone amide-15N transverse cross-correlation rates as obtained from mono-exponential decay curves are plotted against amino acid residue number of cytb5. A break on the horizontal axis represents the transmembrane region of the protein that could not be observed in solution state NMR due to its fast spin-spin relaxation.
Distribution of backbone amide-15N transverse cross-correlation rates in different regions of cytb5
The backbone amide-15N transverse cross-correlation rates (ηxy) are receptive to internal and overall motions of the protein30,74 therefore structured elements such as alpha-helices, beta-sheets and turns may undergo differential dynamics in their three-dimensional arrangement. Figure 5 shows a distribution of cross-correlation rates across alpha-helices, beta-sheets, turns and the loop-regions that include termini along with the linker-region across the amino acid sequence. It is evident from Figure 5 that there is hardly any difference between the mean values of backbone amide-15N transverse cross-correlation rates for residues in alpha-helix (16.08 s−1), beta-sheet (15.05 s−1) and turn (14.54 s−1) regions. On the other hand, the mean value of the cross-correlation rate for residues in the termini and linker region is 6.83 s−1. It should also be noted that the span of 15N transverse cross-correlation rate values for alpha-helix and beta-sheet residues is smaller than that for the turn and loop-region residues. This narrow distribution of cross-correlation rate suggests a uniform characteristic of the 15N transverse cross-correlated relaxation rates in amide backbone of alpha-helices and beta-sheets wherein the residues are experiencing direct and indirect H-bonding interactions. The large fluctuations of transverse cross-correlation rates in turns and loop-regions are attributed to their more flexible nature especially in the N-terminus, C-terminus and the linker region as compared to the residues in alpha-helices and beta-sheets. However, the variation of cross-correlation rates in the individual turns in the structured regions of the cytb5’s soluble domain is slightly less pronounced indicating less flexibility as compared to the residues in the termini and the linker-region of the protein.
Figure 5. Distribution of backbone amide-15N transverse cross-correlation rates in different regions of a membrane-bound cytb5.
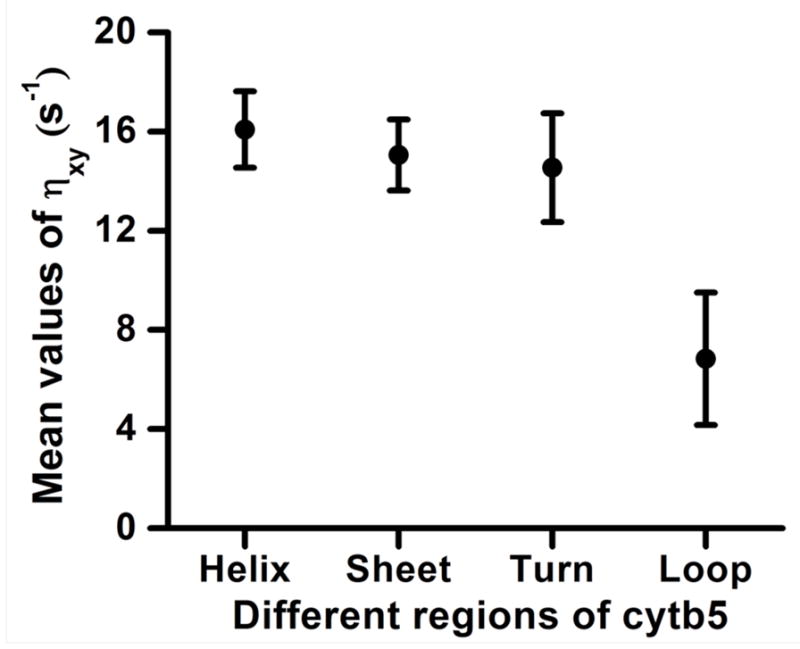
The mean values of transverse cross-correlation rates are plotted against different regions of a membrane-bound protein cytb5. Error bars correspond to the standard deviation. The mean values of transverse cross-correlation rates for helix, sheet, turn and loop-region (termini along with linker region) are 16.08, 15.05, 14.54 and 6.83 s−1 with standard deviations of 1.54, 1.43, 2.19 and 2.67 s−1, respectively.
Determination of backbone amide-15N CSA using transverse cross correlation rates
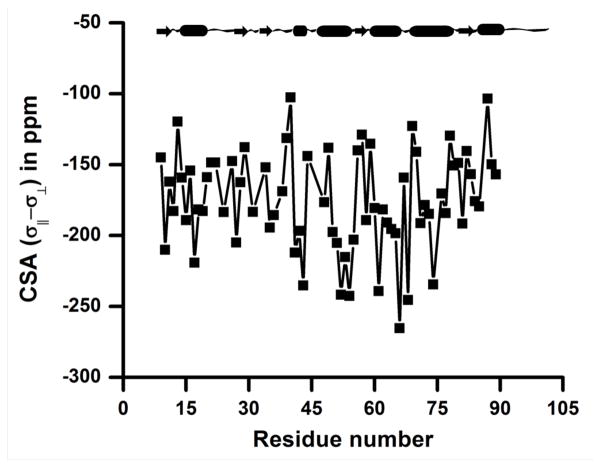
The measured backbone amide-15N transverse cross-correlation rates (ηxy) were used to determine the span of 15N CSA (σ|| − σ⊥) values for membrane-bound cytb5. Based on an approach described by Fushman et al., ηxy/R2 = 2dc(P2(cosβ))/d2 + c2) was used in our calculation by assuming axially symmetric CSA tensors;28,29,56 where is the dipolar coupling constant, rN-H is the 15N-1H bond length, γi is the gyromagnetic ratio of a nucleus i, μo is the permeability constant, and ħ is the Plank’s constant (h) divided by 2π. The parameter c = −ωN(σ|| − σ⊥)/3 is the CSA constant; where ωN is the 15N Larmor frequency. P2(cosβ) is the Legendre polynomial with β representing the angle between the N-H dipolar vector and the least shielded component of the 15N CSA tensor described in principal axis system and R2 represents the average transverse relaxation rate. The corresponding backbone amide-15N CSA (σ|| − σ⊥) tensors for cytb5 are plotted as a function of the residue number in Figure 6 and are also listed in Table S2 (see the Supporting Information). The calculation of 15N CSA (σ|| − σ⊥) tensors for backbone amide residues of cytb5 was performed by assuming effective internuclear distance rN-H =1.023 Å and an angle β = 18°. The 15N CSAs (refer to Table S2 in the supporting information) are smaller for residues in the termini and the linker regions as compared to that of the residues in the structured regions of the protein. However, it is important to note that the experimentally determined CSA values for these residues could be inaccurate as they undergo a fast motion in the NMR time scale (ps-ns rotational correlation time) as determined from heteronuclear nuclear Overhauser enhancement along with T1 and T2-measurements; the experimentally measured R2 values are reported in Table S3 of the Supporting Information. Due to such fast motion, CSA tensors can be time-dependent for these residues and therefore the solution NMR method used in this study may not be accurate.30,45 As a consequence, we have not included these residues in our further analysis of data; in fact, Figure 6 does not include the CSA values for residues in the N- and C-termini and the linker region.
Figure 6. Variation of the backbone amide-15N CSA along the polypeptide chain of the membrane-bound cytb5.
The backbone amide-15N CSA for amino acid residues of cytb5 is plotted against the residue number. The 15N CSA (σ;|| − σ⊥) were determined by taking an effective internuclear distance between amide nitrogen and proton (rN-H) as 1.023 Å and a constant value for the angle (β = 18°) between N-H bond vector and the CSA tensor described in the principal axis system. CSA values for residues in the N- and C-termini and in the linker region are not included as these residues undergo a fast (ns-ps time scale) motion and the solution NMR approach used in this study may not be suitable for accurately determining their CSA values.
Dependence of 15N CSA values on the angle (β)
Previous solid-state NMR and quantum chemical calculation studies on peptides have reported that the angle (β)2,48,75 in principle could vary from ~12 to ~25°. However, for most of the residues this value was found to lie between 17.5°–22.5°. In our study, for β =20°, the mean value of 15N CSA span (σ|| − σ⊥) was calculated to be −184.4 ppm, not including the outliers in the termini and the linker regions. This value is slightly more than the commonly used value of −170.0 ppm in the 15N-relaxation studies.
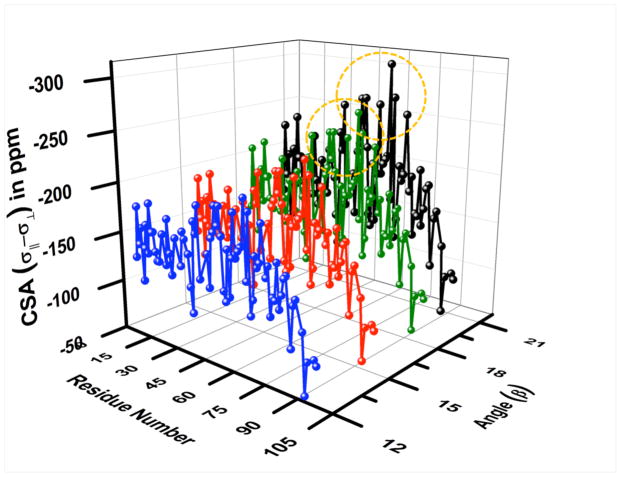
To understand the observed higher average value of 15N CSA for β = 20° we have compared the change in the CSA for four different angles (12, 15, 18 and 20°) as a function of residue number in membrane-bound cytb5 as shown in Figure 7 (refer to Table S2 in the Supporting Information for 15N CSA values). It is clear from Figure 7 that with the increase in the angle β, i.e., going from 12° to 20°, there is a uniform change of 1–12 ppm in the 15N CSA values for nearly all the residues except the circled ones. For the residues circled in Figure 7, the change in the CSA value is larger as compared to other residues (15–41 ppm versus 1–12 ppm) while increasing the angle from 18° to 20°. This observation is quite obvious from the following inequalities ηxy/R2 ≤ P2(cos β), ηxy/R2 ≤ 2dc/(d2 + c2) and ηxy/R2 ≤ 1, which are required to be simultaneously followed for the experimentally derived CSA.29 The first inequality determines the upper limit of angle (β) while the second determines both the lower and the upper limits of CSA. With the increase in the angle β from 12° to 20°, the value of P2(cos β) decreases and as the difference (ηxy/R2)−P2(cos β) becomes narrower (refer to Table S3 in the Supporting Information for (ηxy/R2) values), even a small variation in the angle causes a larger change in the CSA. For an illustrative purpose we have taken a case of residue V66 as an example. The calculated backbone amide-15N CSA for V66 at angles 12, 14, 16, 18 and 20° are −215.5, −226.8, −242.4, −265.4 and −306.7 ppm, respectively. The difference in 15N CSA for every 2° increase in angles is 11.3, 15.6, 23.0 and 41.3 ppm, respectively. The value of ηxy/R2 for V66 is 0.81 (corresponding to an upper limit of angle 20.9°) while the values of P2(cos β) for above listed angles are 0.94, 0.91, 0.89, 0.86 and 0.83. At a constant angle of 20° which is very close to the upper limit of the angle for V66, the difference (ηxy/R2)−P2(cos β)is minimal, leading to an abrupt change in CSA (41.3 ppm) when the angle is changed from 18° to 20°. As a result, we have carried out our calculations at a constant angle (β) of 18° since the variation of 15N CSA is almost uniform for all the residues of a membrane-bound cytb5. The average value of backbone amide-15N CSA for cytb5 (excluding the outliers in the termini and the linker regions) at a constant angle of 18° is found to be −171.7 ppm.
Figure 7. A 3D-plot showing the variation of backbone amide-15N CSA values on angle β.
The 3D-plot of 15N CSA values obtained for β angles of 12° (blue), 15° (red), 18° (green) and 20° (black) against the residue number of cytb5. Circled residues show a larger change in the CSA when changing the angle from 18 to 20°.
Since 15N CSA values depend on the effective N-H bond length, rN-H, and the angle, β, the choice of rN-H=1.023 Å and β =18° for all residues in the protein may not be correct. For example, residues in the unstructured regions can have a different N-H bond length and Gly residues can have larger β angle based on previous solid-state NMR study.76. In addition, internal motions can alter the N-H bond length by 10–15% based on the motionally averaged N-H dipolar couplings measured from solid-state NMR studies.75–78 Even a small deviation of the order of 10−2 in the N-H bond length or 1° increase in the β angle could alter the calculated CSA values. To substantiate this aspect, we have calculated the difference in CSA values obtained for rN-H of 1.023 Å and 1.04 Å. The CSA values decrease by a factor of (1.023/1.04)3=0.952 with an increase in the N-H bond length with a variation ranging between 5 and 13 ppm (refer to Figure S2 in the Supporting Information). Also as shown in Table S2 of the Supporting Information, even 1° increase in the β angle (going from 17° to 18°) could increase the CSA by 13 ppm.
Effect of the paramagnetic Fe(III) on the backbone amide-15N CSA of cytb5
Based on the observed 15N CSA values, an investigation of the protein dynamics across different structural elements was carried out. For a bond length rN-H =1.023 Å and the angle β =18°, the mean value for 15N CSA was found to be larger in the helical region (−187.9 ppm) than in the sheet (−166.0 ppm) and the turn regions (−161.1 ppm) excluding the outliers in the termini and the linker regions. The observed trend is similar to earlier reports on water-soluble proteins11,63,77,79 thus validating the 15N CSA dependence on the backbone torsion angles and H-bonding interactions. However, in our case the observed mean value of 15N CSA for helical region (−187.9 ppm) of the protein is on the higher side as compared to the average value (−171.7 ppm) for the protein. This observation can be further analyzed on the basis of the interaction of few backbone amide NH nuclei with the low-spin (S=1/2) paramagnetic center (Fe(III)) of the heme unit of cytb5 that can enhance the 15N-transverse relaxation rates. An increase in the relaxation rate of backbone nuclei (amide protons and nitrogens) in a paramagnetic cytb5, in comparison to the diamagnetic cytb5, is reported elsewhere.94 The observed paramagnetic effect is reported to be stronger for residues in close proximity to the heme unit, with the largest paramagnetic relaxation enhancement was found to be ~15%. It may also be possible that this interaction causes an additional contribution in the form of cross-correlation between CSA and dipolar shielding anisotropy (DSA)80,81 due to the thermally averaged electronic spin (Curie spin)82,83 of the paramagnetic Fe(III). For a paramagnetic center this contribution cannot be ignored for smaller distances from the Fe(III) at higher magnetic field strengths. The CSA×DSA cross-correlation rate depends on the relative orientation of the principal components of CSA and DSA tensors and is inversely proportional to the cube of the distance between the nuclear and the electronic spin. In cytb5 the residues L41, E42, E43, E48, E49, V50, L51, R52, E53, Q54, T60, E61, N62, F63, E64, D65, V66, D71, A72, R73, E74, L75, S76, K77, F79 (all from helical region), L30, Y35 (from beta-sheet), H31, L37, T38, F40, H44, A59, G67, H68, S69 (all from turn) are in close proximity (< 12.5 Å) to the paramagnetic center Fe(III) of the heme unit (refer to Figure S1 in the Supporting Information). Most of these residues such as H31, Y35, L41, E42, E43, E48, V50, L51, R52, E53, Q54, T60, E61, N62, F63, E64, D65, V66, G67, H68, D71, A72, R73, E74 and S76 (refer to Table 2S in Supporting Information for values of 15N CSA) show relatively higher span of 15N CSA which is possibly because of the effective shielding due to CSA×DSA cross-correlation effect. Also, it is important to note that most of the residues interacting with the paramagnetic center exhibiting larger span of 15N CSA are from the helical region; hence the observed mean value is higher for helical regions as compared to reported values. The 15N CSA for backbone amide residues (D87, D88 and R89) in the last helix along the polypeptide chain are small when compared to most of the other helical residues in the protein. These residues are situated at a larger distance (> 25.0 Å) from the paramagnetic center and as a result their interaction with paramagnetic center is less pronounced leading to a smaller 15N CSA. This also validates the dependence of the 15N CSA for structured regions on the distance from the paramagnetic center. Residues such as T38, F40, H44, A59 and S69 show relatively lower values of 15N CSA even if they are in close proximity with the paramagnetic center. These residues are in the turn regions of the protein sequence, and their flexibility may reduce the observed 15N CSA values. Spectral overlap for the residues L30, L37 and L75, debarred them from the 15N CSA analysis.
Site-specific variation of the backbone amide-15N CSA in cytb5
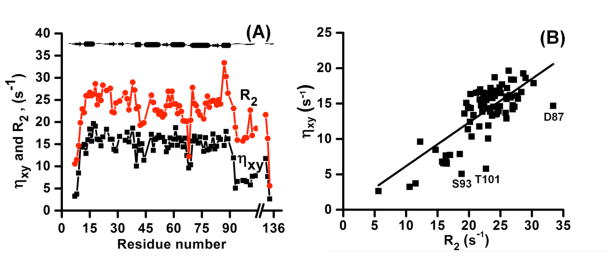
The calculated 15N-transverse cross-correlation rates (ηxy) for various residues of cytb5 have a linear correlation (slope = 0.61±0.01) with transverse relaxation rate (R2) as shown in Figure 8. This is in accordance with the theoretical calculation by Fushman and Cowburn.28 The uniform spread of data points around the average-slope line shows site-specific variations in the 15N CSA values for cytb5. The outliers in the plot are mostly from the linker region (e.g., S93 and T101). An exception is D87 residue located in the helical region but next to the Pro86 residue that breaks the secondary structure in the sequence, which could reduce the CSA as observed in our study.
Figure 8. A comparison of the backbone amide-15N transverse cross-correlation rate with the transverse relaxation rate and their linear correlation.
Panel A of the plot represents a comparison between the derived backbone amide-15N CSA-dipolar cross-correlation rate (ηxy) and the transverse relaxation rate (R2) while panel B represents a linear correlation with a slope = 0.61±0.01 between these parameters.
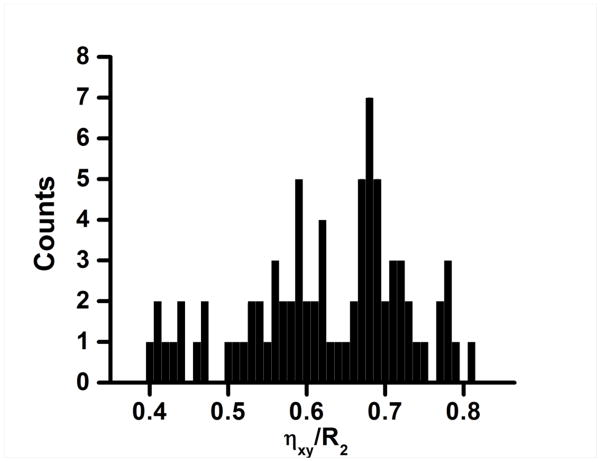
To further validate the site-specific variation of CSA, a bar graph is plotted in Figure 9 that shows a Gaussian spread of ηxy/R2 values for various residues in cytb5. The spread starts from 0.4 (excluding the residues in N- and C-termini and in the linker region) and ends at 0.81 with a mean value of 0.68. Past studies have shown the site-specific variation of 15N CSA both in solution as well as in the solid-state. 15N CSA determined for short peptides and proteins from solid-state NMR studies show a narrow range of variation as compared to solution NMR studies (refer to Tables S4, S5 and S6 in the Supporting Information).11,16,76 Based on the amide-15N CSA values reported in a recent review article,16 the 15N CSA values in solid-state varies from 139.8 to 168.8 ppm. The difference between the values reported from solid-state and solution NMR studies is mainly because the solution NMR approach applies a correction for the effects of small amplitude internal motion while solid-state NMR utilizes the motionally averaged CSA and N-H dipolar couplings.32 This is also confirmed by a recent theoretical study, using automated fragmentation quantum mechanics/molecular mechanics (AF-QM/MM) on crystal structures of GB1 and GB3 proteins, that reported CSA values that are in agreement with solid-state NMR values.54 The site-specific CSAs determined from solution NMR studies for ubiquitin, ribonuclease H, and GB3 were reported to be −125 to −216 ppm,29 −129 to −213 ppm,30 and −111 to −241 ppm,61 respectively. In the present study, the backbone amide-15N CSA exhibits even a larger range of CSA: −123 ppm to −245 ppm (excluding the outliers: a turn residue F40, D87 attached to Pro86, and residues in termini and linker regions) with an exception of 265 ppm for V66 residue that is very close to Fe(III). While most values reported in this study are in good agreement with previous solution NMR studies, the higher CSA values for certain residues reported in this study may be attributed to the effect of the interaction of backbone nuclei (15N and 1H) with the paramagnetic center of the heme unit in addition to the uncertainty in the internuclear distance (rN-H) and angle (β) as discussed above. Nevertheless, the average amide-15N CSA value of −171.7 ppm determined for cytb5 (excluding the outliers in the termini and the linker regions) is found to be consistent with earlier reports from solid-state NMR studies on peptides using 15N-dipolar coupled powder pattern,1,2,75,76,84–90 15N NMR of single crystal,91,92 static93–96 spectra and solution NMR studies on water-soluble proteins30,61,63,97–99 (refer to Tables S4, S5 and S6 in the Supporting Information).
Figure 9. Distribution ηxy/R2 of in cytb5.
The plot represents a Gaussian distribution of the ratio of transverse cross-correlation (ηxy) and transverse relaxation rates (R2). The mean value of the distribution is 0.68.
Conclusions
In summary, we have measured 15N CSA/dipolar transverse cross-correlation rates using 1H-coupled 15N-1H HSQC type IPAP spectra to determine 15N CSA tensors for backbone amide residues in a full-length membrane-bound protein cytb5 incorporated in DPC micelles to understand the overall dynamics of the protein. A narrow span of 15N transverse correlation rates is observed in the structured regions suggesting a uniform characteristic of 15N cross-correlated relaxation while the larger variation observed in the termini and linker region suggests a highly dynamic nature. The mean value of backbone amide-15N CSA of cytb5 excluding the outliers in the termini and linker region is found to be −171.7 ppm for an NH bond length of 1.023 Å and at β =18°, the angle the least shielded component of the tensor makes with the N-H bond. The average values of 15N CSA for residues in the helical, sheet and turn regions are −187.9, −166.0, and −161.1 ppm, respectively. Larger CSA values observed for helical residues of the protein as compared to previous solution NMR values is possibly due to the enhanced CSA/DSA cross-correlation rate resulting from the interaction of the amide nitrogens and protons with the paramagnetic center Fe(III) of the heme unit. Therefore, it is worthwhile to characterize the paramagnetic effect on the experimentally measured CSA values in such paramagnetic proteins. We believe that this study will be a step forward to better understand the structure, dynamics and orientation of membrane proteins based on well-characterized backbone amide-15N CSA values using NMR spectroscopy.
Supplementary Material
Acknowledgments
We would like to thank Professor David Fushman, University of Maryland, for providing us with the NMR pulse program. This research is supported by funds from NIH (GM084018 and GM095640 to A.R.).
Footnotes
Supporting Information Available
Tables for measured backbone amide-15N transverse cross-correlation rates (ηxy) values; calculated backbone amide-15N Chemical shift anisotropy (CSA); ratio of transverse cross-correlation rates (ηxy) and transverse relaxation rate (R2); 15N CSA values determined from past studies. Figures showing residues of cytb5 that are located within 12.5Å distance from paramagnetic center Fe(III) of the heme unit and difference in 15N CSA calculated for two values of internuclear distance. This material is available free of charge via the Internet at http://pubs.acs.org.
References
- 1.Hartzell CJ, Whitfield M, Oas TG, Drobny GP. J Am Chem Soc. 1987;109:5966. [Google Scholar]
- 2.Oas TG, Hartzell CJ, Dahlquist FW, Drobny GP. J Am Chem Soc. 1987;109:5962. [Google Scholar]
- 3.Oas TG, Hartzell CJ, McMahon TJ, Drobny GP, Dahlquist FW. J Am Chem Soc. 1987;109:5956. [Google Scholar]
- 4.Linder M, Höhener A, Ernst RR. J Chem Phys. 1980;73:4959. [Google Scholar]
- 5.Hester RK, Ackerman JL, Neff BL, Waugh JS. Phys Rev Lett. 1976;36:1081. [Google Scholar]
- 6.Wu CH, Ramamoorthy A, Opella SJ. J Magn Reson A. 1994;109:270. [Google Scholar]
- 7.Maricq MM, Waugh JS. J Chem Phys. 1979;70:3300. [Google Scholar]
- 8.Ramamoorthy A, Opella SJ. Solid State Nucl Magn Reson. 1995;4:387. doi: 10.1016/0926-2040(95)00054-t. [DOI] [PubMed] [Google Scholar]
- 9.Hertzfeld J, Berger AE. J Chem Phys. 1980;73:6021. [Google Scholar]
- 10.Wylie BJ, Franks WT, Graesser DT, Reinstra CM. J Am Chem Soc. 2005;127:11946. doi: 10.1021/ja053862e. [DOI] [PubMed] [Google Scholar]
- 11.Wylie BJ, Sperling LJ, Frericks HL, Shah GJ, Franks WT, Reinstra CM. J Am Chem Soc. 2007;129:5318. doi: 10.1021/ja0701199. [DOI] [PubMed] [Google Scholar]
- 12.Tycko R, Dabbagh G, Mirau PA. J Magn Reson. 1989;85:265. [Google Scholar]
- 13.Chan JCC, Tycko R. J Chem Phys. 2003;118:8378. [Google Scholar]
- 14.Yao X, Hong M. J Am Chem Soc. 2002;124:2730. doi: 10.1021/ja017137p. [DOI] [PubMed] [Google Scholar]
- 15.Shekar SC, Ramamoorthy A, Wittebort RJ. J Magn Reson. 2002;155:257. doi: 10.1006/jmre.2002.2518. [DOI] [PubMed] [Google Scholar]
- 16.Saitô H, Ando I, Ramamoorthy A. Prog Nucl Magn Reson Spectrosc. 2010;57:181. doi: 10.1016/j.pnmrs.2010.04.005. [DOI] [PMC free article] [PubMed] [Google Scholar]
- 17.Naito A, Ganapathy S, Akasaka K, McDowell CA. J Chem Phys. 1981;74:3190. [Google Scholar]
- 18.Facelli JC. Modeling NMR Chemical Shifts. In: Webb GA, editor. Modern Magnetic Resonance. Vol. 1. Springer; Dordrecht: 2006. p. 53. [Google Scholar]
- 19.Oldfield E. Annul Rev Phys Chem. 2002;53:349. doi: 10.1146/annurev.physchem.53.082201.124235. [DOI] [PubMed] [Google Scholar]
- 20.Fukui H. Prog Nucl Magn Reson Spectrosc. 1997;31:317. [Google Scholar]
- 21.de Dios AC, Oldfield E. J Am Chem Soc. 1994;116:11485. [Google Scholar]
- 22.de Dios AC. Prog Nucl Magn Reson Spectrosc. 1996;29:229. [Google Scholar]
- 23.Sitkoff D, Case DA. Prog Nucl Magn Reson Spectrosc. 1998;32:165. [Google Scholar]
- 24.Ando I, Kuroki S, Kurosu H, Yamanobe T. Prog Nucl Magn Reson Spectrosc. 2001;39:79. [Google Scholar]
- 25.Karadakov P. Ab Initio Calculation of NMR Shielding Constants. In: Webb GA, editor. Modern Magnetic Resonance. Vol. 1. Springer; Dordrecht: 2006. p. 59. [Google Scholar]
- 26.Loth K, Pelupessy P, Bodenhausen G. J Am Chem Soc. 2005;127:6062. doi: 10.1021/ja042863o. [DOI] [PubMed] [Google Scholar]
- 27.Goldman M. J Magn Reson. 1984:60. [Google Scholar]
- 28.Fushman D, Cowburn D. J Am Chem Soc. 1998;120:7109. doi: 10.1021/ja0031117. [DOI] [PubMed] [Google Scholar]
- 29.Fushman D, Tjandra N, Cowburn D. J Am Chem Soc. 1998;120:10947. [Google Scholar]
- 30.Kroenke CD, Rance M, Palmer AG., III J Am Chem Soc. 1999;121:10119. [Google Scholar]
- 31.Lienin SF, Bremi T, Brustscher B, Brüchweiler R, Ernst RR. J Am Chem Soc. 1998;120:9870. [Google Scholar]
- 32.Tjandra N, Szabo A, Bax A. J Am Chem Soc. 1996;118:6986. [Google Scholar]
- 33.Früh D, Chiarparin E, Pelupessy P, Bodenhausen G. J Am Chem Soc. 2002;124:4050. doi: 10.1021/ja011790v. [DOI] [PubMed] [Google Scholar]
- 34.Walker O, Mutzenhardt P, Tekely P, Canet D. J Am Chem Soc. 2002;124:865. doi: 10.1021/ja0166702. [DOI] [PubMed] [Google Scholar]
- 35.Markwick PRL, Sattler M. J Am Chem Soc. 2004;126:11424. doi: 10.1021/ja047859r. [DOI] [PubMed] [Google Scholar]
- 36.Wylie BJDSC, Oldfield E, Reinstra CM. J Am Chem Soc. 2009;131:985. doi: 10.1021/ja804041p. [DOI] [PMC free article] [PubMed] [Google Scholar]
- 37.Havlin RH, Laws DD, Bitter HML, Sanders LK, Sun H, Grimley JS, Wemmer DE, Pines A, Oldfield E. J Am Chem Soc. 2001;123:10362. doi: 10.1021/ja0115060. [DOI] [PubMed] [Google Scholar]
- 38.Birn J, Poon A, Mao Y, Ramamoorthy A. J Am Chem Soc. 2004;126:8529. doi: 10.1021/ja049879z. [DOI] [PMC free article] [PubMed] [Google Scholar]
- 39.Tessari M, Mulder FAA, Boelens RWVG. J Magn Reson. 1997;127:128. [Google Scholar]
- 40.Tugarinov V, Scheurer C, Brüschweiler R, Kay LE. J Biomol NMR. 2004;30:397. doi: 10.1007/s10858-004-4349-x. [DOI] [PubMed] [Google Scholar]
- 41.Ramamoorthy A, Wu CH, Opella SJ. J Am Chem Soc. 1997;119:10479. [Google Scholar]
- 42.Wei Y, de Dios AC, McDermott AE. J Am Chem Soc. 1999;121:10389. [Google Scholar]
- 43.de Dios AC, Pearson JG, Oldfield E. Science. 1993;260:1491. doi: 10.1126/science.8502992. [DOI] [PubMed] [Google Scholar]
- 44.Ferraro MB, Repetto V, Facelli JC. Solid State Nucl Magn Reson. 1998;10:185. doi: 10.1016/s0926-2040(97)00086-6. [DOI] [PubMed] [Google Scholar]
- 45.Scheurer C, Skrynnikov R, Lienin SF, Straus SK, Brüschweiler R, Ernst R. J Am Chem Soc. 1999;121:4242. [Google Scholar]
- 46.Hu JZ, Facelli JC, Alderman DW, Pugmire RJ, Grant DM. J Am Chem Soc. 1998;120:9863. [Google Scholar]
- 47.Walling AE, Pargas RE, de Dios AC. J Phys Chem A. 1997;101:7299. [Google Scholar]
- 48.Brender JR, Taylor DM, Ramamoorthy A. J Am Chem Soc. 2001;123:914. doi: 10.1021/ja001980q. [DOI] [PubMed] [Google Scholar]
- 49.Cai LFD, Kosov DS. J Biomol NMR. 2008;41:77. doi: 10.1007/s10858-008-9241-7. [DOI] [PMC free article] [PubMed] [Google Scholar]
- 50.Cai L, Fushman D, Kosov DS. J Biomol NMR. 2009;45:245. doi: 10.1007/s10858-009-9358-3. [DOI] [PMC free article] [PubMed] [Google Scholar]
- 51.Poon A, Birn J, Ramamoorthy A. J Phys Chem B. 2004;108:16577. doi: 10.1021/jp0471913. [DOI] [PMC free article] [PubMed] [Google Scholar]
- 52.Le H, Oldfield E. J Phys Chem. 1996;100:16423. [Google Scholar]
- 53.Cai L, Kosov DS, Fushman D. J Biomol NMR. 2011;50:19. doi: 10.1007/s10858-011-9474-8. [DOI] [PMC free article] [PubMed] [Google Scholar]
- 54.Tang S, Case DA. J Biomol NMR. 2011;51:303. doi: 10.1007/s10858-011-9556-7. [DOI] [PMC free article] [PubMed] [Google Scholar]
- 55.Strohmeier M, Grant DM. J Am Chem Soc. 2004;126:966. doi: 10.1021/ja037330e. [DOI] [PubMed] [Google Scholar]
- 56.Hall JB, Fushman D. Magn Reson Chem. 2003;41:837. [Google Scholar]
- 57.Hall JB, Dayie KT, Fushman D. J Biomol NMR. 2003;26:181. doi: 10.1023/a:1023546107553. [DOI] [PubMed] [Google Scholar]
- 58.Fushman D, Tjandra N, Cowburn D. J Am Chem Soc. 1999;121:8577. [Google Scholar]
- 59.Canet D, Barthe P, Mutzenhardt P, Roumestand C. J Am Chem Soc. 2001;123:4567. doi: 10.1021/ja0038676. [DOI] [PubMed] [Google Scholar]
- 60.Cisnetti F, Loth K, Pelupessy P, Bodenhausen G. ChemPhysChem. 2004;5:807. doi: 10.1002/cphc.200301041. [DOI] [PubMed] [Google Scholar]
- 61.Hall JB, Fushman D. J Am Chem Soc. 2006;128:7855. doi: 10.1021/ja060406x. [DOI] [PMC free article] [PubMed] [Google Scholar]
- 62.Damberg P, Jarvet J, Gräslund A. J Am Chem Soc. 2005;127:1995. doi: 10.1021/ja045956e. [DOI] [PubMed] [Google Scholar]
- 63.Yao L, Grishaev A, Cornilescu G, Bax A. J Am Chem Soc. 2010;132:4295. doi: 10.1021/ja910186u. [DOI] [PMC free article] [PubMed] [Google Scholar]
- 64.Im SC, Waskell L. Arch Biochem Biophys. 2011;507:144. doi: 10.1016/j.abb.2010.10.023. [DOI] [PMC free article] [PubMed] [Google Scholar]
- 65.Schenkman JB, Jansson I. Pharmacology & Therapeutics. 2003;97:139. doi: 10.1016/s0163-7258(02)00327-3. [DOI] [PubMed] [Google Scholar]
- 66.Ahuja S, Vivekanandan S, Popovych N, Le Clair SV, Soong R, Yamamoto K, Xu J, Nanga RPR, Im S-C, Waskell L, Ramamoorthy A. NMR Structural Studies of a Membrane-Associated (>70kDa) Complex between Cytochrome P450 and b5. Poster-204 in The 52nd Experimental Nuclear Magnetic Resonance Conference; April 10 –15; Asilomar. 2011. [Google Scholar]
- 67.Mulrooney SB, Waskell L. Protein expression and purification. 2000;19:173. doi: 10.1006/prep.2000.1228. [DOI] [PubMed] [Google Scholar]
- 68.Delaglio F, Grzesiek S, Vuister GW, Zhu G, Pfeifer J, Bax A. J Biomol NMR. 1995;6:277. doi: 10.1007/BF00197809. [DOI] [PubMed] [Google Scholar]
- 69.Kneller DG, Kuntz ID. J Cell Biochem. 1993:254. [Google Scholar]
- 70.KPGWKW J Biomol NMR. 1998;12:345. [Google Scholar]
- 71.Dvinskikh SV, Yamamoto K, Ramamoorthy A. J Chem Phys. 2006;125:034507. doi: 10.1063/1.2212939. [DOI] [PubMed] [Google Scholar]
- 72.Caravatti P, Braunschweiler L, Ernst RR. Chem Phys Lett. 1983;100:305. [Google Scholar]
- 73.Ottiger M, Delaglio F, Bax A. J Magn Reson. 1998;131:373. doi: 10.1006/jmre.1998.1361. [DOI] [PubMed] [Google Scholar]
- 74.Tjandra N, Feller SE, Pastor RW, Bax A. J Am Chem Soc. 1995;117:12562. [Google Scholar]
- 75.Wu CH, Ramamoorthy A, Gierasch LM, Opella SJ. J Am Chem Soc. 1995;117:6148. [Google Scholar]
- 76.Lee DK, Wittebort RJ, Ramamoorthy A. J Am Chem Soc. 1998;120:8868. [Google Scholar]
- 77.Cornilescu G, Bax A. J Am Chem Soc. 2000;122:10143. [Google Scholar]
- 78.Roberts JE, Harbison GS, Munowitz MG, Herzfeld J, Griffin RG. J Am Chem Soc. 1987;109:4163. [Google Scholar]
- 79.Wylie BJ, Reinstra CM. J Chem Phys. 2008;128:052207. doi: 10.1063/1.2834735. [DOI] [PubMed] [Google Scholar]
- 80.Pintacuda G, Kaikkonen A, Otting G. J Magn Reson. 2004;171:233. doi: 10.1016/j.jmr.2004.08.019. [DOI] [PubMed] [Google Scholar]
- 81.Otting G. Annu Rev Biophys. 2010;39:387. doi: 10.1146/annurev.biophys.093008.131321. [DOI] [PubMed] [Google Scholar]
- 82.Gueron M. J Magn Reson. 1975;19:58. [Google Scholar]
- 83.Vega AJ, Fiat D. Molec Phys. 1976;31:347. [Google Scholar]
- 84.Mai W, Hu W, Wang C, Cross TA. Protein Science. 1993;2:532. doi: 10.1002/pro.5560020405. [DOI] [PMC free article] [PubMed] [Google Scholar]
- 85.Fukutani A, Naito A, Tuzi S, Saitô H. J Mol Struct. 2002;602:491. [Google Scholar]
- 86.Hiyama Y, Niu CH, Silverton JV, Bavoso A, Torchia DA. J Am Chem Soc. 1988;110:2378. [Google Scholar]
- 87.Lee DK, Wei Y, Ramamoorthy A. J Phys Chem B. 2001;105:4752. [Google Scholar]
- 88.Chekmenev EY, Zhang Q, Waddell KW, Mashuta MS, Wittebort RJ. J Am Chem Soc. 2003;126:379. doi: 10.1021/ja0370342. [DOI] [PubMed] [Google Scholar]
- 89.Wei Y, Lee DK, McDermott AE, Ramamoorthy A. J Magn Reson. 2002;158:23. doi: 10.1016/s1090-7807(02)00056-3. [DOI] [PubMed] [Google Scholar]
- 90.Lee DK, Santos JS, Ramamoorthy A. Chem Phys Lett. 1999;309:209. [Google Scholar]
- 91.Waddell KW, Chekmenev EY, Wittebort RJ. J Am Chem Soc. 2005;127:9030. doi: 10.1021/ja044204h. [DOI] [PubMed] [Google Scholar]
- 92.Harbison GS, Jelinski LW, Stark RE, Torchia DA, Herzfeld J, Griffin RG. J Magn Reson. 1984;60:79. [Google Scholar]
- 93.Shoji A, Ozaki T, Fujito T, Deguchi K, Ando S, Ando I. J Am Chem Soc. 1990;112:4693. [Google Scholar]
- 94.Shoji A, Ozaki T, Fujito T, Deguchi K, Ando S, Ando I. Macromolecules. 1989;22:2860. [Google Scholar]
- 95.Ashikawa M, Shoji A, Ozaki T, Ando I. Macromolecules. 1999;32:2288. [Google Scholar]
- 96.Shoji A, Ozaki T, Fujito T, Deguchi K, Ando I, Magoshi J. J Mol Struct. 1998;441:251. [Google Scholar]
- 97.Boyd J, Redfield C. J Am Chem Soc. 1999;121:7441. [Google Scholar]
- 98.Kurita J, Shimahara H, Utsunomiya-Tate N, Tate S. J Magn Reson. 2003;163:163. doi: 10.1016/s1090-7807(03)00080-6. [DOI] [PubMed] [Google Scholar]
- 99.Tjandra N, Wingfield P, Stahl S, Bax A. J Biomol NMR. 1996;8:273. doi: 10.1007/BF00410326. [DOI] [PubMed] [Google Scholar]
Associated Data
This section collects any data citations, data availability statements, or supplementary materials included in this article.


