Abstract
The effect of hydration on the lowest vertical ionization energy (VIE) of phenol and phenolate solvated in bulk water was characterized using the equation-of-motion ionization potential coupled-cluster (EOM-IP-CCSD) and effective fragment potential (EFP) methods (referred to as EOM/EFP), and determined experimentally by valence photo-emission measurements using microjets and synchrotron radiation. The computed solvent-induced shifts in VIEs (ΔVIE) are −0.66 eV and +5.72 eV for phenol and phenolate, respectively. Our best estimates of the absolute values of VIEs (7.9 and 7.7 eV for phenol and phenolate) agree reasonably well with the respective experimental values (7.8±0.1 eV and 7.1±0.1 eV). The EOM/EFP scheme was benchmarked against full EOM-IP-CCSD using micro-solvated phenol and phenolate clusters. A protocol for calculating redox potentials with EOM/EFP was developed based on linear response approximation (LRA) of free energy determination. The oxidation potentials of phenol and phenolate calculated using LRA and EOM/EFP are 1.32 V and 0.89 V, respectively; they agree well with experimental values.
1 Introduction
One-electron transfer processes are ubiquitous in nature. They are important in biochemical, organic, and environmental processes.1–6 The thermodynamics of redox reactions is quantified by redox potentials, E, that can be measured electrochemically and are related to the Gibbs free energy change (ΔG):
| (1) |
where n is the number of electrons transferred in the cell and F is the Faraday constant.
Experimental and theoretical techniques for determining these quantities have been developed and refined over many years. The potentials of half-reactions, which are tabulated against standard hydrogen electrode (SHE), are measured relative to various reference electrodes at well defined conditions.7 Yet, chemical transformations (e.g., proton transfer) induced by oxidation/reduction can considerably complicate electrochemical measurements.
Theoretical predictions of redox potentials are based on Eq. (1) and require evaluation of ΔG for the oxidation or reduction process in question, e.g.:
| (2) |
for the oxidation reaction. A common strategy for calculating the free energy change for redox reactions8–11 is based on the thermodynamic cycle shown in Fig. 1. That is, the free energy change for the reaction (2), ΔGrxn, in solvent is computed from the free energy of the gas-phase oxidation (or ionization) process (ΔGIE) and solvation energies of the reduced/oxidized species (ΔGsol):
| (3) |
Figure 1.
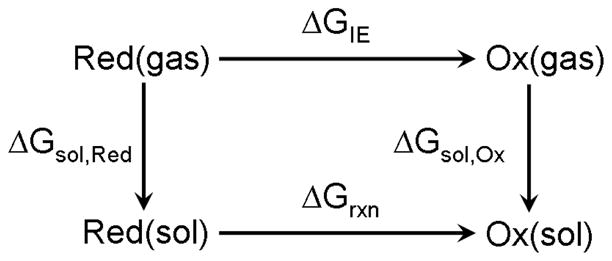
Thermodynamic cycle describing the energetics of a redox process using Hess’ law.
The main contribution to ΔGIE, gas-phase ionization energy (IE), can be reliably calculated using high level ab initio methods with large basis set (or even extrapolated to the complete basis set limit). The most widely used method for calculating free energy of solvation, ΔGsol, is based on polarizable continuum models (PCM),12–15 which involve variable degree of parameterization and neglect specific solute–solvent interactions such as H-bonding. While many continuum models can calculate ΔGsol accurately for neutral solutes, they may have errors up to 0.4 eV for charged species.11, 16 Thus, the imbalance in errors between ΔGsol of reduced and oxidized solutes can lead to the errors in ΔGox of around 0.5 eV.5 Similar errors were observed in calculations of VIEs of halide ions using nonequilibrium PCM.17 The accuracy of continuum models, which cannot describe specific solvent interactions that are especially important in charged systems, can be improved by considering the first few solvation shells explicitly.
In short, the main source of errors in computed redox potentials is due to ΔGsol. Likewise, accuracy of calculations of spectroscopic properties of solvated species, such as excitation or ionization energies, also depends crucially on proper account of the effect of the solvent on the electronic properties of a solute. Therefore, it is highly desirable to develop a first-principle approach for calculating ionization energies and redox potentials of solvated species using explicit solvent models. Effective fragment potential (EFP) method offers a computationally affordable yet rigorous way to describe solvent-solute interactions18–21 within a hybrid QM/EFP (quantum mechanical-EFP) scheme.
EFP is a non-empirical model potential, which treats solvent molecules as discrete entities. The effective fragments (EFs) perturb the QM region by their electrostatic field and are polarizable. EFP also includes dispersion and exchange-repulsion terms. When combined with appropriate ab initio methods, QM/EFP scheme allows one to compute solvent induced shifts in excitation or ionization energies.21, 22 In these calculations, the polarization response of the solvent to the excitation of the solute is included via perturbation theory.21, 22
In this work, we continue the benchmarking of the EFP/EOM-IP-CCSD scheme, EFP combined with equation-of-motion for ionization potentials within the coupled-cluster model with single and double substitution, for calculations of IEs in solutions. Furthermore, we extend the EOM/EFP methodology to calculate redox potentials using the linear response approximation (LRA) to free energy perturbation method. These calculations involve the reorganization energy (λ), an important concept within the Marcus theory of electron-transfer23, 24 that represents the free energy increase associated with the structural changes of the reactant and its environment on going from the initial to the final state.
We consider two prototypical systems, aqueous phenol and phenolate, and compare theoretical VIEs against the experimental values determined by valence photo-emission measurements using microjets and synchrotron radiation. Thus, this paper presents the first experimental measurements of the VIEs for phenol and phenolate as well as high-level electronic structure calculations of these quantities. The energies of the following two reactions determine ionization/detachment energies as well as oxidation potentials of the respective species:
| (4) |
| (5) |
The redox properties of these species are of special interest because they are often used as reference values.25–30 The phenolic motif is the functional group of the tyrosine amino acid and commonly occurs in other bio-molecules, e.g., hormones and vitamins. The redox properties of tyrosine are of special significance, as it is believed to be involved in long-range charge transport in redox-active proteins serving as an intermediate electron donor/acceptor.31
Of an immediate interest to our group, tyrosine is a part of the chromophores from the green fluorescent protein (GFP) family,5, 32 and it has been suggested that the redox properties of phenolates are similar to the GFP chromophores.33 There have been several experimental and theoretical studies of the redox properties of these species.34–39 The theoretical work has been based on implicit solvation models; thus, the role of specific H-bonding interactions has not been elucidated.
The electrochemistry of phenols and phenolates has been extensively investigated.25–27, 29, 30, 40–42 Owing to irreversible processes initiated by oxidation-induced deprotonation (oxidized phenol is a very strong acid of pKa=−2, in stark contrast of neutral phenol that has pKa=10), phenol presents a particularly challenging case,29, 30 and most of the experimental studies have focused on methylated and/or tert-butyl-substituted species. Thus, phenol is an example of when an alternative experimental approach, such as photo-electron spectroscopy using microjets, allows one to derive a complimentary thermodynamic information that can be used to validate the theory.
The structure of the paper is as follows. Section 2 describes the computational protocol that we developed. It describes the hybrid EOM-IP-CCSD/EFP method (Sec. 2.1), outlines LRA (Sec. 2.2), and discuses issues of sampling that are relevant to the simulations of charged systems (Sec. 2.3). Section 2.4 provides computational details. Section 2.5 describes the experimental setup. Section 3 presents our results and discussion including benchmark calculations on microsolvated phenol and phenolate (Sec. 3.1), VIE calculations of bulk solvated systems (Sec. 3.2), experimental photoionization spectra (Sec. 3.2.1), calculations of the redox potentials (Sec. 3.3) and the reorganization energies (Sec. 3.4). Our concluding remarks are given in Section 4.
2 Methodology
2.1 The EOM-IP-CCSD/EFP scheme
First-principle modeling of solvent-induced effects on electronic properties of solvated species using explicit solvent representation requires the consideration of a formidable number of degrees of freedom, which is impossible to perform by high-level ab initio methods. Therefore, we employ a hybrid QM/MM-like (quantum mechanics-molecular mechanics) approach43, 44 which entails dividing the system into (i) a QM part containing the species that are being ionized or electronically excited and is described by a correlated electronic structure method, and (ii) an MM part (solvent) that can be treated by a lower level of theory.
In the case of ionization or electron-detachment processes, the method of choice for the QM part is EOM-IP-CCSD.45–50 It is free from spin-contamination, artificial symmetry breaking and self-interaction errors that plague other methods. EOM-IP-CCSD describes problematic target open-shell wave functions by Koopmans-like operators acting on well-behaved closed-shell reference states.45–50 EOM-IP-CCSD simultaneously includes dynamical and non-dynamical correlation, describes multiple electronic states in one calculation, and treats the states with different number of electrons on the same footing. EOM-IP-CCSD has been successfully applied to study a variety of ionized species.49, 51–59
For the MM part, we employ a non-empirical EFP model potential. The EFP method describes intermolecular interactions using perturbation theory starting from non-interacting or unperturbed fragments.18–21 There are no empirical parameters in EFP method, the basis of the potential being a priori ab initio calculation. In short, EFP is an explicit solvent model that includes the effect of Coulomb (multipoles up to octopoles obtained by Stone’s distributed multipole analysis60, 61) and polarization interactions, as well as dispersion and exchange repulsion (see Ref. 20 for details on the EFP implementation employed in this study). EFP can be used to accurately and effectively treat the solvent degrees of freedom.18–21 In excited/ionized state calculations, the polarization response of the solvent is described perturbatively,21 such that multi-state nature of EOM is not compromised and that the electronic wave functions of the target states remain (bi-)orthogonal to each other since they are obtained with the same (reference-state) field of the polarizable environment. A recent study of Kongsted and coworkers62 in which different approximations of including solvent response are investigated using a similar approach, a polarizable embedding model,63 suggests that solvent response may account for as much as 13% of the solvent shift in bulk.
2.2 Calculating free energy difference using linear response approximation
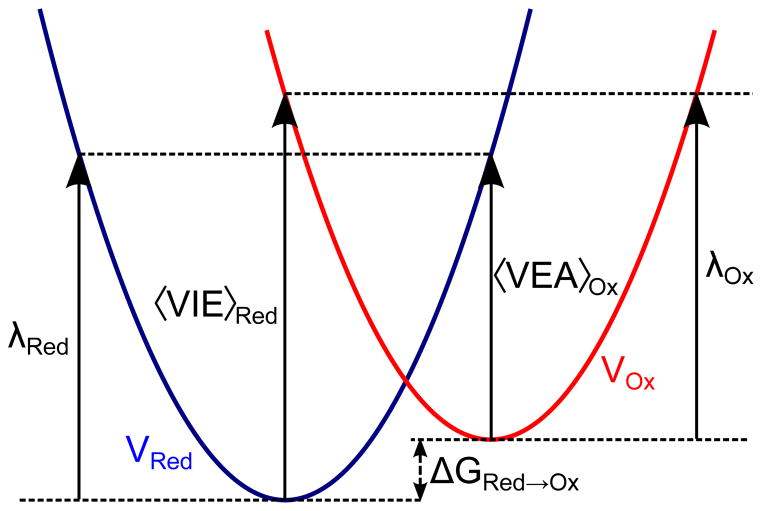
Fig. 2 shows free energy diagram describing the redox process in terms of Marcus theory.23, 24 As one can see, calculations of redox potentials using Eq. (1) requires not only VIE but also the effect of solvent reorganization, λ, around the ionized solute.23, 24
Figure 2.
Free energy surface for redox reaction (Red → Ox). The free energy surfaces (Marcus parabolas) for the reduced (Red) and oxidized (Ox) states are denoted by VRed and VOx. To calculate the free energy difference, ΔGRed→Ox for the above reaction we need to consider the vertical difference in energy and the reorganization energies (λRed and λOx). 〈EOx − ERed〉Red = 〈VIE〉Red and 〈ERed − EOx〉Ox = 〈VEA〉Ox
The effect on ΔG due to a perturbing force, such as that of oxidation or reduction of the system, is related to the equilibrium fluctuations of the unperturbed system through linear response theory. ΔG can be computed as the ratio of the partition functions (Q) of the initial and the final states:64, 65
| (6) |
which can be reformulated as an ensemble average of the energy difference (ΔE):
| (7) |
where 〈…〉i denotes ensemble average over the state i. Using cumulant expansion, ΔG can be expanded to:66
| (8) |
where 〈…〉Ox denotes ensemble average sampled on the potential of the oxidized state (Ox). It can alternatively be written as an ensemble average sampled on the reduced (Red) surface:
| (9) |
Adding equations (8) and (9), and dividing by 2 we arrive to:
| (10) |
Approximation up to the linear term leads to LRA expression for ΔG:
| (11) |
where 〈ERed − EOx〉Red denotes the average vertical energy difference between the reduced and the oxidized states ensemble-averaged over the Red potential. VEA denotes the vertical electron affinity of the oxidized species (that is, IE of the reduced species at the geometry of the oxidized species). The underlying assumption for LRA is that the free energy curves (i.e., Marcus parabolas for the oxidized and reduced states in Fig. 2) have identical shape, which results in identical re-organization energy from Ox → Red and Red → Ox.67–70 In other words, the curvature of the parabolas are similar, i.e., the difference in curvatures are negligible, therefore justifying the truncation from the second term of the cumulant expansion.
The success of Marcus theory of electron transfer justifies the assumption of identical shapes of the free energy curves of the reduced and oxidized species. On the other hand, the experimental study71 of electron ejection/attachment from/to sodium species has demonstrated the breakdown of LRA for this system; in particular, it reveals that the solvent responds slower to the electron removal from anionic species than to the electron attachment to the neutrals. The proposed explanation71 based on the analysis of solute-solvent interaction potentials suggests that the free energy fluctuations around larger anionic species are more likely to deviate from the Gaussian distribution relative to the neutral species.
2.3 Equilibrium sampling for ΔG and VIE calculations
As Fig. 2 and Eq. (11) show, calculation of 〈VIE〉/〈VEA〉 and ΔGOx requires ensemble-averaging over the respective potential energy surfaces (of the oxidized and the reduced states). To model ionization spectra, one needs to compute VIE averaged over the potential surface of the initial (reduced) species. The average value 〈VIE〉Red corresponds to the ionization band maximum, and the distribution of instantaneous values will give inhomogeneous broadening. For the free energy calculations, in addition to 〈VIE〉Red, one also needs to compute 〈VEA〉Ox, that is, VEA of oxidized species averaged over Ox potential. Thus, two equilibrium simulations are required, one for the initial (reduced) species, and another — for the oxidized ones.
When using explicit solvent models, the calculation of average vertical energy differences requires proper equilibrium sampling that can be performed, for example, using standard molecular dynamics (MD) calculations with periodic boundary condition (PBC), as was done in our recent study of thymine.22
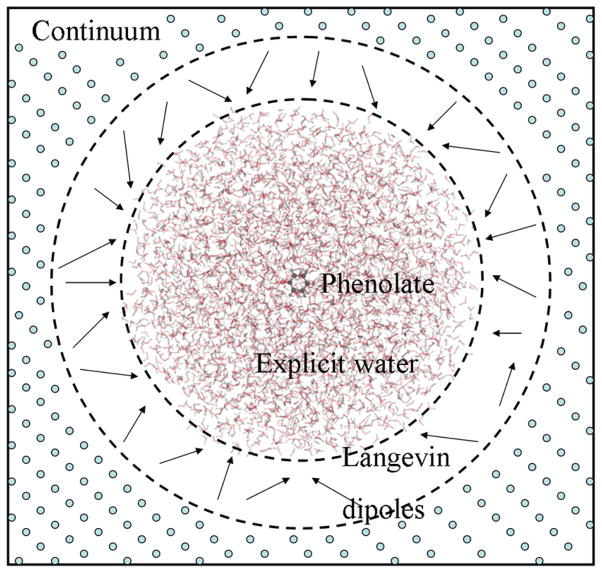
In the case of the charged species, however, the situation is more difficult because application of PBC with Ewald summation is complicated by long-range nature of Coulomb interaction.72 Therefore, we adopt spherical boundary condition (SBC) based on Gauss’ law can be used for such systems.73 The system is set up as a spherical box with the solute in the center and explicit solvent water molecules around it (see Fig. 3). The surface effects are removed by the use of the Langevin dipoles and continuum model.74, 75 Although equilibrium MD of phenol could be described using regular PBC protocol, for the sake of consistency we employ the same setup as for phenolate (Fig. 3).
Figure 3.
The simulation box used in equilibrium MD simulations consists of three regions: (i) the inner most region includes phenolate/phenol and explicit water molecules in a 35 Å sphere and defined by the Enzymix parameters; (ii) the next region consists of a 3 Å ring of the Langevin dipoles; and (iii) the outermost region is a dielectric continuum.
2.4 Computational details
The equilibrium geometries of microhydrated phenolate and phenol molecules were optimized by RI-MP2/cc-pVTZ. These structures were used in EOM-IP-CCSD calculations with the cc-pVTZ and 6-31+G(d) basis sets.
The equilibrium snapshots for phenolate and phenol (and the respective oxidized species) in bulk water were generated using MD simulations using SBC (see Fig. 3) carried out as follows. The ENZYMIX parameters were employed for the classical MD simulation of phenolate/phenol (in the respective oxidation states) and explicit water molecules (within 35 Å spherical box) using the Molaris software.76 Natural Bond Orbital (NBO) charges for MD calculations were calculated using Q-Chem77 following a geometry optimization at the RI-MP2/cc-pVTZ level. Spherical boundary conditions were applied with 3 Å shell of the Langevin dipoles and a dielectric continuum to simulate bulk solvation and remove the effect of surface at the spherical boundary. Prior to running production trajectories, the water box was allowed to equilibrate for 20 ps. The trajectories were allowed to evolve with a constant temperature (300 K) and constant pressure (1 atm) MD run in the correct oxidation states for the production run. After discarding the first 20 ps of equilibration, the snapshots were taken every 500 fs on a trajectory of 150 ps. The analysis of the energy fluctuations along these equilibrium MD trajectories shows that our sampling scheme yields Gaussian-like distributions both for the reduced and oxidized species (see Fig. S2 for phenolate and phenoxyl in SM).
The snapshots from the MD calculations were used for VIE/VEA calculations using the QM/EFP scheme. In these calculations, the QM region consisted of the phenolate (or phenol) molecule and was described by EOM-IP-CCSD/6-31+G(d). The explicit water molecules were treated as EFs. The Langevin dipoles and the continuum in the periphery were not used in the QM/MM calculations of IEs. The explicit water box was big enough (35 Å) to achieve convergence of IEs with respect to the box size. 22, 78
The EOM/EFP calculations were carried out using Q-Chem.77 The EF potentials of water are from the Q-Chem fragment library.20
2.5 Experimental setup
Valence photo-emission (PE) measurements from aqueous solutions of phenol (PhOH) and sodium phenolate (PhO−Na+) were performed at the U41 PGM undulator beamline of the synchrotron radiation facility BESSY II, Berlin. Details of the experimental apparatus have been discussed elsewhere.79, 80 In brief, the PE spectra were collected from a 24-μm diameter liquid microjet injected into vacuum with a velocity of 50 m/s (backing pressure approximately 5 bar) with a reservoir temperature of 20°C. The jet temperature at the locus where photoionization takes place is above 3–5°C as determined by evaporative-cooling modeling.81–83 Ejected photoelectrons were collected normal to both the synchrotron beam polarization and the liquid jet through a 150 μm orifice which acts as an aperture to differentially pump the main chamber, containing the liquid microjet, (1.5×10⁻⁴ mbar) against the hemispherical electron analyzer (10−9 mbar), equipped with a multichannel detector. The photon energy used in the experiments was 200 eV with a total resolution better than 200 meV. Energy resolution of the hemispherical analyzer was 100 meV, achieved here using 10 eV pass energy (in constant kinetic energy mode). The small focal size of 23×12 μm2 at the U41 beamline assures good spatial overlap between the light beam and the liquid jet, and limits the gas-phase contribution to the photoelectron signal to <5% in the case of liquid water. Measured electron kinetic energies are calibrated to the electron binding energy of the 1b1 orbital of liquid water (11.16 eV).84
0.75 M phenol and phenolate solutions were prepared using highly demineralized water (conductance: 18 MΩ/cm−1). Small amount of electrolyte (NaF, ~0.05 M) was added to minimize the charging effect,80, 85, 86 electron emission from the salt does not contribute at binding energies while the fluoride ion 2p electrons do not contribute at binding energies lower than 10 eV.87 Sodium phenolate was formed by addition of 10 M NaOH solution to aqueous phenol such that the equilibrium mixture contains 97.4% phenolate and 2.6% phenol.
3 Results and discussion
Our best theoretical values (EOM-IP-CCSD/cc-pVTZ) for VIEs of isolated phenol and phenolate are 8.55 and 1.99 eV, respectively. The respective adiabatic values are 8.34 and 1.91 eV. The experimental adiabatic IE of phenol and EA of the phenoxy radical are 8.51 eV and 2.25 eV, respectively.88–91 The respective vertical values (8.74 eV and 2.36 eV)92, 93 are within 0.1–0.2 eV from the adiabatic ones. The computed values are in good agreement with the experiment. We note that our value for phenolate is red-shifted by ≈0.3 eV relative to the experiment, which is within error bars of EOM-IP-CCSD.
In the discussion below, we focus on solvent-induced shifts in IEs and EAs, ΔVIE and ΔVEA that are defined as follows:
| (12) |
3.1 Benchmarking EOM/EFP using microsolvated clusters
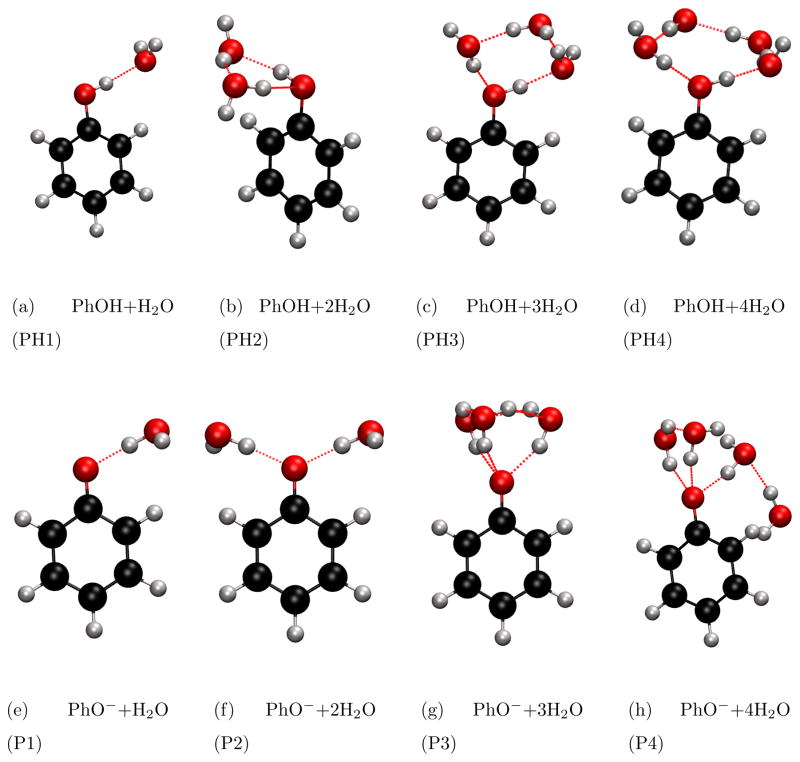
The microsolvated phenol and phenolate structures are shown in Fig. 4. They are optimized at the RI-MP2/cc-pVTZ level of theory. Table 1 compares the values of the ΔVIE (for the lowest ionization) of microsolvated (1–4 water molecules) phenol and phenolate computed by EOM/EFP and full EOM-IP-CCSD in the 6-31+G(d) basis set. ΔVIE is defined as the solvent-induced shift in the lowest VIE:
| (13) |
Figure 4.
Microsolvated phenol (PhOH) and phenolate (PhO−) structures.
Table 1.
ΔVIEs (eV) of microsolvated phenol and phenolate computed using the EOM/EFP and full EOM-IP-CCSD with the 6-31+G(d) basis set. Error in ΔVIE, i.e., ΔVIE(EOM/EFP)−ΔVIE(EOM) is tabulated.
| System | Full IP-CCSD | IP-CCSD/EFP | Error in ΔVIE |
|---|---|---|---|
| Phenol(H2O) (PH1) | −0.53 | −0.55 | −0.02 |
| Phenol(H2O)2 (PH2) | −0.07 | −0.10 | −0.03 |
| Phenol(H2O)3 (PH3) | −0.24 | −0.29 | −0.05 |
| Phenol(H2O)4 (PH4) | −0.23 | −0.26 | −0.03 |
| Phenolate(H2O) (P1) | +0.63 | +0.60 | −0.03 |
| Phenolate(H2O)2 (P2) | +1.16 | +1.13 | −0.03 |
| Phenolate(H2O)3 (P3) | +1.57 | +1.61 | +0.04 |
| Phenolate(H2O)4 (P4) | +1.95 | +1.99 | +0.04 |
As in our previous studies on thymine,22 the errors in IEs due to EFP approximation are less than 0.05 eV for the microsolvated phenol structures and 0.04 eV for microsolvated phenolate. Moreover, the correct ordering of the IEs in the different structures is preserved in the EFP calculations. Another important point is that the errors in EOM/EFP VIEs remain almost constant when going from one to four water molecules, which is expected because the polarization of the solvent is included in the EFP scheme. However, one may anticipate slightly larger errors in bulk. In particular, fully self-consistent treatment of solvent response may account for about 10% of the solvent-induced shift,62 whereas perturbative correction may not be able to fully recover this value.
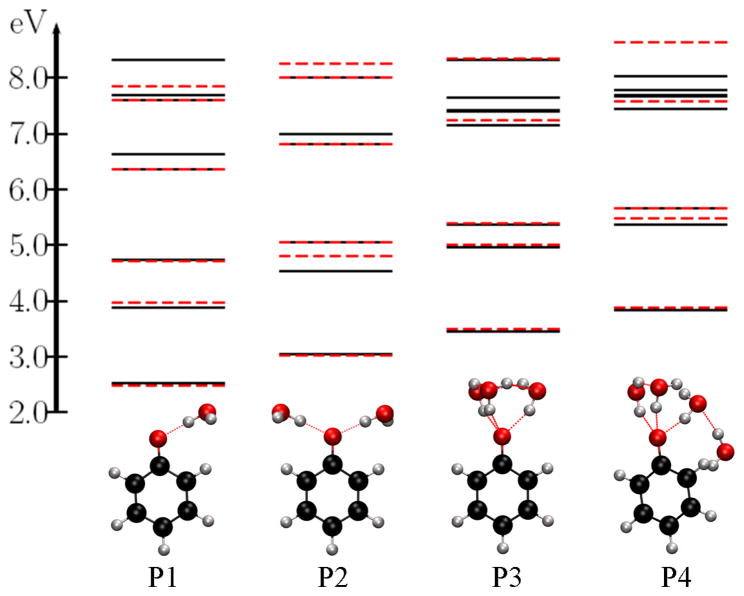
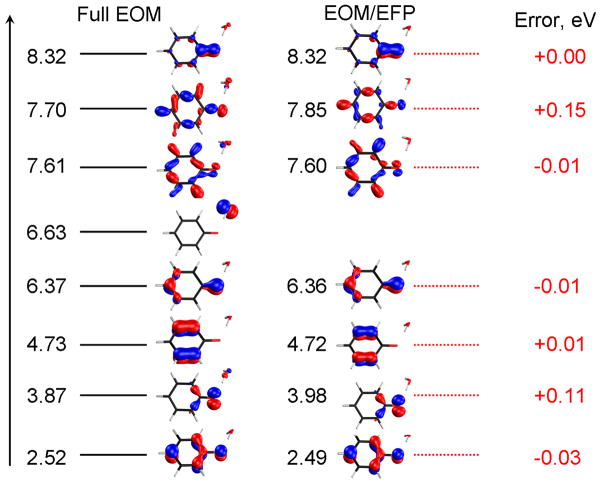
Fig. 5 presents several lowest VIEs for the P1, P2, P3, and P4 structures. We note that the lowest 3 VIEs are accurately determined by the EOM/EFP calculations. However, as we consider higher VIEs, the errors increase (≈0.15–0.3 eV) and there are few VIEs that are missing with EOM/EFP as compared to the full EOM calculations. This is because higher ionized states can be delocalized over the phenolate and water moieties (causing large errors) or even fully localized on water (causing missing IEs when the QM part consists only of phenolate). This is illustrated in Fig. 6, which shows the leading MOs describing the ionized states in the P1 structure. The missing IE (6.63 eV) has a leading contribution from the MO located on water.
Figure 5.
The lowest VIEs (eV) of microsolvated phenolate structures. The black lines mark the VIEs calculated by full EOM-IP-CCSD and the red dashed lines denote the values calculated by EOM/EFP.
Figure 6.
The MOs with leading amplitude (>0.9) from which ionization occurs from the full EOM and EOM/EFP calculations for the P1 structure.
Somewhat surprisingly, the second ionized state (of P1) at 3.87 eV has some electron density on water and, therefore, exhibits the relatively large error (+0.11 eV). The ionized states at 7.61 eV and 7.70 eV also have some electron density on water and therefore, error of 0.15 eV for one state. We performed similar analysis for microsolvated phenol (included in SM). In this case, there were no large differences for the states below 11.0 eV (or for the 2 lowest states).
Comparing the IEs of the P1, P2, P3, P4 structures we observe that there are 1,2,3 and 4 IEs (above 6.5 eV – 7.0 eV) that are missing in the EOM/EFP calculation (see Fig. 5) and the MOs from which these IEs occur are located on the water molecules (included in SM).
In sum, the applicability of the present EOM/EFP setup is limited to the ionized states that lie below the lowest IE of water. Such low-lying ionized states of water are only relevant for small clusters as they correspond to well-known surface-ionized states. In bulk solvent, the ionization of water is much higher. Thus, when considering bulk solvation, we anticipate the breakdown of the present QM/EFP scheme only around 11 eV (bulk water ionization54, 94, 95).
Tables 2 and 3 show the effect of basis set on ΔVIE of microsolvated phenol and phenolate and ΔVAE for the respective radicals. We observe that ΔVIEs for all microsolvated phenol and phenolate clusters are remarkably independent of the basis set used (errors in ΔVIE due to basis sets are < 0.03 eV). We will exploit this fact to perform EOM/EFP calculations of ΔVIE with a smaller basis set, 6-31+G(d), to reduce computational time and enable extensive sampling. However, the absolute values of VIEs (and VEAs) do depend on the basis set used and, therefore, a correction (in the spirit of energy additivity schemes) needs to be added to the absolute values to account for the effect of increasing basis set from 6-31+G(d) to cc-pVTZ, as was done in our study of solvated thymine.22
Table 2.
The effect of basis set on solvent-induced shifts, ΔVIEs (eV), in microsolvated phenol and phenolate. ΔVIEs are computed using full EOM-IP-CCSD with the 6-31+D(d) and cc-pVTZ basis set.
| System | VIE 6-31+G(d) |
VIE cc-pVTZ |
ΔVIE 6-31+g(d) |
ΔVIE cc-pVTZ |
ΔΔVIE |
|---|---|---|---|---|---|
|
| |||||
| Phenol | 8.35 | 8.55 | - | - | - |
| Phenol(H2O) (PH1) | 7.82 | 8.02 | −0.53 | −0.53 | 0.00 |
| Phenol(H2O)2 (PH2) | 8.28 | 8.45 | −0.07 | −0.10 | 0.03 |
|
| |||||
| Phenolate | 1.89 | 1.99 | - | - | - |
| Phenolate(H2O) (P1) | 2.52 | 2.63 | 0.63 | 0.64 | 0.01 |
| Phenolate(H2O)2 (P2) | 3.05 | 3.11 | 1.16 | 1.12 | 0.03 |
Table 3.
The effect of basis set on solvent-induced shifts, ΔVEAs (eV), in microsolvated phenol cation and phenoxyl radical. ΔVEAs are computed using full EOM-IP-CCSD with the 6-31+D(d) and cc-pVTZ basis sets.
| System | VEA 6-31+G(d) |
VEA cc-pVTZ |
ΔVEA 6-31+g(d) |
ΔVEA cc-pVTZ |
ΔΔVEA |
|---|---|---|---|---|---|
|
| |||||
| Phenol+ | 7.89 | 8.10 | - | - | - |
| Phenol+(H2O) (PH1+) | 7.23 | 7.43 | −0.66 | −0.67 | 0.01 |
| Phenol+(H2O)2 (PH2+) | 6.82 | 6.96 | −1.07 | −1.10 | 0.03 |
|
| |||||
| Phenoxyl | 1.71 | 1.82 | - | - | - |
| Phenoxyl(H2O) (PR1) | 1.94 | 2.07 | 0.23 | 0.25 | −0.02 |
| Phenoxyl(H2O)2 (PR2) | 2.22 | 2.31 | 0.51 | 0.49 | 0.03 |
Our theoretical VIEs for the microsolvated structures are in good agreement with experiment. For PH1 structure, the experimental IEs are 7.95–8.3 eV,96–98 compared to our estimate of 8.02 eV. We also recover the experimental trend that with hydrogen bonded phenol complexes, the first water (or other solvents such as methanol) causes a large reduction in VIE (−0.53 eV), while the addition of the second water recovers most of the VIE back (−0.10 eV). This can be explained from the specific interactions in Fig. 4(a and b). In PH1 there is a single electron donating H-bond with the water causing lowering of VIE, while in PH2 there are two H-bonds of different nature which have opposing effects on the VIE. In the case of the microsolvated phenolate, with the addition of each water molecule the IEs increase due to greater charge distribution and therefore, stabilization of the anionic species. The H-bonds thus formed are all electron accepting in nature.
3.2 VIEs of phenol and phenolate in bulk water
The bulk VIE was calculated by averaging instantaneous VIEs over 100 snapshots obtained from the 150 ps trajectory at 300 K. All water molecules present in the simulation box are included in the EOM/EFP calculations. The 35 Å spherical box is considered to be large enough to mimic bulk solvation as established in the previous calculations of solutes in water.22, 78
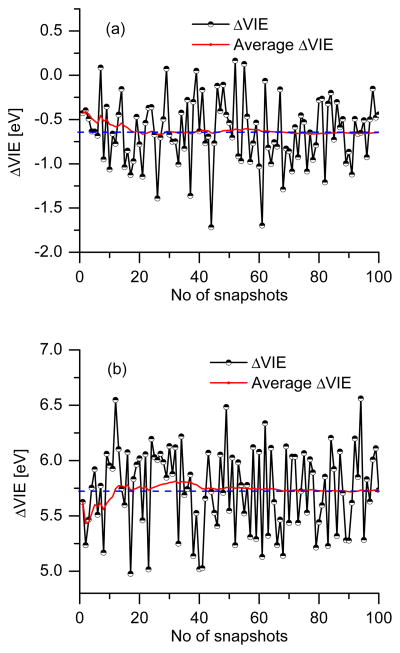
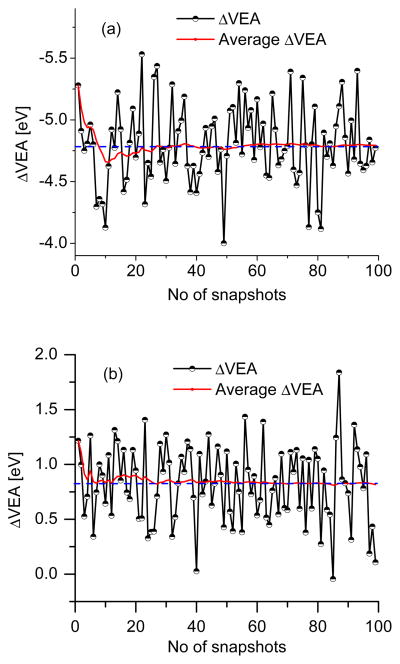
Fig. 7 shows ΔVIEs for the phenol and phenolate computed using 100 configurations from the MD snapshots of each of the simulations (the respective ΔVEA of oxidized species that are necessary for free energy calculations are shown in Fig. 8). The average ΔVIE converges around 30 snapshots. The converged 〈ΔVIE〉Red values (i.e., shifts in VIE averaged over neutral phenol/phenolate surfaces) are −0.66 eV and +5.72 eV for phenol and phenolate in bulk water. The computed absolute VIEs for the phenol and the phenolate in the gas-phase are 8.55 and 1.99 eV, respectively. Therefore, the VIEs of the phenol and phenolate in bulk solvent is 7.89 and 7.71 eV, which, as will be discussed below, is in good agreement, particularly for phenol, with the experimental values.
Figure 7.
Convergence of ΔVIE (eV) of (a) phenol and (b) phenolate in bulk water. ΔVIE represents the instantaneous values of the snapshots while average ΔVIE is a running average.
Figure 8.
Convergence of ΔVEA (eV) of (a) phenol radical cation and (b) phenoxyl radical using snapshots from MD simulations in bulk water.
Finally, we would like to point out that, as in our previous study of thymine,22 we observe that the effect of solvation on the IEs cannot be accurately modeled by a simple point-charge model, and that solvent polarization effects are important. The breakdown of different EFP contributions shows that the polarization reduces the VIEs by ≈ 0.65 eV and ≈ 0.75 eV in phenol and phenolate, respectively.
3.2.1 Experimental VIEs
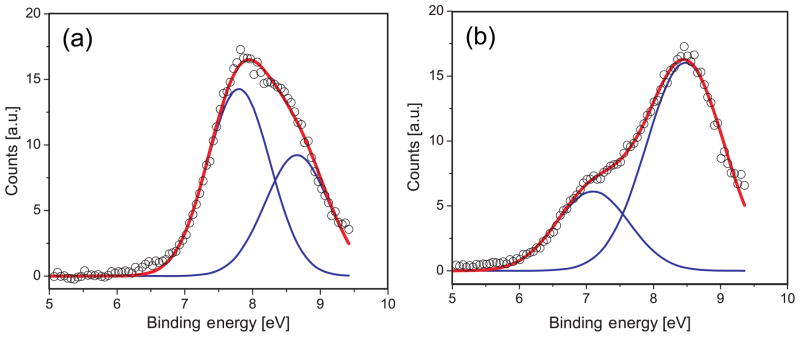
Fig. 9 shows differential valence photoelectron spectra from 0.75 M phenol and phenolate aqueous solutions, acquired by subtracting the water spectrum from the raw phenol/phenolate (aq) spectra (not shown here). All spectra were recorded under identical experimental conditions at photon energy of 200 eV. Both spectra can be fitted with two Gaussians, centered at 7.1 ± 0.1 and 8.5 ± 0.1 eV for phenolate and 7.8 ± 0.1 eV and 8.6 ± 0.1 eV for phenol with an average full width at half maximum of ~ 1 eV for each peak. The peak width is typical of aqueous solutes.80, 84, 99 Higher precision energies and widths are difficult to assign due to the broad and overlapping spectral features. We note that the intensity of the higher binding energy photoelectron peak for phenolate is more than twice that of the lowest; however, for phenol, the opposite trend appears evident.
Figure 9.
Experimental valence photoelectron spectra of (a) 0.75 M phenol and (b) 0.75 M phenolate aqueous solutions. The experimental spectra (open circles) are decomposed into two Gaussians (blue) with the composite fit shown in red.
3.2.2 Theory versus experiment
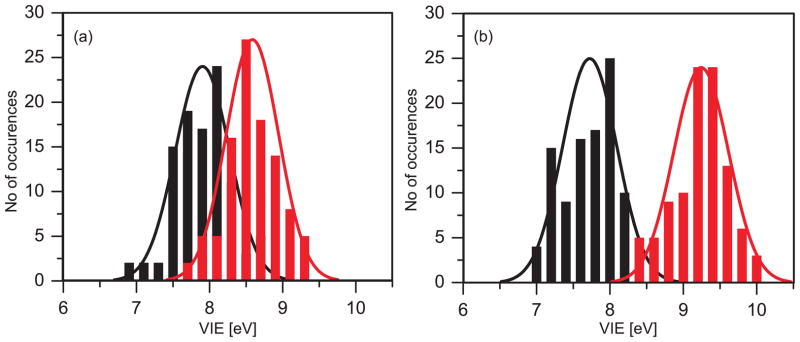
To compare simulations with the experimental spectra that show two distinct bands, we computed VIEs for the two lowest ionized states of phenol and phenolate, respectively. Assuming the same cross sections for the two ionization transitions, the distribution of the instantaneous ΔVIEs (plus the gas-phase VIEs values) represent the spectra. Fig. 10 shows the computed lineshapes corresponding to the two states.
Figure 10.
Simulated spectral line shapes corresponding to the two lowest ionized states of (a) phenol and (b) phenolate in water. Vertical dashed lines denote average values, 〈VIE〉Red. Solid lines represent Gaussian fits.
The simulated distributions cannot be well fitted to a Gaussian line shape. We note that the distributions of energy fluctuations along the ground-state equilibrium trajectories are Gaussian (see SM); thus, although our sampling in IE calculations is sufficient for converged average VIE, it may be inadequate for predicting the spectral line shape.
As the experimental spectra show, the relative intensity of the two bands are different suggesting different cross sections (although, in the case of phenolate, higher intensity of the 2nd peak might be due to other ionized states accessible in this energy range).
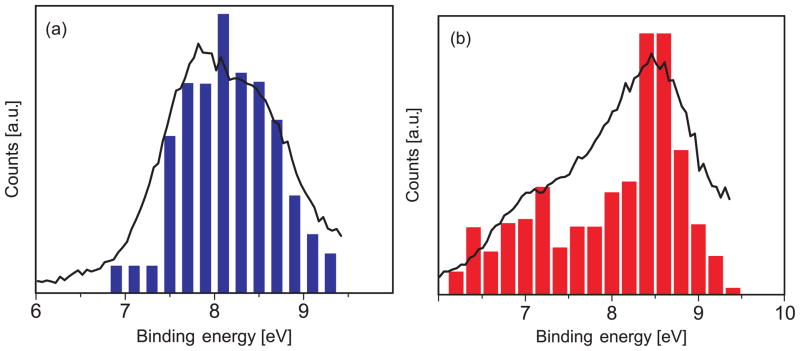
To directly compare with the experiment, we scaled the second peak in the distributions by 0.65 and 2.63 for phenol and phenolate, respectively, and then add the two distribution together. Our preliminary calculations of the respective cross sections using EOM-IP Dyson orbitals100 and plane-wave description of the ejected electron101 using ezDyson102 indeed show that the cross section for the second peak in phenolate is 1.5 times larger than that of the first peak. In case of the phenol, we see very similar cross sections for the first 2 ionizations (the cross section of the second peak being slightly smaller), which is in accordance with the experimentally observed peak heights.
In the case of the phenolate, the theoretical spectrum has been red-shifted by 0.8 eV to match the position of the first experimental peak. We note that this shift is slightly larger than the discrepancy between average VIE of the first peak (7.7 eV) and the experimental maximum (7.1 eV). The resulting theoretical spectra and experimental spectra are shown in Fig. 11.
Figure 11.
Simulated and experimental photoelectron spectra of a) phenol and b) phenolate in water (see text). The computed phenolate spectrum is red-shifted by 0.8 eV.
In case of bulk solvated phenol, there is considerable overlap between the 1st and 2nd lowest VIEs (from 7.5 to 9.0 eV) with the mean VIEs at 7.9 eV and 8.6 eV respectively. For solvated phenolate, there is much less overlap between the distributions of 1st and 2nd lowest VIEs (from 8.3 to 8.6 eV). The mean VIEs are more spaced out at 7.75 eV and 9.25 eV, respectively.
Comparison between experiment and theory shows that for phenol, there is a very good agreement in the ionization onset, band maxima, and peak widths. In the case of phenolate, the spectrum needs to be shifted by about 0.8 eV to agree with experiment (the discrepancy between the converged average VIE and the experimental maximum is 0.6 eV). However, the splitting between the first two VIEs and the overall shape is reproduced well (see Fig. 11). The reason for the discrepancy between the experimental and theoretical value of the 1st VIE for phenolate is not entirely clear. It may be due to the greater difficulties of modeling charged species. For example, our equilibrium sampling performed using classical MD might be of a lower quality than the same sampling for phenolate. Moreover, EFP might have larger errors in polarization contribution, which is treated perturbatively. Although the errors in EOM-EFP versus full EOM calculations for microsolvated phenolate are much smaller than the discrepancy between the theory and experiment for VIE in solution, the errors in VIEs of bulk solvated species might be larger because of increasing contribution of polarization in the bulk. Based on the benchmark study of Kongsted and co-workers, the solvent polarization response accounts for ~10% of the shift. Thus, one may expect a larger absolute value of polarization response for phenolate that has much larger solvent shift (5.72 eV). Therefore, errors due to perturbative account of solvent polarization contribution in EFP may be larger for bulk-solvated anionic species. Another source of discrepancy between the theoretical and experimental phenolate spectrum might be due to the effect of sodium counterion. However, in our recent study on sodium phosphate salts we find that sodiation on phosphates leads only to small changes of less than 0.15 eV for the VIE.103 We expect similar or smaller changes due to counterions for the phenolate. What is even more puzzling is that the computed redox potential for phenolate (Section 3.3) is in excellent agreement with the experimental value.
3.3 Redox potential of phenolate
Fig. 2 and Eq. (11) illustrate the connection between the ΔG of a redox reaction and ensemble-averaged VIE and VEA. Within the LRA, the redox potential of phenolate (or phenol) can be calculated by ensemble-averaging of the VIEs and VEAs over the reduced and oxidized states, respectively.
Figs. 7 and 8 show the deviation of VIE of phenolate and phenol when ensemble-averaged over the reduced (PhO−) and the negative deviation of VEA averaged over the oxidized (PhO·) state.
The snapshots from the MD simulations carried out for the reduced (PhO−) and oxidized (PhO·) were used for the VIE and VEA calculations. The MD simulations in the reduced and oxidized states differ in the charge distributions and therefore, in the dynamics. The average VEA and VIE in the oxidized and the reduced states of phenolate are 2.64 and 7.71 eV, respectively. Therefore, the free energy difference for the process PhO−(aq) → PhO·(aq) + e− within LRA (obtained from the assumption that the Marcus parabolas have similar curvature) is:
| (14) |
Since ΔG for the SHE is 4.28 eV,104, 105 the ΔG for the cell is:
| (15) |
is −0.89 V, and thus redox potential is 0.89 V. This value is in a remarkably good agreement with the experimental reduction potential of the phenolate (0.83–0.86 V).25–27
By performing similar analysis with the average values from Figs. 7 and 8, our calculated is 1.32 V. This is in good agreement with the experimental value of the phenol reduction potential (1.0–1.5 V).40–42 It should be kept in mind that the experimental electrochemistry of phenol is complicated by irreversible processes.29, 30 The causes the large range of experimentally observed standard redox potential for phenol as also the use of anisole species in the experiments.
Several calculations of redox potentials of phenolate and substituted phenolates using continuum models have been reported previously.9, 106 The continuum models were able to reproduce the experimental redox potential for phenolate with 0.1–0.5 V accuracy depending on the parameters and types of models employed.9, 106 The most important advantage of using EFP is that it is rigorously non-empirical approach allowing one to calculate the redox potentials from first principles. EFP describes the solvent as discrete entities, with accurate Coulomb and polarization interactions, and captures the effect of individual H-bonds. Furthermore, the components of the interaction can be analyzed and reorganization energy can be estimated.
3.4 Reorganization energy
Solvent reorganization energy is one of the key ideas behind Marcus theory of electron transfer and LRA. In Fig. 2 the reorganization energy is denoted by λOx and λRed. λOx denotes the reorganization energy in the oxidized potential, i.e., when a system in its reduced state is ionized and then relaxes to the minima in the oxidized state. λRed denotes the reorganization energy in the reduced potential, i.e., when a system in its oxidized state is reduced (electron attachment process) and then relaxes to the minima in the reduced state. Within the assumptions in LRA, λOx = λRed and from Fig. 2 it can be seen that:
| (16) |
Therefore, the simulated reorganization energies for solvated phenol and phenolate are 2.29 eV and 2.54 eV respectively. The spectral width can be calculated using:107–109
| (17) |
From this relationship the simulated full width at half maximum would be 0.81 eV for phenol and 0.85 eV for phenolate. This is in reasonable agreement with the experimental FWHM of 0.9±0.1 and 1.1±0.1 eV for phenol and phenolate, respectively. The width of the actual simulated spectrum also agrees well with the experiment, as illustrated in Fig. 11. However, the discrepancy between the experimental and simulated peak widths appear to be larger for the second detachment band of phenolate. Although the theoretical peak shape can be improved by further sampling, in previous studies it has been noted that the experimental photoemission peak width is generally a little larger than the expectation based on Eq. (17).108, 109 The additional width can be due to other inhomogeneous broadening effects110 beyond just the distribution of solvent configurations around the solute. For phenolate, the distribution of locations of the sodium counter-ion, for example, may play a role. However, Fig. 11 indicates that the major cause for the peak broadening is captured by the theoretical approach employed here.
It should also be mentioned that λ is a more demanding test for the methodology than ΔG since λ is the difference between energies in an equilibrium state and a non-equilibrium state while ΔG is an equilibrium property. Thus, this analysis helps us in assessing more rigorously the validity of LRA approximation in this system.111
4 Conclusions
We developed and validated a computational protocol for calculating physically relevant properties such as redox potential using QM/EFP method and LRA. To benchmark the QM/EFP scheme against the full QM approach for neutral and charged systems, we investigated the effect of microsolvation on IEs of phenol and phenolate. EOM/EFP agrees well with the full EOM-IP-CCSD calculations for VIEs below the lowest VIE of solvent molecules (11–13 eV for various water clusters52–54, 94, 95). For the lowest ionized states, the errors are below 0.02 eV for neutral phenol and below 0.05 eV for phenolate. This difference in accuracy for neutral and negatively charged species has been rationalized based on the higher polarizability and more delocalized charge density in case of negatively charged species. We also notice that the error in VIE does not increase with the number of water molecules in the microsolvated species.
The VIEs for the bulk solvated phenol and phenolate were calculated by averaging over the snapshots from equilibrium MD simulations with spherical boundary conditions. The computed VIEs corresponding to the lowest ionized states of phenol and phenolate are 7.9 and 7.7 for phenol and phenolate, respectively. These values agree well with the experimentally measured VIEs (7.8±0.1 eV and 7.1±0.1 eV, respectively). There is no obvious reason for larger discrepancy between theory and experiment in the case of phenolate. Possible explanations are problems with using MD for equilibrium sampling of anionic species, larger errors in EFP due to approximate treatment of polarization, or perturbation due to counter-ions.
In LRA, the redox potential is the average of the VIEs calculated as an ensemble average of the initial and final states, i.e., over the reduced (PhO− and PhOH) and the oxidized (PhO· and PhOH+) species. Using this formalism, we performed MD simulations of the species in the different oxidation states, and using the snapshots from the respective MD simulations, we computed ensemble-averaged VIEs/VEAs. The computed standard reduction potentials for phenol and phenolate are 1.32 V and 0.89 V, respectively; they are in good agreement with the experimental values (1.0–1.5 V and 0.83–0.86 V).
Supplementary Material
Acknowledgments
This work was supported by an NIH-SBIR grant with Q-Chem, Inc. (A.I.K.). A.I.K. and S.E.B. acknowledge support from the National Science Foundation through CHE-0951634 and CHE-0617060/CHE-0957869 grants, respectively. R.S. and B.W. thank the BESSY sta3 for assistance and B.W. acknowledges support from the DFG (project WI 1327/3-1). We thank Ms. Anastasia Gunina for her help with Dyson orbital and cross section calculations. A.I.K. is supported by the Humboldt Research Foundation (Bessel Award).
Footnotes
Supporting information is available free of charge via the Internet at http://pubs.acs.org.
References
- 1.Leopoldini M, Marino T, Russo N, Toscano M. J Phys Chem A. 2004;108:4916. [Google Scholar]
- 2.Kalyanasundaram K, Neumann-Spallart M. J Phys Chem. 1982;86:5163. [Google Scholar]
- 3.Bao D, Ramu S, Contreras A, Upadhyayula S, Vasquez JM, Beran G, Vullev VI. J Phys Chem B. 2010;114:14467. doi: 10.1021/jp101730e. [DOI] [PubMed] [Google Scholar]
- 4.Meyer AJ, Dick TP. Antioxidands and Redox Signaling. 2010;13:621. doi: 10.1089/ars.2009.2948. [DOI] [PubMed] [Google Scholar]
- 5.Solntsev KM, Ghosh D, Amador A, Josowicz M, Krylov AI. J Phys Chem Lett. 2011;2:2593. [Google Scholar]
- 6.Christenson A, Dimcheva N, Ferapontova EE, Gorton L, Ruzgas T, Stoica L, Shleev S, Yaropolov AI, Haltrich D, Thorneley RNF, Austf SD. Electroanalysis. 2004;16:1074. [Google Scholar]
- 7.Note that it is only the relative redox potential, rather than the absolute values, that can be unambiguously determined experimentally, as the experimental values of the working electrode are always referred to the potential of a reference electrode and depend on the unknown liquid junction potential between the reference electrode and the solution measured.
- 8.Konecny R, Li J, Fisher CL, Dillet V, Bashford D, Noodleman L. Inorg Chem. 1999;38:940. doi: 10.1021/ic980730w. [DOI] [PubMed] [Google Scholar]
- 9.Winget P, Cramer CJ, Truhlar DG. Theor Chem Acc. 2004;112:217. [Google Scholar]
- 10.Dutton AS, Fukuto JM, Houk KN. Inorg Chem. 2005;44:4024. doi: 10.1021/ic048734q. [DOI] [PubMed] [Google Scholar]
- 11.Sviatenko L, Isayev O, Gorb L, Hill F, Lezczynski J. J Comput Chem. 2011;32:2195. doi: 10.1002/jcc.21803. [DOI] [PubMed] [Google Scholar]
- 12.Cramer CJ, Truhlar DG. Chem Rev. 1999;99:2161. doi: 10.1021/cr960149m. [DOI] [PubMed] [Google Scholar]
- 13.Lange AW, Herbert JM. J Phys Chem Lett. 2009;1:556. [Google Scholar]
- 14.Tomasi J, Mennucci B, Cammi R. Chem Rev. 2005;105:2999. doi: 10.1021/cr9904009. [DOI] [PubMed] [Google Scholar]
- 15.Cossi M, Rega N, Scalmani G, Barone V. J Comput Chem. 2003;24:669. doi: 10.1002/jcc.10189. [DOI] [PubMed] [Google Scholar]
- 16.Marenich AV, Cramer CJ, Truhlar DG. J Phys Chem B. 2009;113:6378. doi: 10.1021/jp810292n. [DOI] [PubMed] [Google Scholar]
- 17.Jagoda-Cwiklik B, Slaviček P, Cwiklik L, Nolting D, Winter B, Jungwirth P. J Phys Chem A. 2008;112:3499. doi: 10.1021/jp711476g. [DOI] [PubMed] [Google Scholar]
- 18.Gordon MS, Freitag MA, Bandyopadhyay P, Jensen JH, Kairys V, Stevens WJ. J Phys Chem A. 2001;105:293. [Google Scholar]
- 19.Gordon MS, Slipchenko L, Li H, Jensen JH. Annual Reports in Computational Chemistry. In: Spellmeyer DC, Wheeler R, editors. Annual Reports in Computational Chemistry. Vol. 3. Elsevier; 2007. p. 177. [Google Scholar]
- 20.Ghosh D, Kosenkov D, Vanovschi V, Williams C, Herbert J, Gordon MS, Schmidt M, Slipchenko LV, Krylov AI. J Phys Chem A. 2010;114:12739. doi: 10.1021/jp107557p. [DOI] [PMC free article] [PubMed] [Google Scholar]
- 21.Slipchenko LV. J Phys Chem A. 2010;114:8824. doi: 10.1021/jp101797a. [DOI] [PubMed] [Google Scholar]
- 22.Ghosh D, Isayev O, Slipchenko LV, Krylov AI. J Phys Chem A. 2011;115:6028. doi: 10.1021/jp110438c. [DOI] [PMC free article] [PubMed] [Google Scholar]
- 23.Marcus RA. J Chem Phys. 1956;24:966. [Google Scholar]
- 24.Marcus RA. Annu Rev Phys Chem. 1964;15:155. [Google Scholar]
- 25.Lind J, Shen X, Eriksen TE, Merényi G. J Am Chem Soc. 1990;112:479. [Google Scholar]
- 26.Li C, Hoffman MZ. J Phys Chem B. 1999;103:6653. [Google Scholar]
- 27.Costentin C, Louault C, Savéant J-M. Proc Nat Acad Sci. 2009;106:18143. doi: 10.1073/pnas.0910065106. [DOI] [PMC free article] [PubMed] [Google Scholar]
- 28.Rodgers JD, Jedral W, Bunce NJ. Environ Sci Technol. 1999;33:1453. [Google Scholar]
- 29.Richards JA, Whitson PE, Evans DH. J Electroanal Chem. 1975;63:311. [Google Scholar]
- 30.Evans DH, Jimenez PJ, Kelly MJ. J Electroanal Chem. 1984;163:145. [Google Scholar]
- 31.Dempsey JL, Winkler JR, Gray HB. Chem Rev. 2010;110:7024. doi: 10.1021/cr100182b. [DOI] [PMC free article] [PubMed] [Google Scholar]
- 32.Bravaya K, Grigorenko BL, Nemukhin AV, Krylov AI. Acc Chem Res. 2012 doi: 10.1021/ar2001556. in press. [DOI] [PubMed] [Google Scholar]
- 33.Bravaya K, Khrenova MG, Grigorenko BL, Nemukhin AV, Krylov AI. J Phys Chem B. 2011;8:8296. doi: 10.1021/jp2020269. [DOI] [PubMed] [Google Scholar]
- 34.Vengris M, van Stokkum IHM, He X, Bell AF, Tonge P, van Grondelle R, Larsen DS. J Phys Chem A. 2004;108:4587. [Google Scholar]
- 35.Solntsev KM, Poizat O, Dong J, Rehault J, Lou Y, Burda C, Tolbert LM. J Phys Chem B. 2008;112:2700. doi: 10.1021/jp077707t. [DOI] [PubMed] [Google Scholar]
- 36.Winkler K, Lindner J, Subramaniam V, Jovin TM. Phys Chem Chem Phys. 2002;4:1072. [Google Scholar]
- 37.Hanson GT, Aggeler R, Oglesbee D, Cannon M, Capaldi RA, Tsien RY, Remington SJ. J of Biol Chem. 2004;279:13044. doi: 10.1074/jbc.M312846200. [DOI] [PubMed] [Google Scholar]
- 38.Dooley CT, Dore TM, Hanson GT, Jakson WC, Remington SG, Tsien RY. J of Biol Chem. 2004;279:2284. doi: 10.1074/jbc.M312847200. [DOI] [PubMed] [Google Scholar]
- 39.Inouye S, Tsuji FI. FEBS Lett. 1994;351:211. doi: 10.1016/0014-5793(94)00859-0. [DOI] [PubMed] [Google Scholar]
- 40.Jonsson M, Lind J, Reitberger T, Eriksen TE. J Phys Chem. 1993;97:11278. [Google Scholar]
- 41.Jovanovic SV, Tosic M, Simic MG. J Phys Chem. 1991;95:10824. [Google Scholar]
- 42.Xu F. Biochemistry. 1996;35:7608. doi: 10.1021/bi952971a. [DOI] [PubMed] [Google Scholar]
- 43.Strajbl M, Hong G, Warshel A. J Phys Chem B. 2002;106:13333. [Google Scholar]
- 44.Senn HM, Thiel W. Angew Chem Int Ed Engl. 2009;48:1198. doi: 10.1002/anie.200802019. [DOI] [PubMed] [Google Scholar]
- 45.Sinha D, Mukhopadhyay D, Mukherjee D. Chem Phys Lett. 1986;129:369. [Google Scholar]
- 46.Pal S, Rittby M, Bartlett RJ, Sinha D, Mukherjee D. Chem Phys Lett. 1987;137:273. [Google Scholar]
- 47.Stanton JF, Gauss J. J Chem Phys. 1994;101:8938. [Google Scholar]
- 48.Pieniazek PA, Arnstein SA, Bradforth SE, Krylov AI, Sherrill CD. J Chem Phys. 2007;127:164110. doi: 10.1063/1.2795709. [DOI] [PubMed] [Google Scholar]
- 49.Pieniazek PA, Bradforth SE, Krylov AI. J Chem Phys. 2008;129:074104. doi: 10.1063/1.2969107. [DOI] [PubMed] [Google Scholar]
- 50.Krylov AI. Annu Rev Phys Chem. 2008;59:433. doi: 10.1146/annurev.physchem.59.032607.093602. [DOI] [PubMed] [Google Scholar]
- 51.Pieniazek PA, Krylov AI, Bradforth SE. J Chem Phys. 2007;127:044317. doi: 10.1063/1.2749506. [DOI] [PubMed] [Google Scholar]
- 52.Pieniazek PA, VandeVondele J, Jungwirth P, Krylov AI, Bradforth SE. J Phys Chem A. 2008;112:6159. doi: 10.1021/jp802140c. [DOI] [PubMed] [Google Scholar]
- 53.Pieniazek PA, Sundstrom EJ, Bradforth SE, Krylov AI. J Phys Chem A. 2009;113:4423. doi: 10.1021/jp811059z. [DOI] [PubMed] [Google Scholar]
- 54.Kamarchik E, Kostko O, Bowman JM, Ahmed M, Krylov AI. J Chem Phys. 2010;132:194311. doi: 10.1063/1.3432198. [DOI] [PubMed] [Google Scholar]
- 55.Golubeva AA, Krylov AI. Phys Chem Chem Phys. 2009;11:1303. doi: 10.1039/b817284f. [DOI] [PubMed] [Google Scholar]
- 56.Zadorozhnaya AA, Krylov AI. J Chem Theory Comput. 2010;6:705. doi: 10.1021/ct900515a. [DOI] [PubMed] [Google Scholar]
- 57.Zadorozhnaya AA, Krylov AI. J Phys Chem A. 2010;114:2001. doi: 10.1021/jp910440d. [DOI] [PubMed] [Google Scholar]
- 58.Bravaya KB, Kostko O, Ahmed M, Krylov AI. Phys Chem Chem Phys. 2010;12:2292. doi: 10.1039/b919930f. [DOI] [PubMed] [Google Scholar]
- 59.Kostko O, Bravaya KB, Krylov AI, Ahmed M. Phys Chem Chem Phys. 2010;12:2860. doi: 10.1039/b921498d. [DOI] [PubMed] [Google Scholar]
- 60.Stone AJ. Chem Phys Lett. 1981;83:233. [Google Scholar]
- 61.Stone AJ, Alderton M. Mol Phys. 1985;56:1047. [Google Scholar]
- 62.Sneskov K, Schwabe T, Christiansen O, Kongsted J. Phys Chem Chem Phys. 2011;13:18551. doi: 10.1039/c1cp22067e. [DOI] [PubMed] [Google Scholar]
- 63.Sneskov K, Schwabe T, Kongsted J, Christianse O. J Chem Phys. 2011;134:104108. doi: 10.1063/1.3560034. [DOI] [PubMed] [Google Scholar]
- 64.Chipot C, Pohorille A. Free energy calculations: theory and applications in chemistry and biology. Springer; 2007. p. 2. [Google Scholar]
- 65.Simonson T. Free energy calculations: theory and applications in chemistry and biology. Springer; 2007. p. 12. [Google Scholar]
- 66.Zwanzig RW. J Chem Phys. 1954;22:1420. [Google Scholar]
- 67.Sham YY, Chu ZT, Tao H, Warshel A. Proteins: Structure, Function and Genetics. 2000;39:393. [PubMed] [Google Scholar]
- 68.King G, Warshel A. J Chem Phys. 1990;93:8682. [Google Scholar]
- 69.Eberson L, Gonzáles-Luque R, Lorentzon J, Merchán M, Roos BO. J Am Chem Soc. 1993;115:2898. [Google Scholar]
- 70.Åqvist J, Hansson T. J Phys Chem. 1996;100:9512. [Google Scholar]
- 71.Bragg AE, Cavanagh MC, Schwartz BJ. Science. 2008;321:1817. doi: 10.1126/science.1161511. [DOI] [PubMed] [Google Scholar]
- 72.Darden T, Pearlman D, Pedersen LG. J Chem Phys. 1998;109:10921. [Google Scholar]
- 73.Carlsson J, Åqvist J. J Phys Chem B. 2009;113:10255. doi: 10.1021/jp900818z. [DOI] [PubMed] [Google Scholar]
- 74.Florian J, Warshel A. J Phys, Chem B. 1997;101:5583. [Google Scholar]
- 75.Warshel A, Papazyan A. Curr Op Struct Bio. 1998;8:211. doi: 10.1016/s0959-440x(98)80041-9. [DOI] [PubMed] [Google Scholar]
- 76.Lee FS, Chu ZT, Warshel A. J Comp Chem. 1993;14:161. [Google Scholar]
- 77.Shao Y, Molnar LF, Jung Y, Kussmann J, Ochsenfeld C, Brown S, Gilbert ATB, Slipchenko LV, Levchenko SV, O’Neil DP, Distasio RA, Jr, Lochan RC, Wang T, Beran GJO, Besley NA, Herbert JM, Lin CY, Van Voorhis T, Chien SH, Sodt A, Steele RP, Rassolov VA, Maslen P, Korambath PP, Adamson RD, Austin B, Baker J, Bird EFC, Daschel H, Doerksen RJ, Dreuw A, Dunietz BD, Dutoi AD, Furlani TR, Gwaltney SR, Heyden A, Hirata S, Hsu C-P, Kedziora GS, Khalliulin RZ, Klunziger P, Lee AM, Liang WZ, Lotan I, Nair N, Peters B, Proynov EI, Pieniazek PA, Rhee YM, Ritchie J, Rosta E, Sherrill CD, Simmonett AC, Subotnik JE, Woodcock HL, III, Zhang W, Bell AT, Chakraborty AK, Chipman DM, Keil FJ, Warshel A, Herhe WJ, Schaefer HF, III, Kong J, Krylov AI, Gill PMW, Head-Gordon M. Phys Chem Chem Phys. 2006;8:3172. doi: 10.1039/b517914a. [DOI] [PubMed] [Google Scholar]
- 78.Bradforth SE, Jungwirth P. J Phys Chem A. 2002;106:1286. [Google Scholar]
- 79.Winter B. Nuclear Instruments and Methods in Physics Research Section a-Accelerators Spectrometers Detectors and Associated Equipment. 2009;601:139. doi: 10.1016/j.nima.2009.05.032. [DOI] [PMC free article] [PubMed] [Google Scholar]
- 80.Winter B, Faubel M. Chem Rev. 2006;106:1176. doi: 10.1021/cr040381p. [DOI] [PubMed] [Google Scholar]
- 81.Faubel M, Schlemmer S, Tonnies JP. Z Phys D. 1988;10:269. [Google Scholar]
- 82.Faubel M. Photoionization and Photodetachment; World Science Publishing Company; 2000. p. 634. [Google Scholar]
- 83.Wilson KR, Rude BS, Smith J, Cappa CD, Co DT, Schaller RD, Larson M, Catalano T, Saykally RJ. Rev Sci Instrum. 2004;75:725. [Google Scholar]
- 84.Winter B, Weber R, Widdra W, Dittmar M, Faubel M, Hertel IV. J Phys Chem A. 2004;108:2625. [Google Scholar]
- 85.Faubel M, Steiner B, Toennies JP. J Chem Phys. 1997;106:9013. [Google Scholar]
- 86.Faubel M, Steiner B, Toennies JP. Journal of Electron Spectroscopy and Related Phenomena. 1998;95:159. [Google Scholar]
- 87.Winter B, Weber R, Hertel IV, Faubel M, Jungwirth P, Brown EC, Bradforth SE. J Am Chem Soc. 2005;127:7203. doi: 10.1021/ja042908l. [DOI] [PubMed] [Google Scholar]
- 88.Debies TP, Rabalais JW. J Elec Spect Rel Phenomena. 1972;1:355. [Google Scholar]
- 89.Gunion RF, Gilles MK, Polak ML, Lineberger WC. Int J Mass Spectrom Ion Proc. 1992;117:601. [Google Scholar]
- 90.Müller-Dethlefs K, Schlag EW. Annu Rev Phys Chem. 1991;42:109. [Google Scholar]
- 91.Kim JB, Yacovitch TI, Hock C, Neumark DM. Phys Chem Chem Phys. 2011;13:17378. doi: 10.1039/c1cp22211b. [DOI] [PubMed] [Google Scholar]
- 92.Eland JHD. Int J Mass Spectroscopy and Ion Physics. 1969;2:471. [Google Scholar]
- 93.Richardson JH, Stephenson LM, Brauman JI. J Am Chem Soc. 1975;97:2967. [Google Scholar]
- 94.Tomoda S, Kimura K. Chem Phys. 1983;82:215. [Google Scholar]
- 95.Barth S, Ončák M, Ulrich V, Mucke M, Lischke T, Slavíček P. J Phys Chem A. 2009;113:13519. doi: 10.1021/jp906113e. [DOI] [PubMed] [Google Scholar]
- 96.Tomoda S. Faraday Discuss Chem Soc. 1988;85:53. [PubMed] [Google Scholar]
- 97.Dopfer O, Reiser G, Müller-Dethlefs K, Schlag EW, Colson SD. J Chem Phys. 1994;101:974. [Google Scholar]
- 98.Fuke K, Yoshiuchi H, Kaya K. Chem Phys Lett. 1984;108:179. [Google Scholar]
- 99.Slavíček P, Winter B, Faubel M, Bradforth SE, Jungwirth P. J Am Chem Soc. 2009;131:6460. doi: 10.1021/ja8091246. [DOI] [PubMed] [Google Scholar]
- 100.Oana CM, Krylov AI. J Chem Phys. 2007;127:234106. doi: 10.1063/1.2805393. [DOI] [PubMed] [Google Scholar]
- 101.Oana CM, Krylov AI. J Chem Phys. 2009;131:124114. doi: 10.1063/1.3231143. [DOI] [PubMed] [Google Scholar]
- 102.Oana CM, Tao L, Mozhayskiy VA, Krylov, ezDyson AI. http://iopenshell.usc.edu/downloads/
- 103.Pluhařoá E, Ončák M, Seidel R, Schroder C, Schroeder W, Winter B, Bradforth SE. in preparation. [Google Scholar]
- 104.Isse AA, Gennaro A. J Phys Chem B. 2010;114:7894. doi: 10.1021/jp100402x. [DOI] [PubMed] [Google Scholar]
- 105.In this work, we employ the most recent value104 of 4.281 V. The variations in values obtained by other approaches (4.05–4.44 V, see Refs. 104, 112) suggest an uncertainty in the absolute value of about ±0.2 V, which will propagate into the final theoretical value of the redox potential.
- 106.Winget P, Weber EJ, Cramer CJ, Truhlar DG. Phys Chem Chem Phys. 2000;2:1231. [Google Scholar]
- 107.Tateyama Y, Blumberger J, Sprik M, Tavernelli I. J Chem Phys. 2005;122:234505. doi: 10.1063/1.1938192. [DOI] [PubMed] [Google Scholar]
- 108.Seidel R, Faubel M, Winter B, Blumberger J. J Am Chem Soc. 2009;131:16127. doi: 10.1021/ja9047834. [DOI] [PubMed] [Google Scholar]
- 109.Schroeder CA, Schroeder WP, Seidel R, Pluhařová E, Winter B, Faubel M, Slaviček P, Jungwirth P, Bradforth SE. 2012 doi: 10.1021/jp306348b. manuscript in preparation. [DOI] [PubMed] [Google Scholar]
- 110.Pluhařová E, Jungwirth P, Bradforth SE, Slaviček P. J Phys Chem B. 2011;115:1294. doi: 10.1021/jp110388v. [DOI] [PubMed] [Google Scholar]
- 111.Adriaanse C, Sulpizi M, VandeVondele J, Sprik M. J Am Chem Soc. 2009;131:6046. doi: 10.1021/ja809155k. [DOI] [PubMed] [Google Scholar]
- 112.Lewis A, Bumpus JA, Truhlar DG, Cramer CJ. J Chem Ed. 2004;81:596. [Google Scholar]
Associated Data
This section collects any data citations, data availability statements, or supplementary materials included in this article.


