

Background: Differences in protein interactions between wild-type and mutant huntingtin are relevant to the disease.
Results: Mutant huntingtin interacts with unique proteins and alters the subcellular context of some interactions shared with wild type.
Conclusion: Mutant Huntington disease protein has loss-of-function and gain-of-function attributes.
Significance: Results implicate understudied proteins and cellular/molecular processes that may contribute to the onset of the Huntington disease pathology.
Keywords: Huntington Disease, Neurodegenerative Diseases, Proteomics, RNA Metabolism, Translation, Interactome, Proteinopathy
Abstract
Huntington disease is a neurodegenerative disorder caused by a CAG repeat amplification in the gene huntingtin (HTT) that is reflected by a polyglutamine expansion in the Htt protein. Nearly 20 years of research have uncovered roles for Htt in a wide range of cellular processes, and many of these discoveries stemmed from the identification of Htt-interacting proteins. However, no study has employed an impartial and comprehensive strategy to identify proteins that differentially associate with full-length wild-type and mutant Htt in brain tissue, the most relevant sample source to the disease condition. We analyzed Htt affinity-purified complexes from wild-type and HTT mutant juvenile mouse brain from two different biochemical fractions by tandem mass spectrometry. We compared variations in protein spectral counts relative to Htt to identify those proteins that are the most significantly contrasted between wild-type and mutant Htt purifications. Previously unreported Htt interactions with Myo5a, Prkra (PACT), Gnb2l1 (RACK1), Rps6, and Syt2 were confirmed by Western blot analysis. Gene Ontology analysis of these and other Htt-associated proteins revealed a statistically significant enrichment for proteins involved in translation among other categories. Furthermore, Htt co-sedimentation with polysomes in cytoplasmic mouse brain extracts is dependent upon the presence of intact ribosomes. Finally, wild-type or mutant Htt overexpression inhibits cap-dependent translation of a reporter mRNA in an in vitro system. Cumulatively, these data support a new role for Htt in translation and provide impetus for further study into the link between protein synthesis and Huntington disease pathogenesis.
Introduction
Huntington disease (HD)4 is an inherited neurodegenerative disorder caused by a CAG repeat expansion in the first exon of the HD gene, huntingtin (HTT), that manifests as an abnormally long stretch of glutamine residues within the protein huntingtin (Htt). Despite the near ubiquitous expression of HTT in many different cell types, the neurons of the caudate, putamen, and portions of the cortex are disproportionately affected in HD (1), suggesting the contribution of a sensitized cellular environment. In addition, it is likely that the disease results from an accumulation of defects due to the influence of mutant Htt in multiple pathways, as the symptoms of HD typically take years to appear. Indeed, experiments in cell culture have found that mutant Htt activity influences many core cellular processes: metabolism, gene expression, transport, and signal transduction (2). Studies performed in late stage HD model systems provide information on the ultimate outcome of mutant Htt dysfunction: activation of the apoptosis pathway, protein aggregation, mitochondrial dysfunction, etc. However, these late stage events may directly result from or be promoted by earlier defects. HD can be modeled in mice by the introduction of a mutant Htt allele that recapitulates many of the pathologies observed in human HD (3). Models expressing an expanded CAG full-length mutant HTT allele from the endogenous locus most faithfully mimic the situation in humans compared with those overexpressing a mutant fragment of the protein. Brain tissue is an important source of material to investigate HD and Htt function (or dysfunction) as this material contains the cells most vulnerable to the disease. Furthermore, a contributing role for other brain cell types to HD has not been ruled out. With this in mind, we determined the pathways that were differentially represented between full-length wild-type and mutant Htt purifications from juvenile mouse brains, reasoning that the differences in Htt function from an early stage belie the late stage cellular phenotypes.
Identification of Htt-associated proteins provides a powerful way to assess the involvement of wild-type and mutant Htt in different cellular pathways. Although several studies have identified meaningful Htt interactions through the yeast two-hybrid system, affinity purifications, and various genetic interaction screens (4–14), none has attempted a comprehensive identification of Htt-associated proteins in brains using full-length protein expressed at endogenous levels. To this end, we utilized FLAG-tagged wild-type and mutant HTT knock-in mice5 to isolate Htt-containing protein complexes from juvenile mouse brains. Co-purifying proteins were comprehensively identified by multidimensional protein identification technology, and protein abundance was determined semi-quantitatively based on the number of MS/MS peptide identifications (spectral counts) found for each protein (15). This approach provided a simple, cost effective, and reliable semiquantitative measure of protein abundance from our affinity-purified protein mixtures. However, less abundant proteins are certainly more challenging to accurately measure especially when present in complex proteomes (16). We incorporated subcellular fractionation to better resolve the cellular location of observed interactions as well as to identify any differences in the locations of common interactions between wild-type and mutant Htt. We selected wild-type and mutant Htt interactors based on their enrichment relative to control mice lacking FLAG-Htt and a measure of their co-variation with respect to the amount of Htt recovered from three independent biological triplicates. Additionally, we devised a comparative quantification methodology based on normalization to the amount of Htt protein recovered to directly compare the levels of commonly observed proteins between wild-type and mutant purifications. Using these methods we identified a number of proteins and cellular activities differentially represented between wild-type and mutant Htt complexes and thus implicated particular cellular processes likely to be affected by mutant Htt.
EXPERIMENTAL PROCEDURES
Fractionation of Brain Tissue and Affinity Purifications
Brains from control, 3×FLAG-tagged 7QHtt, and 3×FLAG-tagged 140QHtt mice were cut into small ∼1-mm chunks and lysed with a Dounce homogenizer in 2 ml per brain of hypotonic lysis Buffer A (10 mm HEPES (pH 7.6), 1.5 mm MgCl2 containing the protease inhibitors pepstatin A, leupeptin, aprotinin, sodium metabisulfite, PMSF (Sigma), and 40 units per brain of RNasin (Promega)) Cells were allowed to burst for 10 min on ice, and the buffer salt concentration was then adjusted by adding volume of 10× Buffer B (300 mm HEPES (pH 7.6,) 1.4 m KCl, 30 mm MgCl2, 0.25% Triton X-100). Brain homogenates were fractionated by centrifugation as in Fig. 1a. P2 material was solubilized using 2 ml per brain of Buffer BT (1× Buffer B with 0.5% Triton X-100) with protease inhibitors and 40 units of RNasin per brain. Purifications were performed on S2 and P2 fractions after adjusting protein concentration to 6 mg/ml with 1× Buffer B or 1× Buffer BT, respectively. All protein quantifications were done by Bradford assay (Bio-Rad). Equal amounts of protein lysate were used from 3×FLAG-tagged Htt samples and the corresponding negative control. All protein extracts were generated from postnatal day-15 animals. Control brains were taken from wild-type (no FLAG tag) littermates of FLAG-tagged Htt lines (see “Mice” below and supplemental Tables S5 for genotypes of brains used in purifications). Affinity purifications were carried out at 4 °C by the batch method with gentle mixing for 4 h by combining protein extracts with a 100-μl packed volume of M2 anti-FLAG-conjugated agarose (Sigma) per brain for S2 purifications and 50 μl of packed volume per brain for P2 purifications. Batch purifications were transferred to 10-ml columns (Bio-Rad) for washing (20 bead volumes of 1× Buffer B ± Triton X-100) and elution steps. Proteins were eluted from the beads using 3×FLAG peptide (Sigma) at 150 ng/μl in HEMG buffer (25 mm HEPES (pH 7.6), 0.1 mm EDTA, 12.5 mm MgCl2, 10% glycerol) containing 0.15 m KCl. 90% of eluted samples were TCA-precipitated and lyophilized for later analysis by mass spectrometry.
FIGURE 1.

Strategy to identify wild-type (7Q) and mutant (140Q) Htt-interacting proteins from mouse brain. a, a flow chart shows centrifugation-based subcellular fractionation of mouse brain lysates. The red-boxed fractions were used for FLAG purifications. Western blot analyses below show the distribution of a nuclear protein (YY1), ribosomal protein (Rps6), cytoskeletal protein (β-tubulin), and Htt. The numbers indicate the amount of each fraction blotted. b, shown is a representative Western blot (WB) and silver-stained gels of 7Q and 140Q S2 (cytoplasmic) and P2 (membranous) purifications. The arrowheads and arrows indicate 7Q and 140Q Htt protein isoforms, respectively. IP, immunoprecipitates. c, the bar graph shows the number of spectral counts for Htt observed in each trial, for each genotype, under each condition. d, shown is a flow chart depicting the data analysis pipeline of the 24 total FLAG affinity purifications. This paradigm was followed for both S2 and P2 purifications. e, shown is a graph illustrating the relationship between Pearson correlation values (r) and co-variation of candidate Htt-interacting proteins. Proteins with positive r values tend to co-vary in abundance with respect to Htt in each trial. f, the graph shows the distribution of r values (y axis) and the log2 enrichment of average spectral counts (x axis, 7Q/control) of reproducibly identified control proteins (black balls) and 7Q proteins (green balls). The pink-shaded area highlights the proteins considered to be candidate 7Q-interacting proteins.
For immunoprecipitations from cultured Neuro-2a cells, cytoplasmic fractions were generated by lysing the cells (10 cm plate) in Buffer A followed by disruption using a 25-gauge needle mounted to a hypodermic syringe. After lysis in Buffer A, volume of Buffer B was added to bring the final concentration of buffer salts to 1× Buffer B. Equal protein amounts were immunoprecipitated in a FLAG-tagged protein overexpression experiment from the same lysate. All immunoprecipitations were carried out at 4 °C for 3 h with gentle mixing. Antibodies were recovered from lysates by incubation with 15 μl (bead suspension volume) of Protein G Dynabeads (Invitrogen) for 1 h at 4 °C. For Htt immunoprecipitations from non-FLAG-tagged mouse brain tissue, brains were fractionated as above, but before 14,000 × g spin, Triton X-100 was added along with a volume of Buffer B to a final concentration of 0.5% and incubated at 4 °C for 20 min. Protein concentration was adjusted to 6 mg/ml with 0.5% Triton X-100 containing 1× Buffer B, and equal amounts of homozygous wild-type (+/+) and mutant (140Q/140Q) extracts were incubated with 5 μg of rabbit IgG or 5 μg anti-Htt antibodies (see “Antibodies”) conjugated to 50 μl (bead suspension) of protein G Dynabeads overnight at 4 °C. Beads were washed in lysis buffer with and without Triton X-100, and bound proteins were eluted from the beads by acidic glycine elution (100 mm glycine (pH 2.8)) and TCA-precipitated. 30 μg of inputs and unbound proteins are shown along with the entire elution in Fig. 3g.
FIGURE 3.

Comparison and confirmation of 7Q- and 140Q-associated proteins. a and b, volcano plots compare the log2-fold difference (x axis) and −Log10 p values (y axis) of commonly observed S2 (a) and P2 (b) proteins. The different shaded balls signify in which genotype a protein passed all the stringency criteria. In b, Myo5a was a low confidence candidate interacting protein in both 7Q and 140Q purifications (positive r value; -fold change <1.5 over control). Arrows highlight the identities of specific proteins. The dotted lines show regions of particular significance (raw -fold difference >1.5, p value <0.05). c and d, Western blot analysis for the indicated proteins from S2 (c) and P2 (d) FLAG purifications is shown. e, Western blot analysis of GFP and Htt in GFP immunoprecipitations from Neuro-2a cells transfected with the indicated plasmids is shown. f, Western blot analysis of Htt and FLAG in IgG or Htt immunoprecipitations (IP) from Neuro-2a cells transfected with FLAG-RbFox1 is shown. Equal amounts of protein lysate were used in each condition. g, Western blot analysis of IgG and Htt immunoprecipitations from non-FLAG-tagged wild-type (+/+) and homozygous mutant (140Q/140Q) whole mouse brain lysates probed with antibodies to Htt, Myo5a, and Rps6 is shown. Both wild-type and mutant Htt specifically co-immunoprecipitated with Myo5a and Rps6. Substantial amounts of Htt remained in extracts after immunoprecipitation with anti-Htt antibodies (unbound lanes).
Sample Preparation
The FLAG affinity purification precipitates were resuspended in 8 m urea with ProteaseMAX (Promega) per the manufacturer's instructions. The samples were subsequently reduced by 20 min of incubation with 5 mm TCEP (tris(2-carboxyethyl)phosphine) at room temperature and alkylated in the dark by treatment with 10 mm iodoacetamide for 20 additional minutes. The proteins were digested overnight at 37 °C with Sequencing Grade Modified Trypsin (Promega), and the reaction was stopped by acidification.
Multidimensional Protein Identification Technology
The protein digest was pressure-loaded onto a 250-μm inner diameter capillary packed with 2.5 cm of 10-μm Jupiter C18 resin (Phenomenex, Torrance, CA) followed by an additional 2.5 cm of 5-μm Partisphere strong cation exchanger (Whatman). The column was washed with buffer containing 95% water, 5% acetonitrile, and 0.1% formic acid. After washing, a 100-μm inner diameter capillary with a 5-μm pulled tip packed with 15 cm of 4-μm Jupiter C18 resin (Phenomenex) was attached to the filter union, and the entire split column (desalting column-filter union-analytical column) was placed in-line with an Agilent 1100 quaternary HPLC and analyzed using a modified 5-step separation described previously (15). The buffer solutions used were 5% acetonitrile, 0.1% formic acid (buffer A), 80% acetonitrile, 0.1% formic acid (buffer B), and 500 mm ammonium acetate, 5% acetonitrile, 0.1% formic acid (buffer C). Step 1 consisted of a 75-min gradient from 0 to 100% buffer B. Steps 2–5 had a similar profile, except 3 min of 100% buffer A, 5 min of X% buffer C (see below), a 10-min gradient from 0–15% buffer B, and a 105-min gradient from 10–55% buffer B (except for step 5 in which %B was increased from 10 to 100%). The 5-min buffer C percentages (X) were 10, 40, 60, 100%, respectively, for the 5-step analysis.
For Linear Trap Quadruple Ion Trap
As peptides eluted from the microcapillary column, they were electrosprayed directly into a linear trap quadruple two-dimensional ion trap mass spectrometer (Thermo Finnigan) with the application of a distal 2.4-kV spray voltage. A cycle of one full-scan mass spectrum (400–2000 m/z) followed by 6 data-dependent MS/MS spectra at a 35% normalized collision energy was repeated continuously throughout each step of the multidimensional separation. Application of mass spectrometer scan functions and HPLC solvent gradients were controlled by the Xcalibur data system.
Analysis of Tandem Mass Spectra
MS/MS spectra were analyzed using the following software analysis protocol. Protein identification and quantification analysis were done with Integrated Proteomics Pipeline (IP2, Integrated Proteomics Applications, Inc. San Diego, CA) using ProLuCID, DTASelect2, and Census. Tandem mass spectra were extracted into ms1 and ms2 files (14) from raw files using RawExtract 1.9.9. Poor quality spectra were removed from the dataset using an automated spectral quality assessment algorithm (17). MS/MS spectra remaining after filtering were searched with the ProLuCID algorithm against the EBI-IPI_Mouse_01_01_04-19-2009 concatenated to a decoy data base in which the sequence for each entry in the original data base was reversed (18). All searches were parallelized and performed on a Beowulf computer cluster consisting of 100 1.2-GHz Athlon CPUs (19). Only peptides with at least one tryptic terminus were considered. Searches were performed with cysteine carbamidomethylation as a fixed modification. ProLuCID (20) results were assembled and filtered using the DTASelect (Version 2.0) program (21). DTASelect 2.0 uses a linear discriminant analysis to dynamically set XCorr and DeltaCN thresholds for the entire dataset to achieve a user-specified false positive rate (5% in this analysis). The false positive rates are estimated by the program from the number and quality of spectral matches to the decoy data base. Confidence for modifications was estimated from overlapping modified peptides as described previously (22). There are several instances of redundancy in the protein data base arising from the presence of multiple splice isoforms for a given protein, gene duplication events, and pseudogenes. Proteins that were represented more than once in the data base and found in our purifications were grouped together, and the data base entry that appeared in the most runs with the greatest number of observed MS2 spectral counts was further considered in the analysis.
Statistical Analysis of Htt-associated Proteins
All protein quantification was based on the spectral counts observed for each protein (see Fig. 1d for schematic representation). Proteins were not considered further if they appeared in only one of the three runs for each condition. Spectral counts for each protein were averaged per genotype and used to calculate -fold enrichment over the control. The Pearson correlation coefficient (r) for each reproducibly identified protein was calculated relative to the spectral counts observed for Htt in 3× FLAG-tagged samples in an experimental pair (e.g. both 7Q S2 and its control S2 use Htt spectral counts in 7Q trials). Pearson correlation is defined by Equation 1,
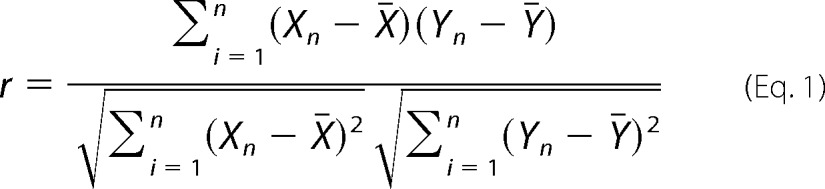 |
where Xn represents the spectral counts for protein X in trial n, X̄ is the average spectral counts for protein X, Yn is the spectral counts for Htt in trial n, and ¯Y is the average spectral counts for Htt. In 7Q and 140Q comparisons, protein spectral counts were normalized for Htt recovery by dividing the number of spectral counts observed for a given protein in trial n by the number of spectral counts observed for Htt (7Q or 140Q) in trial n. Normalized spectral count values were used to calculate the fold difference between 7Q and 140Q. The ANOVA operation was used to calculate p values between 7Q and 140Q commonly observed proteins, because a paired t test would fail for proteins that were identified in a different total number of purifications between 7Q and 140Q samples. All calculations, tables, and graphs were generated in Microsoft Excel. PANTHER data base (23, 24) searches were conducted using standard gene nomenclature as defined by NCBI. Gene Ontology groups presented were identified on the basis of the number of proteins present in a given category (>5% of the total proteins analyzed per genotype), greatest level of enrichment (>2-fold), the smallest associated p values (p < 0.001), and more specific functional information for both 7Q and 140Q. False discovery rates were calculated based on the number of reproducibly observed proteins in each control set that had an average spectral count value ≥1.5 of the corresponding average FLAG-Htt sample and a positive r value divided by the total number of reproducibly observed control proteins.
Antibodies
For Western blots, M2 anti-FLAG antibody (Sigma) was used at 1:10,000, anti-Htt mAB2166 (Millipore) was used at 1:2000, anti-YY1 H414 (Santa Cruz Biotechnology) was used at 1:200, anti-Rps6 2217 (Cell Signaling Technology) was used at 1:500, anti-β tubulin (Covance) was used at 1:1000, anti-actin ac15 (Santa Cruz Biotechnology) was used at 1:400, anti-Zonab (Csda) (Invitrogen) was used at 1:125, anti-G3bp2 (Abcam) was used at 1:1000, anti-RACK1 (Gnb2l1) (BD Transduction Laboratories) was used at 1:2500, anti-Syt2 (Synaptic Systems, Gottingen) was used at 1:500, anti-Myo5a (Cell Signaling Technology) was used at 1:1000, anti-Eif2α and phospho-Eif2α (Cell Signaling Technology and StressGen, respectively; gifts of Ian Mohr, NYU School of Medicine) was used at 1:1000, anti-PACT (Prkra) (gift of Ganes Sen, Case Western Reserve University, Cleveland Clinic) was used at 1:2000, and anti-GFP (Santa Cruz Biotechnology) was used at 1:500. Secondary antibodies were generated in goat to rabbit or mouse IgG and were covalently attached to IR dyes for visualization on LI-COR or to HRP to visualize phospho-Eif2α. For immunofluorescence, anti-Htt mAB2166 (Millipore) was used at 1:300 in STHdh cell lines, and anti-Tia1 sc-1751 (Santa Cruz Biotechnology) was used at 1:50. Secondary antibodies were generated in donkey: donkey anti-mouse (488) and donkey anti-goat (555) (Invitrogen). All incubations in primary antibodies were done for 48 h at 4 °C, and secondary incubations done at room temperature for 1 h. For immunoprecipitations, ∼2 μg (see Fig. 3f) or 5 μg (see Fig. 3g) of anti-Htt antibody (Enzo Life Sciences) and 2 μg (see Fig. 3f) or 5 μg (see Fig. 3g) of nonspecific rabbit IgG (Invitrogen) and 2 μg of anti-GFP (Rockland Immunochemicals) was used for GFP immunoprecipitations. Antibodies were captured using Protein G Dynabeads (Invitrogen).
Cell Culture and Transfections
Mouse Neuro-2a cells and HeLa cells were cultured in 10% FBS in DMEM (Mediatech) and transiently transfected using Lipofectamine 2000 (Invitrogen) under recommended conditions. Mouse HTT knock-in striatal precursor lines (60) were cultured in 10% FBS in DMEM (Mediatech) and grown at 33 °C. Stress granule induction experiments were done by adding sodium arsenite to the media at a final concentration of 0.5 mm for 30 min at 33 °C.
Plasmids
GFP-TLS was the gift of Ritsuko Fujii (Osaka Bioscience Institute, Japan), GFP-Myo5a was provided by Michael D. Ehlers (Duke University), GFP-Myo5b was provided by Ben Wang of the former laboratory of Alaa El-Husseini (University of British Columbia), GFP-Myo6 was provided by Hiroko Yano (Harvard University), GFP-Fmrp was provided by Gary Bassell (Emory University), RbFox1 constructs were provided by Douglas Black (University of California, Los Angeles, CA), pEGFP-C1 (Clontech laboratories), pHD17Q, and pHD75Q were from Trottier et al.(25), and pT3 Luc pA (26) was a gift from Matthias W. Hentze (EMBL). We thank all other investigators for plasmids that did not appear in this paper.
Polysome Analysis
Cytoplasmic (S2) extracts from whole P15 mouse brains were prepared as described above and spun on a 20–50% sucrose gradient using a method adapted from (27). 16–18 A260 units were run per an 11-ml gradient. Gradients were separated using a Beckman Optima L-90K ultracentrifuge using the SW 40 Ti rotor (Beckman-Coulter). UV absorbance and fraction collection were done on an ISCO UV-6 UV monitor with Foxy R2 fraction collector (Teledyne ISCO, Lincoln, NE). 30 μg of cytoplasmic inputs, 3% of fraction 1, 2% of fractions 2 and 3, and 8% of fractions 4–15 were analyzed by gel electrophoresis. EDTA was used at 20 mm for ribosome dissociation experiments.
Immunofluorescence
Before fixation, STHdh cells were washed 3 times in warm PBS, fixed in 4% paraformaldehyde for 10 min at 37 °C, washed 3 times in PBS, and permeabilized for 30 min at room temperature in 0.2% Triton X-100 in PBS. Fixed and permeabilized cells were blocked for 1 h at room temperature in 5% BSA with 0.25% saponin in PBS and stained with antibodies described above. Coverslips were mounted in Dako fluorescent mounting medium. Images were acquired on a Zeiss META510 confocal scanning laser system on an Axiovert 200M microscope using a Plan-Apochromat 100×/1.3 oil-immersion objective lens. Brightness and contrast settings were adjusted image-wide using Adobe Photoshop.
In Vitro Transcription and Translation
5′m7G-capped and polyadenylated firefly luciferase mRNA was prepared from pT3 Luc pA as described in Rakotondrafara and Hentze (28). HeLa extracts were prepared from untransfected cells, pEGFP-C1-, pHD17Q-, or pHD75Q-transfected cells 48 h post-transfection according to the method of Rakotondrafara and Hentze (28). Transfections were performed using Lipofectamine 2000 (Invitrogen) according to the manufacturer's instructions. Protein concentrations were equalized across all samples before assay. Extracts were treated with micrococcal nuclease as suggested by Rakotondrafara and Hentze (28) to remove cellular mRNAs before in vitro reactions. Translation capacity was indirectly measured by luciferase activity after in vitro translation.
Mice
All protocols for animal use were approved by the Institutional Animal Care and Use Committee of the University of Virginia and were in accordance with NIH guidelines. P15 brains were obtained from the progeny of Hdh3×FLAG7Q/+ and Hdh3×FLAG140Q/+ intercrosses. All mice were at least F6 in the C57BL6/J background. At P15, mice were anesthetized with isoflurane and euthanized by cervical dislocation. Dissected brains were frozen rapidly in isopentane chilled on dry ice and then stored at −80 °C. Details of the derivation of the strains used in this study are presented in Zheng et al.5 For genotyping the Hdh3×FLAG7Q allele, PCR was used to amplify a portion of the Hdh coding sequence flanking the epitope tag insertion site between mouse Htt amino acids 1 and 2. Using HDepi-1 (5′-GCGTAGTGCCAGTAGGCTCCAAG-3′) and HDepi-2 (5′-CTGAAACGACTTGAGCGACTCGAAAG-3′) oligonucleotides, a wild-type Hdh allele generates a 112-bp PCR product, whereas the Hdh3×FLAG7Q allele generates a 178-bp product due to the insertion of the 22-amino acid 3×FLAG epitope tag. For genotyping the Hdh3×FLAG140Q allele, HDepi-1 and HuHDepi-2 (5′-GAAGGACTTGAGGGACTCGAAGG-3′) oligonucleotides were used. HuHDepi-2 is homologous to human HTT exon 1 sequence located 3′ of the XmnI restriction site within exon 1 of the Hdh3×FLAG140Q allele. This allele generates a 176-bp PCR product with this primer pair, whereas no product would be generated from the wild-type Hdh allele. To discriminate heterozygous Hdh3×FLAG140Q/+ from homozygous Hdh3×FLAG140Q/3×FLAG140Q mice, the following oligonucleotides were used; 140for (5′-CTGCACCGACCGTGAGTCC-3′) and 140rev (5′-GAAGGCACTGGAGTCGTGAC-3′) oligonucleotides flank a 100-bp intron 1 deletion that is present in the Hdh3×FLAG140Q allele (this deletion is identical to the deletion present in the Hdh140Q allele lacking an epitope tag; Ref. 29) and will generate a 150-bp PCR product, whereas the wild-type Hdh allele lacking the intron 1 deletion generates a 235-bp product.
RESULTS
Biochemical Distribution of Htt in Mouse Brains
We used the brains from juvenile (post-natal day 15) knock-in 3× FLAG-tagged full-length wild-type or mutant Htt mice5 to isolate Htt-containing complexes. We reasoned that differences in wild-type and mutant Htt protein associations from the brains of juvenile animals may reveal early changes that contribute to the onset of the disease. FLAG affinity purification (supplemental Fig. S1a) was used instead of anti-Htt antibodies (see Fig. 3g and data not shown) because it was much more efficient, depleting nearly all of the FLAG-tagged Htt from protein extracts. Furthermore, anti-Htt antibodies may not be able to bind to some Htt-protein complexes if the antigenic site is obscured. Non-FLAG-tagged 140Q mice (the FLAG-140Q mice were derived from the same targeting vector) are reported to develop gait abnormalities, tremors, and other behavioral phenotypes. Furthermore, these mice form nuclear and neuropil Htt aggregates after two months in a pattern similar to what is observed in human HD patient tissue (29, 30). Both wild-type and mutant FLAG-Htt mice have no apparent behavioral or histological differences from their untagged counterparts, develop normally, and produce fertile offspring.6 The mice offer the most efficient means available to purify Htt from brain tissue. Hereafter, we refer to the FLAG-tagged wild-type allele as 7Q and the FLAG-tagged mutant allele as 140Q.
We first performed biochemical fractionation (Fig. 1a) and examined the distribution of Htt in the 7Q and 140Q brains, which appear quite similar. Wild-type Htt is known to be a soluble and predominantly cytoplasmic protein, although a small fraction has been reported in the nucleus as well (31, 32). Brain homogenates can be separated into fractions enriched in particular cellular compartments (cytoplasmic, membranous, nuclear) based on solubility and sedimentation properties (33). We employed this centrifugation-based subcellular fractionation of 7Q brain homogenates and confirmed the nuclear and cytoplasmic distribution (Fig. 1a, 7Q/7Q: NE, S2, S3). Significant amounts of Htt were solubilized from the membranous fraction by treatment with 0.5% Triton X-100 (Fig. 1a, lanes P2 and S4), and lesser amounts were associated with the 100,000 × g sedimentable fractions (Fig. 1a, lanes P3 and P4, respectively). The detergent-sensitive solubility of Htt from the P2 fraction suggests some membrane association, which is consistent with the implication of Htt in membrane trafficking events (34, 35) and its cellular localization to the mitochondria, endoplasmic reticulum, and neuronal synapses (36, 37). The P3 and P4 fractions contain ribosomes, small vesicles (38, 39), and other large particles. 140Q mouse brains subjected to the same fractionation technique show a nearly indistinguishable pattern of Htt distribution for both the wild-type (lower band) and mutant (upper band) version of the protein (Fig. 1a, 140Q/+, anti-Htt Western blot, arrowhead and arrow, respectively). A complete comparison between FLAG-Htt knock-in mice and their untagged counterparts is beyond the scope of this paper and will be addressed elsewhere.5 However, Western blot analysis of Htt distribution in non-FLAG-tagged wild-type and mutant (140Q/+) HTT mouse brains showed similar fractionation patterns as the FLAG-tagged protein isoforms, except there was less Htt present in nuclear extracts in non-FLAG tagged brains than FLAG-tagged samples (compare Fig. 1a, NE. and supplemental Fig. S2, NE). Based on the relative abundance of Htt in cytoplasmic (S2) and membranous (P2) fractions (Fig. 1a, red boxes: S2 and P2) as well as their recovery potential using FLAG affinity chromatography (data not shown), we performed our analysis from these two fractions.
Statistical Analysis of FLAG Affinity Purifications Identifies Htt Interactors
We controlled for nonspecific interactions to the FLAG affinity matrix by using brains from non-FLAG-tagged littermates. These mice lack any FLAG-tagged proteins and, therefore, behave as FLAG-null animals, allowing us to more precisely determine the background binding activity of the FLAG antibody. This is not true for approaches using random IgG as a control. We performed three independent FLAG affinity purifications for each 7Q and 140Q brains from both the S2 fraction and P2 fraction (six purifications for each genotype), and every purification was conducted in parallel with a non-FLAG tagged control (12 negative control purifications, 24 total purifications). Eluates from each purification experiment were analyzed for protein components by multidimensional protein identification technology LC-MS/MS (see below). Both 7Q and 140Q S2 and P2 FLAG purifications recovered substantial amounts of Htt and contained abundant co-purifying proteins (Fig. 1b). We consistently recovered much less full-length 140Q from our purifications than 7Q protein (Fig. 1, b and c), as determined by both Western blot analysis and mass spectrometry, which occurred despite equal FLAG-Htt gene dosage (see supplemental Table S5 for animal genotypes). Multidimensional protein identification technology was employed to identify all of the proteins present in control, 7Q, and 140Q purifications using spectral counts as an indirect measure of protein abundance (16). We utilized multiple filtering criteria of uniformly applied statistical measures to eliminate nonspecific background proteins from the list of candidate 7Q- and 140Q-associated proteins (Fig. 1d). The average spectral counts for each reproducibly observed protein in each condition (genotype and fraction source) was compared with the value for the corresponding negative control. Proteins less abundant than the negative controls were removed from further consideration. We reasoned that true Htt-interacting proteins should scale according to Htt levels, as their presence in the purified material should depend on Htt. This trend was quantified using the Pearson correlation coefficient (r) for each protein relative to the amount of Htt recovered for that sample trial. Because Htt was not observed in control samples, we used the amount of Htt recovered in the corresponding FLAG-tagged sample to generate r values for reproducibly observed control proteins. Positive correlation values indicate that the amount of a protein recovered co-varied with the amount of Htt recovered (Fig. 1e, green), whereas a negative correlation value indicates that the abundance of a co-purifying protein was less related to the amount of Htt recovered (Fig. 1e, red). We separated proteins with negative correlation values (Fig. 1d, low confidence interacting protein, supplemental Tables S1 and S2) from those with positive correlation values (Fig. 1d, candidate interacting protein, supplemental Tables S3 and S4) to further define a set of low and high confidence candidate interacting proteins. The reader should bear in mind that due to the limited number of trials performed, a positive r value for a given protein may not always be a true indicator of a stoichiometric relationship with Htt. We set an arbitrary -fold enrichment at 1.5-fold (log2 value ∼0.585) to further discriminate against potential nonspecific interactions. The distribution of r values and the log2-fold change (7Q/negative control) in average spectral counts for all reproducibly observed proteins in 7Q S2 purifications (Fig. 1f, green dots) and the corresponding negative control (Fig. 1f, black dots) demonstrate how these criteria were used to discriminate background associations from candidate interactions (see supplemental Fig. S1, b–d for plots from the other purifications). The pink-shaded areas (Fig. 1f and supplemental Fig. S1, b–d) highlight proteins that were ultimately called candidate Htt interactors (supplemental Tables S3 and S4). For 7Q S2 purifications we found 236 proteins, whereas 140Q S2 purifications had 129. 7Q P2 purifications revealed 127 proteins, whereas140Q P2 purifications contained 226 that met these criteria. 140Q P2 purifications consistently had a greater percentage of total spectral counts (P2 Htt spectral counts/S2 + P2 Htt spectral counts) observed for Htt than 7Q P2 purifications, which may help to explain the larger number of 140Q P2 candidate interactors. To estimate false discovery rates in our purifications, we applied these filtering criteria to negative control purifications (except that enrichment was relative to the FLAG-tagged sample). The number of negative control candidate interacting proteins was divided by the total number of reproducibly observed proteins in the negative control, which gave us false discovery rate values of 1.8, 6.5, 5.7, and 4.3% for 7Q S2, 140Q S2, 7Q P2, and 140Q P2 purifications, respectively.
Summary of Candidate Htt-interacting Protein Distribution
We next aimed to determine the functional categories of 7Q- and 140Q-associated proteins by Gene Ontology (GO) analysis. We employed the PANTHER data base (23, 24) to reveal functional groups significantly overrepresented in our data sets when compared with what may be expected to appear in our lists by chance from a random sampling of the mouse proteome (Fig. 2, a and b). The most significant functional groups/pathways present in 7Q purifications were those previously linked to Htt: intracellular transport (motor activity), ubiquitin-mediated protein degradation, cytoskeletal, and in the regulation of GTPase activity (2). The Huntington disease pathway encompasses multiple cellular pathways (mitogen-activated protein kinase signal transduction, transcription, apoptosis, actin remodeling, endocytosis, dynein-dependent vesicle trafficking, and glutamate receptor activity) and is based on accepted notions of the processes contributing to the disease. The HD pathway was greatly enriched and highly significant in our 7Q purifications (Fig. 2a; 11-fold enrichment, p value 10−15). GO analysis of 140Q candidate interacting proteins shows a striking enrichment for proteins involved in translation (Fig. 2a; translation initiation and ribosomal; 14- and 18-fold enrichment, p values 10−7 and 10−45, respectively) or other steps of RNA metabolism (RNA binding; 12-fold enrichment, p value 10−26). These large enrichments and highly significant p values support a role for 140Q in translation. Although the Huntington disease GO category was not well represented in 140Q S2 purifications, it was highly significant in 140Q P2 purifications (Fig. 2b; 9-fold enrichment, p value 10−10), which demonstrates the value in our fractionation approach to reveal differences in the localization of common interactions between 7Q and 140Q.
FIGURE 2.

Functional categories of 7Q and 140Q interacting proteins. a and b, shown is a Gene Ontology analysis of S2 (a) and P2 (b) 7Q- and 140Q-associated proteins. The x axis labels individual molecular function or pathway categories as annotated by the PANTHER data base. The left y axis marks the enrichment (observed/expected), and right y axis marks the −log10 of the p value. Enrichment values are presented as bar graphs (7Q = white, 140Q = gray), and p values are presented as balls. ns, not significant (p > 0.05). c, a schematic shows different types of shared interactions between 7Q and 140Q. Balls represent individual protein categories (black = S2 identification, white = P2 identification). The red boxes group interaction types, which are labeled to the left of the schematic and given letter notations (A, B, C, D, and E within protein balls). d, the bar graph illustrates how 7Q and 140Q candidate interacting proteins were distributed between 7Q and 140Q purifications with letter notations summarizing shared interaction distributions as diagrammed in c. e, procedures were the same as in a and b except for the proteins grouped as D or E. N-Ach-R, nicotinic acetylcholine receptor.
Fractionation before our purifications enabled us to compare the locations of interactions both within and between genotypes. Proteins could, therefore, be found solely in the S2 or P2 fractions or in both (Fig. 2c). Oftentimes shared interactions occurred in the same fraction in both 7Q and 140Q (Fig. 2c, three uppermost boxes, A, B, and C). However, there were also instances when the same proteins were found in different fractions between 7Q and 140Q (Fig. 2c; 7Q S2 to 140Q P2 (D), and 7Q P2 to 140Q S2 (E)). Most of the shared interactions between 7Q and 140Q occurred in the P2 fraction (Fig. 2d) with fewer common interactions occurring in S2 purifications. The relatively large number of common proteins that were found in different fractions between 7Q and 140Q purifications led us to examine what types of proteins were represented by these groups (Fig. 2d, 7Q S2 to 140Q P2 (D) and 7Q P2 to 140Q S2 (E)). PANTHER GO analysis on proteins that fit into these groups found that the majority of 7Q S2 to 140Q P2 fractions fit into cytoskeleton structural and Huntington disease GO groups (Fig. 2e, D). For the 7Q P2 to 140Q S2 purifications, the most abundant and significant GO groups represented were ribosomal proteins and nucleic acid-binding proteins (Fig. 2e, E). These shifts in localization of potential interactions add information that cannot be immediately gleaned from yeast two-hybrid or other affinity purification strategies lacking a fractionation step in their analysis and, therefore, contribute to a more detailed inventory of Htt interactions.
Comparison of 7Q- and 140Q-associated Proteins
We next wanted to compare the relative levels of commonly observed proteins between 7Q and 140Q purifications. To make equal comparisons between proteins found in 7Q and 140Q purifications, we normalized the spectral counts for each protein to the amount of Htt recovered on a run-by-run basis by a simple division operation (Fig. 1d). This normalization adjusts spectra count numbers for Htt recovery and, therefore, allows us to directly compare protein spectra counts between 7Q and 140Q. Peptides corresponding to the polyglutamine stretch were very infrequently observed in 7Q purifications (less than 0.001% of total peptides). Therefore, differences in observed number of spectra between 7Q and 140Q were not likely to have arisen from the absence of observation of this peptide in 140Q purifications. Average normalized spectra counts for every protein identified in 7Q and 140Q purifications were compared in order to generate -fold difference (Fig. 1d, x axis, log2 scale) and associated p values (Fig. 1d, y axis, −log10 scale). Partitioning of these volcano plots into six quadrants (Fig. 1d) based on -fold change and ANOVA p value gives different degrees of difference between commonly observed candidate Htt-interacting proteins. Proteins that were nearly equally abundant in 7Q and 140Q purifications are denoted as either 7Q > 140Q or 7Q < 140Q (raw -fold difference <1.5), proteins that were more abundant in 7Q than in 140Q are denoted 7Q ≫ 140Q (raw -fold difference ≥ 1.5), and proteins less abundant in 7Q than in 140Q are called 7Q ≪ 140Q. The most significantly different proteins were those that had an ANOVA p value of less than 0.05 and had a raw -fold difference of greater than 1.5-fold between genotypes (Fig. 1d, 7Q ≫ 140Q* and 7Q ≪ 140Q*). These annotations are presented within supplemental Tables S1–S4 along with the ANOVA p values for each protein. The resulting volcano plots for S2- and P2-purified proteins, the identities of some of the most different proteins, and the genotypes in which they passed the filtering criteria are shown in Fig. 3, a and b. Although many proteins that were identified as a 7Q or 140Q candidate did not pass the filtering criteria in one sample or another, many of these proteins had highly positive r values despite low or negative log2 enrichment scores; therefore, there may in fact be more real overlap between 7Q- and 140Q-associated proteins than indicated by the filtering criteria.
Independent Confirmations of Select Interactions Identified by Mass Spectrometry
Next we aimed to confirm some of our findings by Western blot of 7Q and 140Q S2 (cytoplasmic) and P2 (membrane-associated) purifications. 7Q purifications from homozygous FLAG-tagged brains recovered substantially more Htt protein than 140Q purifications from heterozygous brains, as would be expected (Fig. 3, c (S2) and d (P2)) given the doubling of FLAG gene dosage. 7Q purifications showed increased levels of Myo5a, Prkra, Rps6, Gnb2l1, and Syt2 compared with the negative control by Western blot (Fig. 3, c and d). Prkra (PACT), Rps6, and Gnb2l1 (RACK1) are each involved in translation, either directly (Rps6) or indirectly (Prkra and Gnb2l1) (40, 41). Myo5a is likely involved in transporting RNA into dendritic spines in cooperation with the RNA binding protein TLS (42) among other activities. 140Q purifications showed enrichment of Myo5a, Gnb2l1, Prkra, Syt2, and Rps6 compared with the control (Fig. 3, c and d). However, the Myo5a enrichment was confined to membrane-associated purifications, which also agreed with the mass spectrometry observations. Based on quantification of full-length Htt band intensities, 7Q was ∼3 and 6 times as abundant as 140Q in S2 and P2 purifications, respectively. When this is taken into account, the levels of the co-immunoprecipitated proteins with respect to Htt recovery in general agree very well with the quantitative analysis (Volcano plots, Fig. 3, a and b) with the exception of Syt2.
We also confirmed interactions between endogenous wild-type Htt and epitope-tagged Fmrp, Rbfox1, Myo5b, Myo6, and TLS in transfected Neuro-2a cells overexpressing the aforementioned proteins (Fig. 3, e and f). Fmrp represses the translation of mRNA to which it is bound until this translational repression is relieved (43). RbFox1 is also known as Ataxin 2-binding protein 1 (A2bp1) and participates in alternative splicing (44). Curiously, RbFox1 forms cytoplasmic aggregates when overexpressed in yeast (45). Myo5b is involved in membrane protein recycling to the plasma membrane via its interactions with Rab8a and other Rab GTPases (46). Myo6 transports brain-derived neurotrophic factor (BDNF)-activated tyrosine kinase receptor B (TrkB) receptors from dendritic spines toward the cell interior and is required for BDNF-enhanced long-term potentiation (47). Importantly, anti-Htt antibody immunoprecipitations from detergent-soluble extracts of non-FLAG-tagged wild-type (Fig. 3g, +/+) and homozygous mutant (Fig. 3g, 140Q/140Q) mouse brains confirmed the Htt-Myo5a and Htt-Rps6 interactions, despite reduced recovery compared with FLAG affinity purification (compare unbound fractions in supplemental Fig. S1a with Fig. 3g). Cumulatively, these data (Fig. 3, c–g) support the conclusions drawn from the mass spectrometry and suggest that many new bona fide Htt-interacting proteins were identified in our purifications.
Mutant Htt Purifications Implicate Altered RNA Metabolism
We have previously demonstrated that wild-type Htt functions with argonaute 2 (Ago2, the catalytic component of the RNA-induced silencing complex) in a post-transcriptional gene silencing pathway (14) and is also involved in RNA transport in cultured cortical neurons (48, 49). The current study points to Htt function in protein synthesis through its interactions with ribosomal proteins, various translation initiation factors, and other accessory proteins. We attempted to confirm this new role for Htt through polysome profiling and Western blot analysis of 7Q and 140Q mouse brain extracts. If Htt associates with ribosomes, then we may expect Htt to co-migrate with single ribosomes or polysomes (assessed by 254 nm absorbance) in a sucrose density gradient. If Htt is present in ribosome-containing complexes, then disassembly of ribosomes via the addition of EDTA (50) should disrupt this interaction and lead to a reduction in the density of Htt complexes. This could appear as a reduction in the amount of Htt present in heavier gradient fractions with a concomitant increase in Htt levels in lighter portions of the gradient. Polysome and Western blot analysis of untreated 7Q brain cytoplasmic extracts (Fig. 4a, red trace) demonstrates the presence of intact polyribosomes. The addition of EDTA to the extract before centrifugation resulted in the disappearance of the polyribosomal trace and a collapsing of the RNA absorbance signal to lighter fractions (Fig. 4a, black trace), which indicates that ribosome disassembly was nearly complete. As predicted for the ribosomal-associated proteins Gnb2l1 and Csda (40, 51), ribosome disassembly (EDTA pretreatment) caused a dramatic shift in the mobility of these proteins into lighter portions of the gradient (Fig. 4a, compare red boxed blots to black boxed). EDTA treatment of cytoplasmic 7Q extracts resulted in a loss of FLAG-Htt signal from fractions 8–11 (polyribosome-containing) and an increase in Htt signal in fraction 3 compared with the untreated control (Fig. 4a, 7Q/7Q, compare upper and lower FLAG blots). This suggests that 7Q sedimentation into more dense portions of the gradient depends on the presence of ribosomes and thereby supports the results of the mass spectrometry. These observations were reproduced by identical analysis of normal mouse brains (wild-type mice, no FLAG tag). 140Q cytoplasmic extracts analyzed in this manner display a similar pattern of RNA distribution (Fig. 4a, 140Q/+). Western blot analysis showed that140Q did not co-migrate with large polyribosomes, which was surprising given the large numbers of ribosomal and associated proteins present in 140Q S2 purifications. Furthermore, EDTA addition to 140Q cytoplasmic extracts only resulted in a small increase in the amount of mutant Htt found in lighter portions of the gradient and a similar magnitude reduction in the amount of mutant Htt found in fraction 5 (Fig. 4b, compare the upper and lower FLAG blots). Translation factors have a modifying effect on the aggregation and toxicity of N-terminal fragment-based models of mutant Htt toxicity in Caenorhabditis elegans and Saccharomyces cerevisiae (52, 53). The differences in sedimentation profiles, mass spectrometry-identified protein associations, and the modifying effect that translation proteins have on mutant Htt toxicity in model systems suggest that mutant Htt may affect translation.
FIGURE 4.

Htt associates with ribosomes. a, shown are polysome profiles of cytoplasmic wild-type (7Q/7Q) and mutant (140Q/+) mouse brain extracts with (black traces) or without (red traces) EDTA pretreatment. The x axis shows the position in the gradient (left = top), and the y axis shows the 254-nm absorbance. The numbers below the traces indicate sample fraction in Western blot analyses shown below. The colors of the boxes surrounding the Western blot images correspond to the traces (red = untreated, black = EDTA treatment). b, fluorescent micrographs show the localization of Htt (green) with respect to the stress granule marker protein Tia1 (red) in wild-type (STHdh7Q/7Q) and mutant (STHdh111Q111Q) arsenite-stressed striatal precursor cells. Cells were treated with 0.5 mm arsenite in complete media for 1 h at 33 °C before fixation. c, overexpression of full-length wild-type (Htt17Q) or mutant Htt (Htt75Q) in HeLa cells inhibits the translation capacity of extracts prepared from these cells. Extracts derived from untransfected (Control) and GFP-, Htt17Q-, and Htt75Q-transfected cells were programmed with in vitro transcribed 5′m7G-capped and polyadenylated firefly luciferase mRNA, and translation was assessed by luminescence after 1 h at 37 °C (unmixed extracts, black bars with S.D.). Translational activity could be partially restored by mixing transfected cell extracts 1:1 with control extract (1:1 mixed extract, gray bars with S.D.). The control 1:1 mixed extract was diluted 1:1 with lysis buffer alone. The Western blots confirm overexpression of the indicated proteins and equal protein content in extracts. The lack of phospho-Eif2α signal in Htt17Q and Htt75Q extracts indicates that translation was not inhibited as part of a general stress response mechanism. Arsenite-treated (Tx) HeLa lysate serves as a positive control for the antibody.
Mitochondrial dysfunction has been suggested as a possible mechanism to account for the specific pattern of cell loss encountered in HD (54, 55). Not only are electron transport chain activities reduced in HD, but electron transport chain inhibitors can, when administered systemically in rodents and non-human primates, cause patterns of cell loss similar to what is observed in HD. Inhibition of electron transport chain activity elevates levels of cellular reactive oxygen species, which can then trigger the stress response pathway. Increases in cellular oxidative stress lead to an inhibition of cap-dependent mRNA translation and can be microscopically manifested by the appearance of stress granules (56). Stress granules are thought to sequester mRNAs away from a potentially damaging cytoplasmic environment, to serve as a repository for mRNAs that are not being translated or to allow the mRNAs encoding stress responsive proteins to be more efficiently translated (57). Stress granule assembly depends on the inhibition of mRNA translation. This inhibition can occur through the activity of the protein kinase PKR (58), which is present and active at elevated levels in HD patient brains (59). PKR activity is directly regulated by Prkra (41), which was present in Htt purifications and more abundant in 140Q samples than in 7Q samples. These data suggest that the stress response pathway may be relevant to HD. If Htt is involved in the stress response pathway, then it may be present in stress granules, one of the physical manifestations of this process. This possibility is suggested not only from the Prkra association but also from the numerous proteins involved in stress granule assembly identified in our purifications (Fmrp, cell cycle-associated protein 1 (Caprin1), G3bp1, 40 S ribosomal proteins, and translation initiation factors, supplemental Tables S3 and S4).
We tested for Htt-stress granule association by subjecting wild-type and mutant Htt-expressing striatal precursor cells (STHdh7Q/7Q and STHdh111Q/111Q, respectively) (60) to a common stress granule induction paradigm (arsenite exposure) and then examined the localization of Htt with respect to the stress granule marker protein Tia1 by confocal microscopy. Both wild-type and mutant Htt localized to stress granules upon arsenite treatment (Fig. 4b). Neither wild-type nor mutant Htt appreciably co-localized with Tia1 in the absence of added metabolic stress (Ref. 14 and data not shown). These data support the observations from the proteomic analysis suggesting a role for Htt in RNA metabolism. It also shows that stress granule formation is not impaired by mutant Htt expression. We analyzed arsenite-treated Htt null mouse ES cells (cells from Ref. 61) and found that Htt is dispensable for stress granule assembly (data not shown). Therefore, although Htt may localize to stress granules, it is not required for their assembly.
Lastly, we investigated a functional link between Htt and mRNA translation using an in vitro translation system based on HeLa cell extracts (28). We tested the effect of overexpression of full-length wild-type or mutant Htt protein on the translation of a 5′m7G-capped and polyadenylated luciferase reporter mRNA. We controlled for the general effects of protein overexpression in this system by concurrently performing in vitro translations with extracts from GFP-overexpressing cells and untransfected (control) cells. All extracts were treated with micrococcal nuclease before in vitro translation to eliminate cellular transcripts; therefore, any differences in luciferase mRNA translation are most likely to result from the translational capacity of the extract. Overexpression of either full-length wild-type (Htt17Q) or mutant Htt (Htt75Q) strongly reduced luciferase expression in these assays (Fig. 4c, Htt17Q and Htt75Q, black bars). Some of this reduction may be attributable to the generally repressive effects of protein overexpression on this system (Fig. 4c, GFP, black bars). We wondered whether Htt17Q and Htt75Q samples were at all capable of supporting translation. To simply address this, we mixed untransfected cell extract with lysis buffer (control), GFP, Htt17Q, or Htt75Q extracts at a 1:1 ratio. 1:1 mixtures of control extract with GFP, Htt17Q, and Htt75Q all increased the translational output of these reactions over the unmixed samples (Fig. 4c, gray bars). The control extract could, therefore, supply a missing component(s) or dilute out an inhibitory factor(s) present within the overexpression extracts. Translation initiation is controlled by the activity of Eif2α. Phosphorylation of this protein on serine 51 prevents it from functioning in this process (62) and, hence, globally impairs translation initiation. Only the extract derived from GFP-expressing cells had elevated levels of phosphorylated Eif2α compared with the control (Fig. 4c, GFP), which could account for the modest translational impairment of the extract. A whole cell lysate from arsenite-treated HeLa cells served as a positive control for the phospho-Eif2α antibody (Fig. 4c, Arsenite Tx HeLa lysate). The lack of phosphorylated Eif2α in Htt17Q and Htt75Q extracts suggests that Htt overexpression inhibits translation independent of Eif2α function. Importantly, these Western blots also demonstrate equal protein content in the four tested extracts and rule out differences in protein concentration as contributing to translational capacity. The lack of phosphorylated Eif2α agrees with the co-migration of Htt with polysomes in brain extracts and suggests that Htt may act to impair translation downstream of initiation.
DISCUSSION
Previous studies aimed at identifying Htt-associated proteins have relied on yeast two-hybrid or other experimental strategies that use the overexpression of a fragment of the Htt protein as bait. We employed an in vivo system that uses full-length wild-type or mutant Htt expressed from the endogenous promoter. Notably, we have carried out these experiments using brains from juvenile mice as the starting material, the most relevant sample source in terms of cells affected and molecular environments. Although FLAG-tagged HTT mouse brains had more nuclear Htt than their untagged counterparts, the nuclear fraction was not analyzed in our study, and the levels and distribution of Htt in the other fractions were highly similar between FLAG-tagged and untagged HTT mouse lines. It is possible that increased levels of FLAG-Htt in the nucleus subtly alter the function and/or protein interactions of Htt. Nonetheless, FLAG-HTT mice and their untagged counterparts exhibit similar behaviors and phenotypic progression.5 One-month-old 140Q/+ mice displayed behaviors suggestive of hyper-excitability, which subsequently decreased with age (rearing and exploratory behaviors) (30). These altered behaviors preceded any overt pathology: lack of significant Htt nuclear accumulation, aggregation, cell loss, or reduced levels of the striatal marker protein DARPP-32 (29, 30). This suggests that even at this early age, the mutant Htt allele exerts an effect on normal brain function that could contribute to the more dramatic later stage outcomes. Indeed, the vastly different protein compositions of 7Q- and 140Q-purified complexes support this hypothesis and argue that very early differences in protein associations contribute to observed behaviors and possibly later pathology. Follow-up in vivo studies on individual neurons or groups of neurons in juvenile 140Q/+ mouse brain could help determine if altered electrical behavior or connectivity contributes to the phenotypes.
We used label-free MS/MS spectral counts as a semiquantitative measure of protein abundance (63). In label-free proteomic analysis, samples are compared with each other after independent analysis (16). Each spectral count requires an identification (MS/MS) and thus may result in compressed measurements as only relatively small integer values are generated (64). Isotopic labeled approaches also have their strengths and weaknesses. We and others have used 15N stable isotope metabolic labeling as an internal standard in quantitative proteomic experiments; however, such experiments can be prohibitively expensive (65, 66). Another option would be to use isotopomer labels, commonly referred to as “tandem mass tags,” which are applied to peptide samples separately, then are mixed and analyzed simultaneously in the mass spectrometer. Tandem mass tag labels benefit from reporting protein abundance from multiple samples in the same analysis, but generate data sets that can be challenging to normalize. They also suffer from the limitation that proteins found in all samples are most likely to be analyzed as all channels contribute to the same MS1 peak intensity (67). Our semiquantitative analysis with spectral counts highlighted candidate Htt-interacting proteins, which were then validated with Western blot analysis. Because there is no mixing of labeled samples in our approach, we could achieve greater proteome coverage in our analysis (68). In the process of our experiments we also analyzed our Htt purifications with label-free MS1 peak quantitation with Census (69) and found similar protein measurements as was found using spectral counts (data not shown).
We reduced the considerable number of nonspecific protein detections through the use of extensive control purifications and stringent filtering criteria. The lists of candidate 7Q- and 140Q-interacting proteins were based on a small sample size (three for each genotype and each fraction) and could change if more trials were performed and more information for each protein was made available. The Pearson correlation coefficient (r) provides a more confident measure of co-variation with increasing sample size; therefore, the utility of this value is not in and of itself enough to define candidate Htt-interacting proteins. For this reason we also included an arbitrarily set level of enrichment over the negative control as defined by spectral counts to minimize the amount of falsely called Htt-interacting proteins. These steps generated lists of candidate 7Q- and 140Q-interacting proteins containing previously reported interactions and a larger number of unreported interactions. Most of the Htt-interacting proteins are in shared molecular pathways or have been previously reported to interact with each other. The strongest Htt candidate interacting proteins are those with high levels of enrichment over the negative control, those that appeared in the most runs (S2 and P2 purifications combined), those with highly positive r values, and those confirmed by co-immunoprecipitation and Western blotting. We suggest that the reader keep this in mind when examining the lists of candidate interacting proteins.
The data generated from our purifications expand upon our earlier studies (14, 48, 49) by identifying a link between Htt and translation. Both wild-type and mutant Htt co-purify with several translation-related proteins, co-fractionate with ribosomes, localize to stress granules, and inhibit translation when overexpressed in an in vitro assay. These observations are supported by genetic interaction screens where shRNA-mediated knockdown of proteins involved in protein synthesis enhanced aggregation of a polyglutamine-expanded N-terminal Htt fragment (53), which is in one way or another tied to disease outcome (70). This connection between HD and translation is further supported by the observation that the level of the kinase PKR, an inhibitor of cap-dependent translation, is elevated in HD patient brains (59). Interestingly, we identified Prkra (PACT), the kinase responsible for activating PKR, in our purifications. Statistical analysis of the spectral counts for Prkra as well as Western blot of Htt purifications showed that this protein was more abundant in mutant Htt purifications than wild type. Despite these ties to a kinase (PKR) capable of phosphorylating Eif2α, we did not observe any phospho-Eif2α in translation extracts from cells transiently overexpressing mutant Htt (Fig. 4c). PKR has been reported to bind to CAG-expanded mutant Htt mRNA (59), suggesting that the mutant Htt mRNA alone could trigger its translational arrest activity. It is possible that prolonged expression of mutant Htt mRNA could trigger cap-dependent translational impairment through activation of PKR and phosphorylation of Eif2α. Cumulatively, these data support an inhibitory role for Htt in protein synthesis. Future studies should seek to clarify the nature of wild-type and mutant Htt involvement in this process and sort out any link between Prkra, PKR, and Htt in translation.
The results of the current study suggest that post-transcriptional RNA metabolic processes may be altered by mutant Htt expression and go beyond our previous studies in its implication of Htt in regulating mRNA translation. The multitude of published Htt interactions in diverse cellular processes and the new ones reported herein support a scaffolding function for the protein. Htt likely functions to facilitate interactions between different proteins and integrates different pathways. Mutant Htt, either through abnormal protein interactions, loss of interactions, or both, causes cellular dysfunction or death. Positioning Htt as a “hub” in an extensive protein-protein interaction network could help to explain its roles in all of these processes. In some instances loss-of-function effects may perturb a process, whereas in others, gain-of-function (through abnormal protein-protein interactions) could alter a process. The evidence suggests that multiple processes are perturbed in HD, and whereas one may most directly lead to the disease, it is also possible that the confluence of these defects causes the specifics of the disease.
Acknowledgments
We thank Moses Chao, Ian Mohr, and Angus Wilson (NYU School of Medicine) for help with reagents and critical reading of the manuscript, M. H. Jones (University of Colorado, Boulder, CO) for helpful comments regarding the manuscript, and M. McBryde, M.-S. Yu, J. DeClercq, and B. Ma for helpful discussions.
This work was supported, in whole or in part, by National Institutes of Health Grants R01 NS061917 (to N. T.) and R01 MH067880-09, P01 AG031097-03, and P41 RR011823-14 (to J. R. Y.), and Shared Instrumentation Grant S10 RR017970. This work was also supported by the CHDI Foundation, Inc. (to N. T.).

This article contains supplemental Tables S1–S5 and Figs. S1 and S2.
S. Zheng, N. Ghitani, J. S. Blackburn, J.-P. Liu, and S. O. Zeitlin, manuscript submitted.
S. O. Zeitlin, unpublished information.
- HD
- Huntington disease
- Htt
- huntingtin
- GO analysis
- Gene Ontology analysis
- Fmrp
- fragile X mental retardation protein
- PKR
- double-stranded RNA-activated protein kinase
- Prkra
- interferon-inducible double-stranded RNA-dependent protein kinase activator A
- Rps6
- ribosomal protein S6
- Myo5a
- myosin VA
- Gnb2l1
- guanine nucleotide-binding protein (G protein), β polypeptide 2-like 1
- Syt2
- synaptotagmin II
- TLS
- translocated in liposarcoma protein
- Rbfox1
- RNA-binding protein, fox-1 homolog (C. elegans) 1
- Csda
- cold shock domain protein A
- Eif2α
- eukaryotic translation initiation factor 2, subunit 1 α
- ANOVA
- analysis of variance.
REFERENCES
- 1. Roos R. A. (2010) Huntington's disease. A clinical review. Orphanet. J. Rare Dis. 5, 40. [DOI] [PMC free article] [PubMed] [Google Scholar]
- 2. Imarisio S., Carmichael J., Korolchuk V., Chen C. W., Saiki S., Rose C., Krishna G., Davies J. E., Ttofi E., Underwood B. R., Rubinsztein D. C. (2008) Huntington's disease. From pathology and genetics to potential therapies. Biochem. J. 412, 191–209 [DOI] [PubMed] [Google Scholar]
- 3. Crook Z. R., Housman D. (2011) Huntington's disease. Can mice lead the way to treatment? Neuron 69, 423–435 [DOI] [PMC free article] [PubMed] [Google Scholar]
- 4. Faber P. W., Barnes G. T., Srinidhi J., Chen J., Gusella J. F., MacDonald M. E. (1998) Huntingtin interacts with a family of WW domain proteins. Hum. Mol. Genet. 7, 1463–1474 [DOI] [PubMed] [Google Scholar]
- 5. Faber P. W., Voisine C., King D. C., Bates E. A., Hart A. C. (2002) Glutamine/proline-rich PQE-1 proteins protect Caenorhabditis elegans neurons from huntingtin polyglutamine neurotoxicity. Proc. Natl. Acad. Sci. U.S.A. 99, 17131–17136 [DOI] [PMC free article] [PubMed] [Google Scholar]
- 6. Goehler H., Lalowski M., Stelzl U., Waelter S., Stroedicke M., Worm U., Droege A., Lindenberg K. S., Knoblich M., Haenig C., Herbst M., Suopanki J., Scherzinger E., Abraham C., Bauer B., Hasenbank R., Fritzsche A., Ludewig A. H., Büssow K., Buessow K., Coleman S. H., Gutekunst C. A., Landwehrmeyer B. G., Lehrach H., Wanker E. E. (2004) A protein interaction network links GIT1, an enhancer of huntingtin aggregation, to Huntington's disease. Mol. Cell 15, 853–865 [DOI] [PubMed] [Google Scholar]
- 7. Holbert S., Denghien I., Kiechle T., Rosenblatt A., Wellington C., Hayden M. R., Margolis R. L., Ross C. A., Dausset J., Ferrante R. J., Néri C. (2001) The Gln-Ala repeat transcriptional activator CA150 interacts with huntingtin. Neuropathologic and genetic evidence for a role in Huntington's disease pathogenesis. Proc. Natl. Acad. Sci. U.S.A. 98, 1811–1816 [DOI] [PMC free article] [PubMed] [Google Scholar]
- 8. Kaltenbach L. S., Romero E., Becklin R. R., Chettier R., Bell R., Phansalkar A., Strand A., Torcassi C., Savage J., Hurlburt A., Cha G. H., Ukani L., Chepanoske C. L., Zhen Y., Sahasrabudhe S., Olson J., Kurschner C., Ellerby L. M., Peltier J. M., Botas J., Hughes R. E. (2007) Huntingtin interacting proteins are genetic modifiers of neurodegeneration. PLoS Genet. 3, e82. [DOI] [PMC free article] [PubMed] [Google Scholar]
- 9. Li X. J., Li S. H., Sharp A. H., Nucifora F. C., Jr., Schilling G., Lanahan A., Worley P., Snyder S. H., Ross C. A. (1995) A huntingtin-associated protein enriched in brain with implications for pathology. Nature 378, 398–402 [DOI] [PubMed] [Google Scholar]
- 10. Mitsui K., Nakayama H., Akagi T., Nekooki M., Ohtawa K., Takio K., Hashikawa T., Nukina N. (2002) Purification of polyglutamine aggregates and identification of elongation factor-1α and heat shock protein 84 as aggregate-interacting proteins. J. Neurosci. 22, 9267–9277 [DOI] [PMC free article] [PubMed] [Google Scholar]
- 11. Passani L. A., Bedford M. T., Faber P. W., McGinnis K. M., Sharp A. H., Gusella J. F., Vonsattel J. P., MacDonald M. E. (2000) Huntingtin's WW domain partners in Huntington's disease post-mortem brain fulfill genetic criteria for direct involvement in Huntington's disease pathogenesis. Hum. Mol. Genet. 9, 2175–2182 [DOI] [PubMed] [Google Scholar]
- 12. Wanker E. E., Rovira C., Scherzinger E., Hasenbank R., Wälter S., Tait D., Colicelli J., Lehrach H. (1997) HIP-I. A huntingtin interacting protein isolated by the yeast two-hybrid system. Hum. Mol. Genet. 6, 487–495 [DOI] [PubMed] [Google Scholar]
- 13. Yamamoto A., Cremona M. L., Rothman J. E. (2006) Autophagy-mediated clearance of huntingtin aggregates triggered by the insulin-signaling pathway. J. Cell Biol. 172, 719–731 [DOI] [PMC free article] [PubMed] [Google Scholar]
- 14. Savas J. N., Makusky A., Ottosen S., Baillat D., Then F., Krainc D., Shiekhattar R., Markey S. P., Tanese N. (2008) Huntington's disease protein contributes to RNA-mediated gene silencing through association with Argonaute and P bodies. Proc. Natl. Acad. Sci. U.S.A. 105, 10820–10825 [DOI] [PMC free article] [PubMed] [Google Scholar]
- 15. Washburn M. P., Wolters D., Yates J. R., 3rd (2001) Large-scale analysis of the yeast proteome by multidimensional protein identification technology. Nat. Biotechnol. 19, 242–247 [DOI] [PubMed] [Google Scholar]
- 16. Liu H., Sadygov R. G., Yates J. R., 3rd (2004) A model for random sampling and estimation of relative protein abundance in shotgun proteomics. Anal. Chem. 76, 4193–4201 [DOI] [PubMed] [Google Scholar]
- 17. Bern M., Goldberg D., McDonald W. H., Yates J. R., 3rd (2004) Automatic quality assessment of peptide tandem mass spectra. Bioinformatics 20, i49–54 [DOI] [PubMed] [Google Scholar]
- 18. Peng J., Elias J. E., Thoreen C. C., Licklider L. J., Gygi S. P. (2003) Evaluation of multidimensional chromatography coupled with tandem mass spectrometry (LC/LC-MS/MS) for large-scale protein analysis. The yeast proteome. J. Proteome Res. 2, 43–50 [DOI] [PubMed] [Google Scholar]
- 19. Sadygov R. G., Eng J., Durr E., Saraf A., McDonald H., MacCoss M. J., Yates J. R., 3rd (2002) Code developments to improve the efficiency of automated MS/MS spectra interpretation, J. Proteome Res. 1, 211–215 [DOI] [PubMed] [Google Scholar]
- 20. Eng J., McCormack A. L., Yates J. R., 3rd (1994) An approach to correlate tandem mass spectral data of peptides with amino acid sequences in a protein database, J. Am. Soc. Mass Spectrom. 5, 976–989 [DOI] [PubMed] [Google Scholar]
- 21. Tabb D. L., McDonald W. H., Yates J. R., 3rd (2002) DTASelect and Contrast. Tools for assembling and comparing protein identifications from shotgun proteomics. J. Proteome Res. 1, 21–26 [DOI] [PMC free article] [PubMed] [Google Scholar]
- 22. MacCoss M. J., McDonald W. H., Saraf A., Sadygov R., Clark J. M., Tasto J. J., Gould K. L., Wolters D., Washburn M., Weiss A., Clark J. I., Yates J. R., 3rd (2002) Shotgun identification of protein modifications from protein complexes and lens tissue. Proc. Natl. Acad. Sci. U.S.A. 99, 7900–7905 [DOI] [PMC free article] [PubMed] [Google Scholar]
- 23. Mi H., Thomas P. (2009) PANTHER pathway. An ontology-based pathway database coupled with data analysis tools. Methods Mol. Biol. 563, 123–140 [DOI] [PMC free article] [PubMed] [Google Scholar]
- 24. Thomas P. D., Campbell M. J., Kejariwal A., Mi H., Karlak B., Daverman R., Diemer K., Muruganujan A., Narechania A. (2003) PANTHER. A library of protein families and subfamilies indexed by function. Genome Res 13, 2129–2141 [DOI] [PMC free article] [PubMed] [Google Scholar]
- 25. Trottier Y., Devys D., Imbert G., Saudou F., An I., Lutz Y., Weber C., Agid Y., Hirsch E. C., Mandel J. L. (1995) Cellular localization of the Huntingtons disease protein and discrimination of the normal and mutated form. Nat. Genet. 10, 104–110 [DOI] [PubMed] [Google Scholar]
- 26. Iizuka N., Najita L., Franzusoff A., Sarnow P. (1994) Cap-dependent and Cap-independent translation by internal initiation of messenger RNAs in cell extracts prepared from Saccharomyces cerevisiae. Mol. Cell. Biol. 14, 7322–7330 [DOI] [PMC free article] [PubMed] [Google Scholar]
- 27. Darnell J. C., Fraser C. E., Mostovetsky O., Stefani G., Jones T. A., Eddy S. R., Darnell R. B. (2005) Kissing complex RNAs mediate interaction between the fragile -X mental retardation protein KH2 domain and brain polyribosomes. Genes Dev. 19, 903–918 [DOI] [PMC free article] [PubMed] [Google Scholar]
- 28. Rakotondrafara A. M., Hentze M. W. (2011) An efficient factor-depleted mammalian in vitro translation system. Nat. Protoc. 6, 563–571 [DOI] [PubMed] [Google Scholar]
- 29. Hickey M. A., Kosmalska A., Enayati J., Cohen R., Zeitlin S., Levine M. S., Chesselet M. F. (2008) Extensive early motor and non-motor behavioral deficits are followed by striatal neuronal loss in knock-in Huntington's disease mice. Neuroscience 157, 280–295 [DOI] [PMC free article] [PubMed] [Google Scholar]
- 30. Menalled L. B., Sison J. D., Dragatsis I., Zeitlin S., Chesselet M. F. (2003) Time course of early motor and neuropathological anomalies in a knock-in mouse model of Huntington's disease with 140 CAG repeats. J. Comp. Neurol. 465, 11–26 [DOI] [PubMed] [Google Scholar]
- 31. DiFiglia M., Sapp E., Chase K., Schwarz C., Meloni A., Young C., Martin E., Vonsattel J. P., Carraway R., Reeves S. A. (1995) Huntingtin is a cytoplasmic protein associated with vesicles in human and rat brain neurons. Neuron 14, 1075–1081 [DOI] [PubMed] [Google Scholar]
- 32. Hoogeveen A. T., Willemsen R., Meyer N., de Rooij K. E., Roos R. A., van Ommen G. J., Galjaard H. (1993) Characterization and localization of the Huntington disease gene product. Hum. Mol. Genet. 2, 2069–2073 [DOI] [PubMed] [Google Scholar]
- 33. Hallett P. J., Collins T. L., Standaert D. G., Dunah A. W. (2008) Biochemical fractionation of brain tissue for studies of receptor distribution and trafficking. Curr. Protoc. Neurosci. Chapter 1, Unit 1.16 [DOI] [PubMed] [Google Scholar]
- 34. Caviston J. P., Holzbaur E. L. (2009) Huntingtin as an essential integrator of intracellular vesicular trafficking. Trends Cell Biol. 19, 147–155 [DOI] [PMC free article] [PubMed] [Google Scholar]
- 35. Velier J., Kim M., Schwarz C., Kim T. W., Sapp E., Chase K., Aronin N., DiFiglia M. (1998) Wild-type and mutant huntingtins function in vesicle trafficking in the secretory and endocytic pathways. Exp. Neurol. 152, 34–40 [DOI] [PubMed] [Google Scholar]
- 36. Atwal R. S., Xia J., Pinchev D., Taylor J., Epand R. M., Truant R. (2007) Huntingtin has a membrane association signal that can modulate huntingtin aggregation, nuclear entry, and toxicity. Hum. Mol. Genet. 16, 2600–2615 [DOI] [PubMed] [Google Scholar]
- 37. Choo Y. S., Johnson G. V., MacDonald M., Detloff P. J., Lesort M. (2004) Mutant huntingtin directly increases susceptibility of mitochondria to the calcium-induced permeability transition and cytochrome c release. Hum. Mol. Genet. 13, 1407–1420 [DOI] [PubMed] [Google Scholar]
- 38. Bai F., Witzmann F. A. (2007) Synaptosome proteomics. Subcell. Biochem. 43, 77–98 [DOI] [PMC free article] [PubMed] [Google Scholar]
- 39. Kanai Y., Dohmae N., Hirokawa N. (2004) Kinesin transports RNA. Isolation and characterization of an RNA-transporting granule. Neuron 43, 513–525 [DOI] [PubMed] [Google Scholar]
- 40. Angenstein F., Evans A. M., Settlage R. E., Moran S. T., Ling S. C., Klintsova A. Y., Shabanowitz J., Hunt D. F., Greenough W. T. (2002) A receptor for activated C kinase is part of messenger ribonucleoprotein complexes associated with polyA-mRNAs in neurons. J. Neurosci. 22, 8827–8837 [DOI] [PMC free article] [PubMed] [Google Scholar]
- 41. Patel R. C., Sen G. C. (1998) PACT, a protein activator of the interferon-induced protein kinase. PKR. EMBO J. 17, 4379–4390 [DOI] [PMC free article] [PubMed] [Google Scholar]
- 42. Yoshimura A., Fujii R., Watanabe Y., Okabe S., Fukui K., Takumi T. (2006) Myosin-Va facilitates the accumulation of mRNA/protein complex in dendritic spines. Curr. Biol. 16, 2345–2351 [DOI] [PubMed] [Google Scholar]
- 43. Antar L. N., Bassell G. J. (2003) Sunrise at the synapse. The FMRP mRNP shaping the synaptic interface. Neuron 37, 555–558 [DOI] [PubMed] [Google Scholar]
- 44. Lee J. A., Tang Z. Z., Black D. L. (2009) An inducible change in Fox-1/A2BP1 splicing modulates the alternative splicing of downstream neuronal target exons. Genes Dev. 23, 2284–2293 [DOI] [PMC free article] [PubMed] [Google Scholar]
- 45. Couthouis J., Hart M. P., Shorter J., DeJesus-Hernandez M., Erion R., Oristano R., Liu A. X., Ramos D., Jethava N., Hosangadi D., Epstein J., Chiang A., Diaz Z., Nakaya T., Ibrahim F., Kim H. J., Solski J. A., Williams K. L., Mojsilovic-Petrovic J., Ingre C., Boylan K., Graff-Radford N. R., Dickson D. W., Clay-Falcone D., Elman L., McCluskey L., Greene R., Kalb R. G., Lee V. M., Trojanowski J. Q., Ludolph A., Robberecht W., Andersen P. M., Nicholson G. A., Blair I. P., King O. D., Bonini N. M., Van Deerlin V., Rademakers R., Mourelatos Z., Gitler A. D. (2011) A yeast functional screen predicts new candidate ALS disease genes. Proc. Natl. Acad. Sci. U.S.A. 108, 20881–20890 [DOI] [PMC free article] [PubMed] [Google Scholar]
- 46. Roland J. T., Bryant D. M., Datta A., Itzen A., Mostov K. E., Goldenring J. R. (2011) Rab GTPase-Myo5B complexes control membrane recycling and epithelial polarization. Proc. Natl. Acad. Sci. U.S.A. 108, 2789–2794 [DOI] [PMC free article] [PubMed] [Google Scholar]
- 47. Yano H., Ninan I., Zhang H., Milner T. A., Arancio O., Chao M. V. (2006) BDNF-mediated neurotransmission relies upon a myosin VI motor complex. Nat. Neurosci. 9, 1009–1018 [DOI] [PubMed] [Google Scholar]
- 48. Ma B., Culver B. P., Baj G., Tongiorgi E., Chao M. V., Tanese N. (2010) Localization of BDNF mRNA with the Huntington's disease protein in rat brain. Mol. Neurodegener. 5, 22. [DOI] [PMC free article] [PubMed] [Google Scholar]
- 49. Savas J. N., Ma B., Deinhardt K., Culver B. P., Restituito S., Wu L., Belasco J. G., Chao M. V., Tanese N. (2010) A role for huntington disease protein in dendritic RNA granules. J. Biol. Chem. 285, 13142–13153 [DOI] [PMC free article] [PubMed] [Google Scholar]
- 50. Silman N., Artman M., Engleberg H. (1965) Effect of magnesium and spermine on the aggregation of bacterial and mammalian ribosomes. Biochim. Biophys. Acta 103, 231–240 [DOI] [PubMed] [Google Scholar]
- 51. Coles L. S., Bartley M. A., Bert A., Hunter J., Polyak S., Diamond P., Vadas M. A., Goodall G. J. (2004) A multiprotein complex containing cold shock domain (Y-box) and polypyrimidine tract-binding proteins forms on the vascular endothelial growth factor mRNA. Potential role in mRNA stabilization. Eur. J. Biochem. 271, 648–660 [DOI] [PubMed] [Google Scholar]
- 52. Tauber E., Miller-Fleming L., Mason R. P., Kwan W., Clapp J., Butler N. J., Outeiro T. F., Muchowski P. J., Giorgini F. (2011) Functional gene expression profiling in yeast implicates translational dysfunction in mutant huntingtin toxicity. J. Biol. Chem. 286, 410–419 [DOI] [PMC free article] [PubMed] [Google Scholar]
- 53. Teuling E., Bourgonje A., Veenje S., Thijssen K., de Boer J., van der Velde J., Swertz M., Nollen E. (2011) Modifiers of mutant huntingtin aggregation. Functional conservation of C. elegans-modifiers of polyglutamine aggregation. PLoS Curr. 3, RRN1255. [DOI] [PMC free article] [PubMed] [Google Scholar]
- 54. Brouillet E., Hantraye P., Ferrante R. J., Dolan R., Leroy-Willig A., Kowall N. W., Beal M. F. (1995) Chronic mitochondrial energy impairment produces selective striatal degeneration and abnormal choreiform movements in primates. Proc. Natl. Acad. Sci. U.S.A. 92, 7105–7109 [DOI] [PMC free article] [PubMed] [Google Scholar]
- 55. Gu M., Gash M. T., Mann V. M., Javoy-Agid F., Cooper J. M., Schapira A. H. (1996) Mitochondrial defect in Huntington's disease caudate nucleus. Ann. Neurol. 39, 385–389 [DOI] [PubMed] [Google Scholar]
- 56. Kedersha N. L., Gupta M., Li W., Miller I., Anderson P. (1999) RNA-binding proteins TIA-1 and TIAR link the phosphorylation of eIF-2α to the assembly of mammalian stress granules. J. Cell Biol. 147, 1431–1442 [DOI] [PMC free article] [PubMed] [Google Scholar]
- 57. Buchan J. R., Parker R. (2009) Eukaryotic stress granules. The ins and outs of translation. Mol. Cell 36, 932–941 [DOI] [PMC free article] [PubMed] [Google Scholar]
- 58. Colthurst D. R., Campbell D. G., Proud C. G. (1987) Structure and regulation of eukaryotic initiation factor eIF-2. Sequence of the site in the α-subunit phosphorylated by the haem-controlled repressor and by the double-stranded RNA-activated inhibitor. Eur. J. Biochem. 166, 357–363 [DOI] [PubMed] [Google Scholar]
- 59. Peel A. L., Rao R. V., Cottrell B. A., Hayden M. R., Ellerby L. M., Bredesen D. E. (2001) Double-stranded RNA-dependent protein kinase, PKR, binds preferentially to Huntington's disease (HD) transcripts and is activated in HD tissue. Hum. Mol. Genet. 10, 1531–1538 [DOI] [PubMed] [Google Scholar]
- 60. Trettel F., Rigamonti D., Hilditch-Maguire P., Wheeler V. C., Sharp A. H., Persichetti F., Cattaneo E., MacDonald M. E. (2000) Dominant phenotypes produced by the HD mutation in STHdh(Q111) striatal cells. Hum. Mol. Genet. 9, 2799–2809 [DOI] [PubMed] [Google Scholar]
- 61. Zeitlin S., Liu J. P., Chapman D. L., Papaioannou V. E., Efstratiadis A. (1995) Increased apoptosis and early embryonic lethality in mice nullizygous for the Huntington's disease gene homologue. Nat. Genet. 11, 155–163 [DOI] [PubMed] [Google Scholar]
- 62. de Haro C., Méndez R., Santoyo J. (1996) The eIF-2α kinases and the control of protein synthesis. FASEB J. 10, 1378–1387 [DOI] [PubMed] [Google Scholar]
- 63. Choi H., Fermin D., Nesvizhskii A. I. (2008) Significance analysis of spectral count data in label-free shotgun proteomics. Mol. Cell. Proteomics 7, 2373–2385 [DOI] [PMC free article] [PubMed] [Google Scholar]
- 64. Lundgren D. H., Hwang S. I., Wu L., Han D. K. (2010) Role of spectral counting in quantitative proteomics. Expert Rev. Proteomics 7, 39–53 [DOI] [PubMed] [Google Scholar]
- 65. McClatchy D. B., Liao L., Park S. K., Venable J. D., Yates J. R. (2007) Quantification of the synaptosomal proteome of the rat cerebellum during post-natal development. Genome Res. 17, 1378–1388 [DOI] [PMC free article] [PubMed] [Google Scholar]
- 66. Savas J. N., Toyama B. H., Xu T., Yates J. R., 3rd, Hetzer M. W. (2012) Extremely long-lived nuclear pore proteins in the rat brain. Science 335, 942. [DOI] [PMC free article] [PubMed] [Google Scholar]
- 67. Thompson A., Schäfer J., Kuhn K., Kienle S., Schwarz J., Schmidt G., Neumann T., Johnstone R., Mohammed A. K., Hamon C. (2003) Tandem mass tags. A novel quantification strategy for comparative analysis of complex protein mixtures by MS/MS. Anal. Chem. 75, 1895–1904 [DOI] [PubMed] [Google Scholar]
- 68. Washburn M. P. (2011) Driving biochemical discovery with quantitative proteomics. Trends Biochem. Sci. 36, 170–177 [DOI] [PubMed] [Google Scholar]
- 69. Park S. K., Venable J. D., Xu T., Yates J. R., 3rd (2008) A quantitative analysis software tool for mass spectrometry-based proteomics. Nat. Methods 5, 319–322 [DOI] [PMC free article] [PubMed] [Google Scholar]
- 70. Bano D., Zanetti F., Mende Y., Nicotera P. (2011) Neurodegenerative processes in Huntington's disease. Cell Death Disease 2, e228. [DOI] [PMC free article] [PubMed] [Google Scholar]