

Background: The therapeutically relevant human α7 nicotinic acetylcholine receptor has a propensity to desensitize in a ligand-dependent manner.
Results: Mutants and agonists reveal likely point-to-point hydrogen bonding sensitivity for activation and/or desensitization.
Conclusion: Hydrogen bonding interactions affects the stability of specific receptor states.
Significance: The approach may facilitate development of state-selective compounds for nicotinic acetylcholine receptors.
Keywords: Cys-loop Receptors, Ion Channels, Molecular Pharmacology, Nicotinic Acetylcholine Receptors, Receptor Desensitization, Allosteric Modulation, Hydrogen Bonding
Abstract
A series of arylidene anabaseines were synthesized to probe the functional impact of hydrogen bonding on human α7 nicotinic acetylcholine receptor (nAChR) activation and desensitization. The aryl groups were either hydrogen bond acceptors (furans), donors (pyrroles), or neither (thiophenes). These compounds were tested against a series of point mutants of the ligand-binding domain residue Gln-57, a residue hypothesized to be proximate to the aryl group of the bound agonist and a putative hydrogen bonding partner. Q57K, Q57D, Q57E, and Q57L were chosen to remove the dual hydrogen bonding donor/acceptor ability of Gln-57 and replace it with hydrogen bond donating, hydrogen bond accepting, or nonhydrogen bonding ability. Activation of the receptor was compromised with hydrogen bonding mismatches, for example, pairing a pyrrole with Q57K or Q57L, or a furan anabaseine with Q57D or Q57E. Ligand co-applications with the positive allosteric modulator PNU-120596 produced significantly enhanced currents whose degree of enhancement was greater for 2-furans or -pyrroles than for their 3-substituted isomers, whereas the nonhydrogen bonding thiophenes failed to show this correlation. Interestingly, the PNU-120596 agonist co-application data revealed that for wild-type α7 nAChR, the 3-furan desensitized state was relatively stabilized compared with that of 2-furan, a reversal of the relationship observed with respect to the barrier for entry into the desensitized state. These data highlight the importance of hydrogen bonding on the receptor-ligand state, and suggest that it may be possible to fine-tune features of agonists that mediate state selection in the nAChR.
Introduction
The nicotinic acetylcholine receptor (nAChR)2 belongs to the large “cysteine-loop” superfamily of ligand-gated ion channels, which includes GABA, glycine, and serotonin receptors (1). The receptors span the cell membrane, and brief extracellular exposure to the neurotransmitter acetylcholine (ACh) may cause opening of the cation-selective pore with subsequent depolarization or signal transduction. Exposure to agonist will ultimately induce nonconducting (desensitized) states of the receptor (2–4). The nAChRs assemble as pentamers, and most are heteromeric, that is, they contain at least two different types of subunits to function. The agonist binding sites are at the interfaces between subunits identified as α, providing the primary face, and non-α, providing the complementary face. In the case of neuronal α7 receptors, the pentamer assembles as a homomer composed only of α7 subunits (5), so that α7 subunits provide both primary and complementary elements for five potential agonist binding sites. The α7 nAChR opens with low probability and is also distinguished by quick desensitization and high permeability to Ca2+ (6). Selective stimulation of α7 will improve cognitive behaviors (7), normalize sensory gating deficit (8), and induce several neuroprotective pathways (9). Therefore, the α7 nAChR is considered a therapeutic target to treat Alzheimer disease, schizophrenia, and other disorders (9–12). Choline, tropisetron, and GTS-21 are examples of α7 agonists that do not effectively activate heteromeric nAChRs (13, 14). The α7 selectivity motif of GTS-21 has been shown to be the arylidene group attached to the core pharmacophoric unit (anabaseine) (14). GTS-21 can enhance a variety of cognitive behaviors in mice, monkeys, rats, and rabbits (15). Depending on the arylidine substitution pattern, a range of efficacy has been observed. Residual inhibition or desensitization (RD) will manifest in a substitution-dependent way, as evidenced by lack of recovery in subsequent applications of ACh that can last for 10 min or longer (16). There is evidence for more than one desensitized state (17); therefore we ask what structural features control activation, the induction of specific forms of desensitization, and whether it would be possible to use such information to tune the characteristics of nAChR drugs. Until relatively recently, distinguishing the different desensitized forms of the receptor was not amenable to direct analysis because they are all equivalently nonconducting. The discovery of α7-selective positive allosteric modulators (PAMs) changed this because of their ability to modulate agonist-mediated conformational changes. Type II PAMs, such as N-(5-chloro-2,4-dimethoxy-phenyl)-N′-(5-methyl-isoxazol-3-yl)-urea (PNU-120596), can reactivate the desensitized α7 receptor (18), and this provides new opportunities to detect nAChRs experimentally when they are in a nonconducting state, termed Ds (17, 19). However, there is another desensitized state accessible in α7 (termed Di), which is insensitive to reactivation by PNU-120596 and has been identified in both whole cell and single-channel recordings (17). Structurally diverse agonists can affect the propensity of receptors to enter and remain in these desensitized states (16). Our goal here is to decipher some of the molecular interactions of ligand and receptor in the α7 selectivity pocket that influence entry and stability of the receptor in different conformational states. Hydrogen bonding is one of the most prevalent driving forces suggested for the ligand association of nAChR and its allosteric modulation of channel gating (20–22). Here we report a systematic hydrogen bonding pharmacophore analysis on ligand-receptor pairs in the human α7 benzylidene selectivity pocket. We consider channel activation, desensitization, and the nature of the desensitized state. We focused on compounds that utilized pyrrole, furan, or thiophene rings because we could control the hydrogen bonding interactions of the aryl ring as hydrogen donating, accepting, or neither. The arylidene anabaseines synthesized were studied for their functional modulation of the α7 nAChR. We report evidence that Gln-57 on the complementary face of the α7 agonist binding site mediates hydrogen bonding interactions with the agonist to influence the activation and desensitization of the α7 receptor. The experimental data provide a useful approach to decipher the molecular interactions between ligand and protein that can influence the state distribution of the receptor.
EXPERIMENTAL PROCEDURES
Chemicals
Solvents and reagents were purchased from Sigma, Fisher Scientific, and TCI America (Portland OR). 1H and 13C NMR spectra were obtained using VXR 300, Gemini 300, or Mercury 300 (300 MHz) spectrometers (Varian, Palo Alto CA) in CDCl3 solvent. Mass spectra were obtained on an Agilent 6210 TOF spectrometer operated in appropriate ionization mode.
Synthesis of Anabaseine Dihydrochloride
Anabaseine dihydrochloride was synthesized from acid-catalyzed rearrangements of 2-piperidinone,1-[(diethylamino)methyl]-3-(hydroxyl-3-pyridinylmethylene)-sodium salt as described previously (23).
General Methodology for Preparation of Arylidene Anabaseines
Anabaseine dihydrobromide (100 mg, 0.312 mmol) was dissolved in 1.1 ml of a methanolic mixture of 0.6 m acetic acid (2.5 eq) and 0.2 m sodium acetate along with 3 eq of the appropriate heterocyclic carboxaldehyde. The mixture was stirred under argon at room temperature for 2 days. When the reaction was finished based on TLC analysis, the mixture was diluted with ∼5 ml of deionized water and its pH was adjusted to 10 with solid sodium carbonate. The aqueous phase was extracted three times with 10 ml of ethyl acetate, and the combined organic fractions were dried over magnesium sulfate and evaporated to dryness. The crude product was purified by flash chromatography on silica, in CH2Cl2/CH3OH mixtures as stated for each compound. The hydrochloride salts were prepared from ice-cold alcoholic solutions of the arylidene anabaseine by careful addition of concentrated HCl, followed by evaporation to dryness. The arylidene anabaseine salts were dissolved in Ringer's solution to prepare daily batches for electrophysiology assays.
2-Pyrrolylmethylene Anabaseine (2PyroAB)
After chromatography (10:1 CH2Cl2/CH3OH), the title compound was obtained in 39% yield as a brown solid. 1H NMR (300 MHz, chloroform-d), δ ppm 1.76–1.94 (m, 2 H), 2.75 (t, J = 5.77 Hz, 2 H), 3.68 (t, J = 5.40 Hz, 2 H), 6.32 (t, J = 2.99 Hz, 1 H), 6.55 (s, 2 H), 6.82 (s, 1 H), 7.18–7.29 (m, 1 H), 7.75 (dt, J = 7.78, 1.88 Hz, 1 H), 8.36 (dd, J = 4.89, 1.53 Hz, 1 H), 8.52 (d, J = 1.46 Hz, 1 H), 11.00 (br. s., 1 H); 13C NMR (75 MHz, chloroform-d), δ ppm 21.50, 26.40, 49.20, 111.37, 113.17, 121.88, 123.33, 124.95, 127.59, 129.28, 136.09, 136.89, 148.97, 149.15, 167.87. TOF-MS: m/z 238.1347 [M + H]+ (calculated: 238.1339).
3-Pyrrolylmethylene Anabaseine (3PyroAB)
After chromatography (8:1, CH2Cl2/CH3OH) the title compound was obtained in 35% yield as a yellow-green solid. 1H NMR (300 MHz, chloroform-d), δ ppm 1.86 (dq, J = 6.13, 5.89 Hz, 2 H), 2.77 (t, J = 6.13 Hz, 2 H), 3.78 (t, J = 5.26 Hz, 2 H), 6.33 (br. s., 1 H), 6.57 (s, 1 H), 6.73 (br. s., 1 H), 6.85 (br. s., 1 H), 7.33 (dd, J = 7.67, 4.89 Hz, 1 H), 7.82 (d, J = 7.59 Hz, 1 H), 8.62 (d, J = 4.38 Hz, 1 H), 8.73 (d, J = 0.58 Hz, 1 H), 9.83 (br. s., 1 H); 13C NMR (75 MHz, chloroform-d), δ ppm 22.01, 26.67, 49.92, 110.00, 119.29, 120.51, 120.93, 123.20, 126.23, 130.72, 136.65, 136.80, 149.44, 149.87, 168.23. TOF-MS, m/z 238.1337 [M + H]+ (calculated: 238.1339).
2-Furanylmethylene Anabaseine (2FAB)
After chromatography (25:1, CH2Cl2/CH3OH), the title compound was obtained in 48% yield as a brownish yellow oil. 1H NMR (300 MHz, chloroform-d), δ ppm 1.64–1.96 (m, 2 H) 2.80 (td, J = 6.72, 2.19 Hz, 2 H) 3.75 (t, J = 1.00 Hz, 2 H) 6.27–6.44 (m, 2 H) 6.38–6.38 (m, 1 H) 7.24 (ddd, J = 7.89, 4.82, 0.88 Hz, 1 H) 7.40 (s, 1 H) 7.71 (dt, J = 7.81, 2.01 Hz, 1 H) 8.55 (dd, J = 4.89, 1.68 Hz, 1 H) 8.64 (dd, J = 2.19, 0.88 Hz, 1 H); 13C NMR (75 MHz, chloroform-d), δ ppm 21.34, 26.13, 49.97, 111.97, 113.61, 122.33, 122.87, 128.24, 135.67, 136.04, 143.58, 149.51, 149.55, 151.79, 166.64. DART-MS: m/z 239.1179 [M + H]+ (calculated: 239.1179).
3-Furanylmethylene Anabaseine (3FAB)
After chromatography (28:1, CH2Cl2/CH3OH), the title compound was obtained in 57% yield as an orange yellow oil. 1H NMR (300 MHz, chloroform-d), δ ppm 1.86 (quin, J = 6.10 Hz, 2 H) 2.72 (td, J = 6.79, 2.19 Hz, 2 H) 3.82 (t, J = 5.48 Hz, 2 H) 6.39–6.56 (m, 2 H) 7.34 (dd, J = 7.81, 4.89 Hz, 1 H) 7.44 (t, J = 1.68 Hz, 1 H) 7.55 (s, 1 H) 7.81 (dt, J = 7.78, 1.81 Hz, 1 H) 8.64 (d, J = 3.21 Hz, 1 H) 8.73 (br. s., 1 H); 13C NMR (75 MHz, chloroform-d) δ ppm 21.51, 26.50, 49.85, 110.93, 121.77, 122.94, 125.64, 130.03, 135.86, 136.10, 142.88, 143.18, 149.50, 149.61, 166.83. ESI-MS, m/z 239.1190 [M + H]+ (calculated: 239.1179).
2-Thiophenylmethylene Anabaseine (2TAB)
After chromatography (25:1, CH2Cl2/CH3OH) the title compound was obtained in 50% yield as a yellow solid. 1H NMR (300 MHz, chloroform-d), δ ppm 1.90 (quin, J = 6.10 Hz, 2 H) 2.85 (td, J = 6.68, 1.97 Hz, 2 H) 3.83 (t, J = 5.48 Hz, 2 H) 6.85 (s, 1 H) 7.03 - 7.17 (m, 2 H) 7.35 (dd, J = 7.81, 4.89 Hz, 1 H) 7.47 (m, 1 H) 7.83 (m, 1 H) 8.65 (dt, J = 4.86, 1.15 Hz, 1 H) 8.75 (m, 1 H); 13C NMR (75 MHz, chloroform-d), δ ppm 21.50, 26.49, 49.87, 123.01, 127.27, 128.19, 128.31, 128.82, 130.85, 135.84, 136.19, 138.93, 149.63, 149.67, 166.98. DART-MS: m/z 255.0941 [M + H]+ (calculated: 255.0950).
3-Thiophenylmethylene Anabaseine (3TAB)
After chromatography (30:1, CH2Cl2/CH3OH) the title compound was obtained in 56% yield as a yellow solid. 1H NMR (300 MHz, chloroform-d), δ ppm 1.86 (quin, J = 6.06 Hz, 2 H) 2.85 (td, J = 6.65, 2.04 Hz, 2 H) 3.84 (t, J = 5.33 Hz, 2 H) 6.64 (s, 1 H) 7.12 (dd, J = 4.82, 1.46 Hz, 1 H) 7.29–7.40 (m, 3 H), 7.82 (dt, J = 7.78, 1.81 Hz, 1 H), 8.64 (br. s., 1 H), 8.74 (br. s., 1 H); 13C NMR (75 MHz, chloroform-d) δ ppm 21.92, 26.48, 50.14, 123.09, 125.65, 126.20, 129.08, 129.34, 130.22, 136.15, 136.32, 137.26, 149.69, 149.83, 167.29. ESI-MS, m/z 255.0941 [M + H]+ (calculated: 255.0950).
Preparation of PNU-120596
PNU-120596 was synthesized via reaction of 5-chloro-2,4-dimethoxylphenyl isocyanate with 3-amino-5-methyl isoxazole as previously described (17).
α7 nAChR Clones and Site-directed Mutants
The human α7 nAChR clone was obtained from Dr. Jon Lindstrom (University of Pennsylvania, Philadelphia, PA). The human RIC-3 clone, obtained from Dr. Millet Treinin (Hebrew University, Jerusalem, Israel), was co-injected with the α7 constructs to improve the levels and speed of receptor expression. Amino acids are numbered as for the human α7 nAChR (vicinal C-loop cysteines at positions 190 and 191). Mutations were introduced using the QuikChange Site-directed Mutagenesis kit (Agilent Technologies, Santa Clara CA) following the manufacturer's instructions. All mutations were confirmed with automated fluorescent sequencing. After linearization and purification of cloned cDNA, RNA transcripts were prepared in vitro using the appropriate mMessage mMachine kit from Ambion Inc. (Austin TX).
Expression in Xenopus laevis Oocytes
Mature (>9 cm) female X. laevis African frogs (Nasco, Ft. Atkinson, WI) were used as the source of oocytes. Before surgery, frogs were anesthetized by placing the animal in a 1.5 g/liter solution of MS222 (3-aminobenzoic acid ethyl ester; Sigma) for 30 min. Oocytes were removed from an abdominal incision. To digest the follicular cell layer, harvested oocytes were treated with 1.25 mg/ml of collagenase from Worthington for 2 h at room temperature in Barth's solution without calcium (88 mm NaCl, 1 mm KCl, 2.38 mm NaHCO3, 0.82 mm MgSO4, 15 mm HEPES (pH 7.6), 12 mg/liter of tetracycline). After that, stage 5 oocytes were isolated and injected with 50 nl (5–20 ng) each of the appropriate cRNAs. Recordings were made 2 to 10 days after injection. The experimental response values were normalized to avoid a variety of the absolute magnitude of the evoked current response over time.
Electrophysiology
Experiments were conducted using OpusXpress 6000A (Molecular Devices, Union City CA). OpusXpress is an integrated system that provides automated impalement and voltage clamp of up to eight oocytes in parallel. Cells were automatically bath-perfused with Ringer's solution (115 mm NaCl, 10 mm HEPES, 2.5 mm KCl, and 1.8 mm CaCl2, pH 7.3) with 1 μm atropine, and both the voltage and current electrodes were filled with 3 m KCl. Cells were voltage-clamped at a holding potential of −60 mV. Data were collected at 50 Hz and filtered at 20 Hz. Flow rates were set at 2 ml/min. Drug applications alternated between ACh controls and ACh or other experimental agonist with or without PNU-120596 at varying concentrations. Drug applications were 12 s in duration followed by 181-s washout periods.
EXPERIMENTAL PROTOCOLS AND DATA ANALYSIS
Each oocyte received two initial control applications of ACh, then experimental drug applications, and follow-up control applications of ACh. For experiments in which the ACh control responses remained relatively stable, net charge responses to experimental drug applications were calculated relative to the preceding ACh control responses to normalize the data (24). For experiments in which ACh control responses varied through the course of the experiment because of potentiation of either RD or PNU-120596, the two initial ACh control responses from each cell were averaged and used to normalize the data for all subsequent responses. PNU-120596 was capable of allowing agonists to induce relatively enormous and sustained responses, which in some cases could introduce large variance into the calculated net charge response. Therefore, normalized peak responses were compared for PNU-120596 amplified experiments (25). These normalization procedures compensated for the varying levels of channel expression among the oocytes. Mean ± S.E. were calculated from the normalized responses of at least four oocytes for each experimental condition. For α7 wild-type and mutant receptors' concentration curve responses, the control ACh concentration was 300 μm, a concentration sufficient to evoke maximal net charge response (24). For concentration-response relationship, data derived from net charge analyses were plotted using Kaleidagraph 3.0.2 (Abelbeck Software, Reading, PA), and curves were generated from the Hill equation (Equation 1).
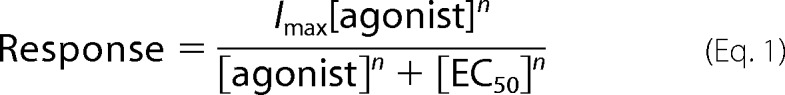 |
Where Imax stands for the maximal response for a particular agonist/subunit combination, and n represents the Hill coefficient. Imax, n, and the EC50 values were all unconstrained for the fitting procedures with experimental agonists, whereas Imax was constrained to equal 1 for ACh, defining our reference full agonist. Additionally, due to the low expression level of the receptor or low activation response of the arylidene anabaseines, the following concentration-response curves were generated while constraining the Hill coefficient value at 2 to obtain a curve to compare with the others: 2PyroAB, 3PyroAB, and 3TAB with the hα7Q57L receptor; 2PyroAB with the hα7Q57K receptor; 3FAB and 2PyroAB with the hα7Q57D receptor; 2FAB, 2PyroAB, 3PyroAB, and 2TAB with the hα7Q57E receptor.
Molecular Modeling
A human α7 nAChR model was created using the Aplysia californica acetylcholine-binding protein (AChBP) structure (PDB code 2WN9) as the template (26). The α7 sequence was modeled with PRIME (Schrodinger2010, Schrodinger Inc.) (27). The resulting monomeric model in complex with the PDB 2WN9 ligand (4OH-GTS-21) was superimposed five times on each chain of the AChBP pentameric crystal structure to generate a pentameric model (Fig. 1A). The model was then examined for clashes that were subsequently resolved by variation of side chain rotomers, or in combination with an initial constrained minimization using the GROMOS force-field resident in SPDB viewer 4.0, followed by Amber 10 (28) molecular mechanics refinement with the bound PDB 2WN9 ligand included. The model quality was assessed with the Molprobity server (29).
FIGURE 1.

The α7 nAChR ligand binding domain model and structures of partial agonists. A, 4OH-GTS-21 in the α7 nAChR ligand binding domain of a homology model. The key elements of the α7 receptor were modeled using the 2WN9 (PDB ID) template. Residues within 5 Å of the phenyl ring of 4OH-GTS-21 are displayed except Trp-55, which is located behind the ligand and is hidden to clarify this presentation. B, the structures of 4OHGTS-21 and the six arylidene anabaseines used in this study are displayed and annotated with their corresponding hydrogen bonding properties.
RESULTS
Experimental Design
To investigate the hydrogen bonding network in the α7 selectivity pocket, we first generated a computational prediction derived from homology modeling (Fig. 1A). AChBP crystallized with the benzylidene motif agonist 4OH-GTS-21 was used as the template to generate the homology model with the bound ligand (26). Among the residues within 5 Å proximity of the benzylidene motif in the homology model, Gln-57 on the complementary binding face was considered the primary candidate for hydrogen bonding interactions with a bound ligand. Therefore, four mutations at position 57 and six arylidene anabaseines with unique hydrogen bonding characteristics were made to test the relationship between the hydrogen bonding pattern and receptor function (Fig. 1, B and C). Wild-type Gln-57 was expected to be able to pair with either hydrogen bonding donors (pyrrolylmethylene anabaseines, PyroABs) or acceptors (furanylmethylene anabaseines, FABs), whereas Q57K could only maintain hydrogen bonding with FABs, and Q57D and Q57E could only maintain hydrogen bonding with PyroABs. We also considered mutant/agonist pairs that could not hydrogen bond; hence, the Q57L mutant and thiophenylmethylene anabaseines (TABs) were additionally prepared.
Synthetic Hydrogen Bonding Probes
All of the six arylidene anabaseines (Fig. 1B) were synthesized by aldol-type condensation between anabaseine dihydrochloride and the appropriate aryl carboxaldehyde in yields ranging from 35 to 65% (supplemental Fig. S1). These compounds retained the previously observed preference for formation of the E- stereoisomer about the exocyclic double bond, as observed for benzylidene anabaseines (23, 30). The protonation state of the core imine of the benzylidene anabaseine family of agonists is a factor that has been postulated to impact the agonists' activation of the receptor, with the positively charged protonated form being the active form. Therefore, we estimated the protonation state of the new arylidene anabaseines using the NMR method described by Zoltewicz (30). At physiological pH, all six arylidene anabaseines were estimated to be at least 93% protonated, which was higher than for benzylidene anabaseine.
α7 Receptor Mutants
We first examined how the functional profiles of the Gln-57 mutants compared with wild-type (WT) receptor using as reference the full agonist ACh (Fig. 2 and Table 1). On the same day post-injection, Q57K and Q57D mutants (Fig. 2A) showed absolute responses to ACh that were similar to wild-type, whereas the Q57L and Q57E mutants showed lower responses, suggesting intrinsically lower Popen, or, less likely, lower expression of functional receptors for these latter two mutants. For subsequent data presentations, for any given mutant the initial ACh response was normalized to a value of 1 to control for intrinsic differences in agonist efficacy and differences in the expression or trafficking of the receptors.
FIGURE 2.

Functional tests of wild-type α7 Gln-57 mutants. A, comparison of the wild-type and Gln-57 mutant expression levels as estimated by the net charge response to ACh. All of the receptor types were tested 2 days after injection of RNA. The net charge responses of the 300 μm acetylcholine are normalized to that of the wild-type. **, p < 0.01; n ≥ 4. B, concentration-response curves of acetylcholine presented in net charge. C, representative traces of the acetylcholine activation on WT and Q57K mutant receptors at different concentrations. D and E, comparison of the PNU-120596-stimulated response when applied with ACh. Each oocyte received two initial 300 μm ACh controls followed by co-application of 300 μm acetylcholine and 300 μm PNU-120596. Both the peak response and the net charge response of the co-application were normalized to the average of the two initial controls. The peak responses of the co-application were displayed in panel D, and the ratio of the net charge response to the peak response of the co-application was displayed in panel E. F, traces for co-application of ACh and PNU-120596 to WT, Q57K, and Q57D receptors, with the accompanying ACh-only reference traces.
TABLE 1.
The efficacy (Imax) and potency (EC50) of acetylcholine and arylidene anabaseines with wild-type and Gln-57 mutant α7 receptors evaluated by net charge. Some compounds only showed a response at 300 μm, whose net charge value is reported as Imax and efficacy is displayed as N/A
| WT |
Q57L |
Q57K |
Q57D |
Q57E |
||||||
|---|---|---|---|---|---|---|---|---|---|---|
| Imax | EC50 | Imax | EC50 | Imax | EC50 | Imax | EC50 | Imax | EC50 | |
| ACh | 1.0 | 31 ± 3 | 1.0 | 26 ± 3 | 1.0 | 65 ± 3 | 1.0 | 18 ± 2 | 1.0 | 36 ± 4 |
| 2FAB | 0.50 ± 0.02 | 16 ± 2 | 0.55 ± 0.04 | 11 ± 2 | 0.29 ± 0.00 | 49 ± 2 | 0.40 ± 0.01 | 6.8 ± 0.6 | 0.35 ± 0.02 | 34 ± 4 |
| 3FAB | 0.13 ± 0.00 | 83 ± 3 | 12% | N/A | 4 ± 1% | N/A | 0.14 ± 0.01 | 45 ± 9 | 4 ± 1% | N/A |
| 2PyroAB | 0.27 ± 0.01 | 5.8 ± 0.9 | 0.14 ± 0.02 | 8.8 ± 3.4 | 0.15 ± 0.01 | 37 ± 8 | 0.44 ± 0.02 | 2.1 ± 0.3 | 0.20 ± 0.01 | 11 ± 2 |
| 3PyroAB | 0.44 ± 0.04 | 17 ± 5 | 0.45 ± 0.02 | 4.7 ± 0.9 | 0.25 ± 0.01 | 28 ± 1 | 0.65 ± 0.03 | 5.4 ± 0.8 | 0.48 ± 0.03 | 4.4 ± 1.1 |
| 2TAB | 0.23 ± 0.02 | 46 ± 9 | 0.17 ± 0.01 | 54 ± 9 | 0.08 ± 0.00 | 101 ± 1 | 0.19 ± 0.02 | 34 ± 9 | 0.15 ± 0.02 | 34 ± 12 |
| 3TAB | 0.25 ± 0.00 | 46 ± 1 | 0.26 ± 0.02 | 15 ± 4 | 0.11 ± 0.00 | 98 ± 5 | 0.34 ± 0.02 | 18 ± 3 | 0.18 ± 0.03 | 38 ± 19 |
The ACh potency values (EC50, Fig. 2B and Table 1) for WT, Q57L, Q57E, Q57K, and Q57D mutants were similar, at 31 ± 3, 26 ± 3, 36 ± 4, 65 ± 3, and 18 ± 2 μm, respectively. Although Q57K did show a potency decrease of 2-fold relative to WT. Fig. 2C provides an example of how mutant receptors (e.g. Q57K) still have the low Popen and propensity to desensitize at higher occupancy that is characteristic of the α7 receptor. A 100 μm application of ACh to Q57K could induce a response similar to a 30 μm ACh application to WT. Hence, the Q57K mutant only had a shifted potency for ACh; the concentration-dependent onset of desensitization was maintained.
Fig. 2D presents the enhanced peak response of the receptors to a co-application of PNU-120596 and ACh, relative to the initial ACh control applications. The potentiation of responses ranged from 7-fold (Q57D) to a high of 26-fold (Q57L) with the WT response being 15-fold enhanced. The data suggest that WT and each mutant have distinct barriers for entry into the desensitized state that is sensitive to PNU-120596 (Ds). Fig. 2E presents the data for the ratio of the net charge to peak amplitude current response of the receptors to PNU-120596 and ACh co-applications, relative to the initial ACh application. The pattern for the WT and mutant series is clearly different from the peak response data (Fig. 2D). Fig. 2F presents raw data for PNU-120596 and ACh co-application responses of selected receptors, scaled to the initial ACh response. Comparison of the WT, Q57K, and Q57D potentiated responses reveal that both peak and net charge were modulated by co-application of PNU-120596. We hypothesize that the net charge response of a PNU-120596-stimulated receptor can be related to the stability of the ACh-bound Ds states of the specific mutants. Comparison of Fig. 2, D, E, and F, supports the interpretation that mutations differentially impact entry to, and the stability of, Ds states when ACh is the bound agonist.
Activation Profile of Agonists on the Wild-type Human α7 Receptor
Because the new compounds have smaller, 5-membered aryl rings compared with the 6-membered benzene ring of the benzylidene anabaseines, we first examined whether the arylidene anabaseines would keep the hallmark features of the benzylidene family agonists: α7 selectivity and partial agonism (16). At 100 μm concentration, they were not able to induce detectable responses from α4β2 or α3β4 receptor subtypes (data not shown), whereas they activated α7 receptors to varying degrees. To investigate whether differing hydrogen bonding patterns presented by these six ligands would affect their activation of the α7 receptor, we tested them at various concentrations to estimate both EC50 and Imax values, relative to ACh. Their concentration-response curves, representative traces, and values of potency and efficacy on the α7 wild-type and mutants are presented in Figs. 3 and 4, and Table 1, respectively.
FIGURE 3.

Concentration-response curves of the six arylidene anabaseines with WT and Gln-57 mutant α7 receptors. 3FAB-evoked responses are not shown because most responses were marginally detectable at 300 μm concentration. All responses are the averages (±S.E.) of data from at least 4 oocytes.
FIGURE 4.

Representative traces of the 300 μm arylidene anabaseine-evoked currents and their inhibition of the subsequent ACh-evoked responses of the wild-type α7 nAChR and Gln-57 mutants. Each oocyte received two 300 μm ACh controls (only the second one is displayed), a 300 μm arylidene anabaseine treatment, followed by another 300 μm ACh control. All of the traces are scaled to the pre-drug ACh control responses, the absolute peak values of which varied from 1.9 to 11 μA.
Among the six arylidene anabaseines, 3FAB had the lowest efficacy as an agonist for wild-type α7 (Imax less than 14% relative to ACh), and it had the highest EC50 noted for the arylidene anabaseines (83 μm). The regioisomeric 2FAB, which positions the furan oxygen differently than 3FAB, induced a 50% response relative to acetylcholine. In contrast, both of the hydrogen bond-donating pyrrolyl methylene anabaseines (PyroABs) activated α7 receptors effectively. The Imax for 3PyroAB was similar to that observed for 2FAB, with nearly identical potency. Although 2PyroAB was less efficacious than 2FAB or 3PyroAB, it was more potent, with an EC50 value of ∼6 μm, 2.5-fold lower than for 2FAB or 3PyroAB (Table 1).
The thiophene rings of 2TAB and 3TAB are not hydrogen bonding residues and were anticipated to exhibit behavior divergent from the hydrogen-bonding capable aryl rings of FABs and PyroABs. In concentration-response tests, 2TAB and 3TAB yielded similar results for wild-type α7, with relative efficacy around 23% and potency around 46 μm, which were similar to the values reported for unsubstituted benzylidene anabaseine, which like the TABs is hydrophobic and not hydrogen bonding capable at the aryl group (16).
Activation Profile of Agonists on Human α7 Receptor Mutants
To investigate the potential roles of hydrogen bonding at Gln-57 on the function of the α7 receptor, we studied the six compounds activation profiles with four mutants, Q57L, Q57K, Q57D, and Q57E. We observed both global changes in receptor functional parameters and specific changes that could be associated with specific hydrogen bonding interactions (Fig. 3 and Table 1). Note that the efficacy of 3FAB was too low to permit an accurate concentration-response analysis, and so the 3FAB data are omitted from Fig. 3.
We noted that there was a global decrease of activation for arylidene anabaseines of the Q57K receptor (Fig. 3C and Table 1). The Imax values for FABs, PyroABs, and TABs with this mutant decreased to approximately half of the Imax values found for WT. The EC50 values of the arylidene anabaseines with Q57K increased on average ∼2-fold, compared with their values for WT. Another global change observed was enhanced potency for the arylidene anabaseines in Q57D compared with WT.
Compound- and/or Mutant-specific Trends and Effects
As a partial agonist, 2PyroAB was extremely weak toward the Q57L mutant receptor (Figs. 3B and 4). Its efficacy was decreased by 2-fold with Q57L, in comparison with WT, whereas other efficacies of the arylidene anabaseines were not significantly changed. A similar decrease in response was observed for 2PyroAB in Q57K (Figs. 3C and 4). It is noteworthy that 2PyroAB is a putative hydrogen bond donor, and when the putative acceptor, Gln-57 was mutated to Leu or Lys, neither of which can accept a hydrogen bond, receptor activation was diminished. The combination of 2PyroAB with Q57D and Q57E mutants maintains a donor acceptor relationship, and we observed enhancement of activation for Q57D, and only slightly diminished activation for Q57E (Table 1, Figs. 3, D and E, and 4). A similar effect was also seen for the mutant series with 3PyroAB. In this case, Q57L is neutral, the hydrogen bond mismatch with Q57K was again deleterious to Imax, and the Q57D and Q57E mutants were enhanced or maintained Imax.
For 2FAB, we observed a diminution of activation for Q57K, however, no diminution of activation was observed for Q57L, relative to ACh for the respective mutants (Fig. 3B). Both Q57D and Q57E showed slightly reduced Imax values with 2FAB compared with ACh, relative to WT. It is interesting to note that in the case of 2FAB, pairing it with a matched hydrogen bond donor (Lys) had a more negative effect on agonist activity than pairing it with two putative mismatch partners (Asp or Glu), suggesting that for this putative point-to-point contact, hydrogen bonding does not favor transition to the open channel state. As noted above, although the activation profiles for mutants indicated that 3FAB was an extremely weak agonist, 3FAB will be discussed below with regard to its behavior during allosteric modulation.
RD Effects of Agonists on the Wild-type Human α7 Receptor and Gln-57 Mutants
An important property of the α7 receptor is that when paired with certain partial agonists, sustainable RD (16) occurs. We investigated the recoveries of the α7 receptor and its Gln-57 mutants with a protocol consisting of two initial ACh controls, 3.5-min washouts, application of arylidene anabaseine at 300 μm, and another 3.5-min washout, followed by a probe ACh application. The final ACh responses were used to evaluate the recovery of the receptor. Sample traces are presented in Fig. 4, and the data are summarized in Table 2.
TABLE 2.
Comparison of 300 μm ACh control net charge response recovery (%) among wild-type and Gln-57 mutant α7 receptors after 300 μm acetylcholine or arylidene anabaseine
| ACh | 2FAB | 3FAB | 2PyroAB | 3PyroAB | 2TAB | 3TAB | |
|---|---|---|---|---|---|---|---|
| WT | 88 ± 5 | 63 ± 13 | 95 ± 3 | 98 ± 2 | 66 ± 13 | 61 ± 7 | 58 ± 7 |
| Q57L | 87 ± 6 | 31 ± 8 | 88 ± 3 | 78 ± 5 | 77 ± 4 | 53 ± 4 | 47 ± 11 |
| Q57K | 98 ± 2 | 86 ± 6 | 100 ± 2 | 94 ± 5 | 85 ± 3 | 86 ± 6 | 99 ± 2 |
| Q57D | 96 ± 6 | 21 ± 3 | 77 ± 9 | 98 ± 16 | 84 ± 4 | 68 ± 1 | 53 ± 6 |
| Q57E | 92 ± 2 | 81 ± 11 | 91 ± 1 | 88 ± 8 | 77 ± 6 | 82 ± 3 | 80 ± 6 |
In the wild-type α7 receptor, 2FAB, 3PyroAB, 2TAB, and 3TAB inhibited the ACh probe net charge response to a value ∼60% of the initial ACh controls, whereas 3FAB and 2PyroAB showed no significant RD effect. The Q57K mutant was noteworthy for having decreased RD effects for all compounds. The Q57L and Q57D receptors showed enhanced RD effects with 2FAB. Only 31 and 21% receptor recovery was observed after applying 300 μm 2FAB to Q57L and Q57D, respectively, which were statistically different from WT (Q57D, p < 0.01; Q57L, p < 0.05). In contrast, the data suggest that Q57K and Q57E mutants with 2FAB may have decreased or comparable RD relative to WT, with recoveries of 86 and 81%, respectively. The above data are consistent with the idea that various combinations of agonist and receptor mutations lead to differing levels of RD effects.
The wide range of RD effects we observed for 2FAB with the mutant receptor series led us to further investigate the nature of the RD effects. We utilized a post-2FAB application of PNU-120596 to probe for the Ds state (Fig. 5A). PNU-120596 reactivated all of the 2FAB-treated receptor types, but did so weakly for Q57K. Interestingly, PNU-120596 distinguished Q57E from the Q57K receptors by virtue of a much stronger PNU-120596 response from the Q57E receptor. This is in contrast to the very similar RD effects seen for these two mutants with 2FAB (Table 2). For Q57L and Q57D, after 2FAB and PNU-120596 applications, we observed little if any response to ACh (data not shown), whereas the other mutants responded strongly. This observation is consistent with the ACh response recovery data for 2FAB and Q57D and Q57L mutants presented in Table 2, and suggests that the Q57D and Q57L RD effects included a significant component of PNU-120596-insensitive desensitization (Di). Fig. 5B presents a scatter plot that compares the RD effect data from Table 2 (abscissa) and the PNU-120596 peak current data from Fig. 5A (ordinate). If RD depended only on the Ds state, one would predict that the data would correlate well; but this was not observed, indicating another variable was responsible for the scatter, which we suggest is a contribution to RD associated with the Di state. Given the dynamic nature of the experiment presented in Fig. 5A, we performed a recovery test to chart the lifetime of the bound 2FAB-receptor complex (Fig. 5C). After application of 2FAB, 8 applications of ACh, spaced 3.5 min apart were given to monitor the hypothetical 2FAB off-rate, based on the reversal of RD. Within the first 7-min period, all of the receptors tested showed no increase in the level for the ACh responses. Over the subsequent time frame WT and Q57E had the fastest apparent off rate for 2FAB, whereas Q57L took 25 min to reach 80% recovery, and Q57D recovered to 90% after 13 min.
FIGURE 5.

A summary of the residual desensitization profile of 2FAB with WT and Gln-57 mutant α7 receptors probed by PNU-120596. A, representative traces of 300 μm PNU-120596-evoked responses following the application 300 μm 2FAB to induce RD. Also shown are 300 μm ACh control responses before the sequential applications of 2FAB and PNU-120596. All responses are scaled relative to the initial ACh control responses. B, scatter plot of the PNU-120596-evoked response in comparison with the inhibitory effect of 300 μm 2FAB on a subsequent ACh application (as shown in Fig. 4). The values of the inhibition effect are obtained from the recovery values displayed in Table 2. C, recovery tests of different α7 receptor types after 2FAB application. Cells were washed with Ringers solution after application of 2FAB, and repeatedly stimulated with 300 μm ACh to evaluate the rates of recovery. All responses plotted in panels B and C are the averages (±S.E.) of at least 4 oocytes.
Co-application of Arylidene Anabaseine Partial Agonists and PNU-120596
Application of PNU-120596 to a stable long-lived Ds state of the α7 nAChR (as in Fig. 5) will give a measurable induced current, but quantifying these data and comparing them between mutant receptor-agonist combinations becomes complicated by the varying kinetic time frames that exist for dissociation of the bound ligand and PAM. Seeking to minimize these concerns, we conducted experiments that involved co-application of the experimental agonists and PNU-120596 to probe for the Ds state in a time frame that is virtually coincident with its induction (17). Fig. 6A presents representative traces for these experiments, each trace scaled relative to the amplitude of the initial ACh control responses (not shown). The data are summarized in terms of peak response and net charge-to-peak response ratio in Fig. 6, B and C, respectively.
FIGURE 6.

Comparison of arylidene anabaseine-evoked current and currents evoked with the co-application of PNU-120596. A, representative traces for the application of 300 μm 3FAB (upper two traces) or 300 μm 3PyroAB (lower two traces) applied alone or co-applied with 300 μm PNU-120596. Each oocyte received two 300 μm ACh controls (only the first one was displayed in the representative traces), then was treated with one of the arylidene anabaseines at 300 μm, either with or without 300 μm PNU-120596. Each single trace displayed represents a single experiment, but all traces are normalized to its own ACh control, the absolute peak value of which varied from 0.6 to 10.2 μA. These control responses were scaled to the same level and omitted for clear presentation. B, the peak responses for co-applications of agonist and PNU-120596 relative to the average of the two initial ACh controls. C and D, the peak response (C) and net charge-to-peak response ratio (D) of the co-application responses relative to the average of the two initial controls. The ratios were calculated for each single cell. The mean ± S.E. were based on data obtained from at least four oocytes.
The combinations of receptor mutations and arylidene anabaseines gave peak responses that ranged from approximately equivalent to the ACh peak to ∼4 times greater (Fig. 6B). As one inspects the series of mutants, it is also apparent that the relative peak response for the compound series varied from mutant to mutant. Among the six arylidene anabaseines, 3FAB was especially interesting because it was the worst agonist for the α7 receptor and the four mutants (Fig. 6A, top traces), but gave strong responses when co-applied with PNU-120596. As an agonist in the absence of PAM, 3FAB was about 5-fold weaker at activating the receptor than 3PyroAB (Fig. 6A). For the WT receptor, we note a pattern whereby the peak PNU-120596-induced currents were greater for 2FAB or 2PyroAB relative to their 3FAB or 3PyroAB isomers. A notable difference is discerned when net charge-to-peak ratios are considered instead of peak currents alone. In this case, the WT receptor net charge response appeared to favor the 3FAB or 3PyroAB isomers over the 2FAB or 2PyroAB isomers. Another major difference was the dramatic net charge-to-peak ratio for the Q57L mutant and 3FAB, which was 50-fold higher than the ACh control and more than 3-fold higher than for the other arylidene anabaseines.
Energy Landscapes
Fig. 7 presents semi-quantitative energy landscapes for the selected nAChR/ligand combinations we have experimentally tested. All energy levels are configured relative to the ligand-bound resting closed state which has the greatest probability for opening. In constructing Fig. 7, the following considerations were applied.
FIGURE 7.

Energy landscapes for ACh, FAB, and PyroAB agonists with different α7 receptors at high ligand occupancy level. Under equilibrium conditions, the distribution of receptors into the resting closed (C), open (O), PNU-120596-sensitive desensitized (Ds), and PNU-120596-insensitive desensitized (Di) states are determined by the relative free energy of the states (represented by vertical displacements). The graphs were constructed as described in the text. The experimental support for transitions shown in bold are discussed in the text.
The net charge-derived maximum efficacies of the ligand-receptor combinations (taken from Fig. 3) were used to estimate the height of the energy barriers from C to O. Efficacies were used to estimate the energy barriers because under the dynamic conditions of the experiments, where the resting receptor is challenged with a pulse of agonist, the system is far from equilibrium. Thus kinetics associated with transitions from the resting ligand bound closed state(s) largely govern the initial evolution of the receptor. This transiently detectable synchronization of channel opening is likely to be relevant to receptor function in vivo when rapid perturbations in ACh concentration occur. In contrast, it is noteworthy that under equilibrium conditions, the Popen for the bound receptor is vanishingly small (17). Because peak and net charge efficacies scale, either could have been used for the relative comparison of the energy of barriers between C and O. Because α7 has an intrinsically low Popen, even under the most optimal conditions these barriers are high. Likewise, the barriers to exit the open state are small, because occupancy of the open state for the wild-type receptor is very brief (17). For the wild-type receptor, the barriers for the various ligands were estimated by Imax values in Fig. 3A; for the mutants the efficacy estimates were further adjusted for the relative levels of detectable ACh-evoked responses (Fig. 2A). This correction has the effect of normalizing the heights of the C to O barriers all relative to the barrier for ACh and the wild-type receptor.
Relative Energy of C and O States
Mutation and ligand binding may change the energy level of the C and/or O states, and such change is hard to quantify. Therefore, the energy of the C and O states were set to the same value among different ligand-receptor pairs to facilitate comparisons in Fig. 7.
Detection of Ds and Di States, Estimates of Their Barriers and Energy Levels
We experimentally detect Ds and Di states when two conditions are met. First, RD is detected (Table 2 and Fig. 4), establishing that agonist application yields a receptor in a stable desensitized state. Second, co-application of the agonist and PNU-120596 results in potentiation of the receptor response to agonist, providing a measure of how much of the D state is Ds. Without a tool to directly measure Di, we identify it when the receptor shows RD but is a weak PNU-120596 responder.
The peak response data in Fig. 6B was used to estimate the height of barrier from C to Ds (compared with ACh for each mutant), such that the larger the potentiation, the lower the barrier was set. The peak response corresponds to the nearly instantaneous transition of the receptor from C to Ds. The energy levels for Ds were estimated by comparison of the relative values for the potentiated peak versus net charge responses (Fig. 6C). This was done to correct for the impact of the barrier for entry (peak response) on the observed net charge response. High barriers would lead to underestimates of the Ds energy level, whereas low barriers would flood the Ds state and lead to overestimates of its significance. We recognize that multiple variables are in play here, including ligand and PAM dissociation rates, but inspection of Fig. 6A suggests that in many cases the response is nearly complete by the time the application is over, and the data of Fig. 5C suggest agonist off-rates will generally be slow over the experimental time course. At this time we are limited by the complexity of the experimental system, requiring that we make limiting assumptions regarding slow off-rates for ligands. Finally, the energy of the Di state was uniformally placed lower than Ds because studies show that the receptor is ultimately driven into this state on prolonged occupation (17), hence it is the thermodynamically preferred state. In a few cases the RD effects were sufficient to prompt us to lower the level of Di further (2FAB with Q57L or Q57D gave high RD).
DISCUSSION
We have tested the hypothesis that hydrogen bonding interactions between a bound partial agonist and the α7 receptor will contribute to the procession of the complex into open and/or desensitized states, both in terms of the energy barriers for interstate transitions and how populated, or stable, the states will be when the system approaches equilibrium. It is reasonable to consider how a single hydrogen bond could serve in this capacity. For example, if the barrier to enter a desensitized state was selectively lowered by 1.4 kcal/mol relative to the barrier that controls Popen, the receptor would be ∼10 times more likely to enter the desensitized state. Similar arguments can be made about the population of a given state at equilibrium, if it is differentially stabilized in its interactions with bound ligand. Several complicating factors must be born in mind. When binding a ligand to the nAChR, the resulting complex is unlikely to be unique; in other words, multiple bound states may exist with respect to the ligand and the mutual orientations of the receptor. Presumably only one or a few of these are experimentally significant, allowing interpretation of data derived from methodical variation in the structure of ligand and receptor. Another point of importance is that we utilize the PAM PNU-120596 with a series of ligand-binding domain mutants, to unmask previously silent nonconducting desensitized states. We assume that mutations of Gln-57, which is remote from the putative binding site for PNU-120596 (31), does not differentially impact the intrinsic ability of PNU-120596 to facilitate conversion of the receptor complex into a conductive state.
Activation of α7 nAChR as Modulated by Hydrogen Bonding
The series of arylidene anabaseines were chosen to differ primarily in their ability to donate or accept a hydrogen bond. Their five-membered aryl rings are closely comparable in size to each other, but smaller than a phenyl ring. An illustrative example is found in the calculated Connolly-excluded molecular volumes estimated for furan, pyrrole, thiophene, and benzene (54, 55, 65, and 71 Å3). The thiophene ring is ∼20% larger in volume than the pyrrole or furan rings due to the larger van der Waals radius of sulfur. However, even the thiophene ring of the 2TAB and 3TAB compounds is smaller than the phenyl ring found in benzylidene anabaseines. We consider it most likely that the activity differences between FABs and PyroABs are dominated by their differences in ability to hydrogen bond, and differences in where they locate the hydrogen bonding element, rather than the subtle differences in their size.
We observed that 3FAB was a universally weak partial agonist for WT and all mutants of Gln-57, so much so that reasonable concentration-response profiles for all receptor variants could not be obtained for this compound. Keeping in mind that the furanyl oxygen of 3FAB is only capable of functioning as a hydrogen bond acceptor, it is interesting to consider the mutant activation profiles for 3PyroAB, a hydrogen bond donor at nitrogen. We found that when 3PyroAB was paired with the Q57D or Q57E mutants, that Imax values (relative to ACh) were enhanced. This pairing represents a favorable donor-acceptor interaction because the Asp or Glu acceptors should be better acceptors than the wild-type Gln, as a result of the ability of the former to bear a negative charge. Taking the 3FAB versus 3PyroAB data together, we suggest that it supports the hypothesis stating that Gln-57 as a hydrogen bond acceptor in an acceptor donor pair is favorable toward the apparent initial activation of the receptor. Given that the observed receptor response to a partial agonist is the sum of the dynamic interplay between activation and desensitization, an alternate explanation for the apparent enhanced activation by 3PyroAB is that it produces less desensitization compared with 3FAB. This point will be considered in further detail below. We might have predicted that 3FAB would enjoy enhanced hydrogen bonding with the Q57K mutant because in this case the replacement of Lys for Gln yields a much better charged hydrogen bond donor. This test indicated that this specific pairing did not lower the energy barrier for activation, because the Imax for Q57K and 3FAB was too small to be determined. Interestingly, a putative hydrogen bond mismatch between Q57K and 3PyroAB is also informative. In this case, Imax for 3PyroAB with Q57K was the lowest of all mutants. One may again ask if this is because a mismatch lowers the ability to activate the channel, or if this mismatch has a greater propensity to lead to desensitization, or a mixture of the two. The utility of the Type II PAM PNU-120596 comes to the forefront regarding this latter point, by virtue of its ability to distinguish between multiple desensitized states. In the simplest scenario, where a partial response of the agonist is the composite of activation and entry into a PNU-120596-sensitive desensitized state (Ds), it becomes possible to characterize the barriers leading into, and the population of, that state by virtue of rendering it conductive with co-application of PNU-120596.
The Impact of Putative Hydrogen Bonding Interactions on Entry into Detectable Desensitized States
A restricted focus on channel activation is a limitation to the traditional characterizations of partial agonists that generate only estimates of EC50 and Imax, and thereby only information about the nonstationary state-transition probabilities that occur immediately after a rapid jump in agonist concentration. However, in the case of a therapeutic application of a partial agonist, where the drug concentration will rise slowly and dissipate even more slowly, modeling such instantaneous perturbations is of limited value, and understanding equilibrium conditions becomes more important. We have previously introduced energy landscape diagrams to illustrate these features for α7 function modulated by ACh, with the differential induction of Ds and Di deduced by the time- and concentration-dependent effects of PNU-120596 (17). The immediate and certain significance of the differential induction of Ds and Di states by potential therapeutic ligands is that these features will predict the negative modulation of the signals generated by endogenous cholinergic activity (32). However, it has also been proposed that α7 may mediate ion channel-independent forms of signal transduction and that nonconducting (i.e. desensitized) conformations may nonetheless be active states for intracellular signal transduction. Therefore, knowing how particular ligands control the entry of α7 into specific desensitized states may ultimately provide a way to tune ligands for various signaling modes. Such modes may differ both in how they are induced or stabilized by hydrogen bond interactions that preferentially promote conformational transitions (by altering energy barriers) or stabilize specific states by changing the relative free energy levels of the conformational states. A conceptualization of this is illustrated in Fig. 7.
Our data would suggest that for 2FAB a hydrogen bond might favor the stability of the Ds relative to the Di state for Q57K, and that the lack of a hydrogen bond might favor the Di state with Q57D. These effects appear less pronounced with 3FAB, suggesting a preferred point-to-point interaction with an oxygen in the 2 position. There are no clear hydrogen bond acceptor-donor effects with 2PyroAB. Although the activation barrier to the O state is relatively high with Q57E, suggesting that a hydrogen bond in this case might oppose the opening transition. This effect is less pronounced with 3PyroAB.
The propensity for the α7 nAChR to rapidly enter desensitized states raises several questions of both fundamental and applied importance. The structural features within a bound ligand that may help facilitate entry into one or more desensitized states are now being deduced through structure-function studies utilizing new probe molecules and site-directed mutants of the receptor. One must bear in mind, however, that the trajectory of a receptor-ligand complex in its progression among resting, open, and desensitized states is unlikely to be a single path, nor end up at a single discrete state. Manifold but related orientations of bound ligand and interacting receptor side chains may be concurrently operative, such that in studies like those described in this work, certain pairs of agonist and mutations may be diagnostic, whereas others may not overtly impact the overall observed behavior of the receptor. Furthermore, the contribution of direct ligand-protein interactions are likely superimposed on effects that probative mutations may place on aspects of allosteric modulation that occur removed from the site of ligand binding. However, practical benefits arise from mapping out the structure- function relationships for agonist structure and the sensitivity of resulting desensitized complexes to allosteric modulation. One can envision the development of new nAChR active ligands that have tailored responses to allosteric modulators.
Acknowledgments
We thank Chad Brodbeck, Sara Copeland, Robin Rogers, and Mathew Kimbrell for technical assistance, and Dustin K. Williams for editorial assistance.
This work was supported, in whole or in part, by National Institutes of Health Grant R01 GM057481 (to R. L. P.).

This article contains supplemental Fig. S1.
- nAChR
- nicotinic acetylcholine receptor
- GTS-21
- 3-(2,4-dimethoxy)-benzylidene anabaseine
- PNU-120596
- 1-(5-chloro-2,4-dimethoxy-phenyl)-3-(5-methyl-isoxazol-3-yl)-urea
- RD
- residual desensitization
- PyroAB
- pyrrolylmethylene anabaseines
- 2PyroAB
- 2-pyrrolylmethylene anabaseine
- 3PyroAB
- 3-pyrrolylmethylene anabaseine
- 2FAB
- 2-furanylmethylene anabaseine
- 3FAB
- 3-furanylmethylene anabaseine
- 2TAB
- 2-thiophenylmethylene anabaseine
- 3TAB
- 3-thiophenylmethylene anabaseine
- FAB
- furanylmethylene anabaseines
- TAB
- thiophenylmethylene anabaseine
- PAM
- positive allosteric modulator
- PDB
- Protein Data Bank.
REFERENCES
- 1. Millar N. S., Gotti C. (2009) Diversity of vertebrate nicotinic acetylcholine receptors. Neuropharmacology 56, 237–246 [DOI] [PubMed] [Google Scholar]
- 2. Dani J. A., Radcliffe K. A., Pidoplichko V. I. (2000) Variations in desensitization of nicotinic acetylcholine receptors from hippocampus and midbrain dopamine areas. Eur. J. Pharmacol. 393, 31–38 [DOI] [PubMed] [Google Scholar]
- 3. Wooltorton J. R., Pidoplichko V. I., Broide R. S., Dani J. A. (2003) Differential desensitization and distribution of nicotinic acetylcholine receptor subtypes in midbrain dopamine areas. J. Neurosci. 23, 3176–3185 [DOI] [PMC free article] [PubMed] [Google Scholar]
- 4. Quick M. W., Lester R. A. (2002) Desensitization of neuronal nicotinic receptors. J. Neurobiol. 53, 457–478 [DOI] [PubMed] [Google Scholar]
- 5. Le Novère N., Corringer P. J., Changeux J. P. (2002) The diversity of subunit composition in nAChRs. Evolutionary origins, physiologic and pharmacologic consequences. J. Neurobiol. 53, 447–456 [DOI] [PubMed] [Google Scholar]
- 6. Séguéla P., Wadiche J., Dineley-Miller K., Dani J. A., Patrick J. W. (1993) Molecular cloning, functional properties, and distribution of rat brain α7. A nicotinic cation channel highly permeable to calcium. J. Neurosci. 13, 596–604 [DOI] [PMC free article] [PubMed] [Google Scholar]
- 7. Leiser S. C., Bowlby M. R., Comery T. A., Dunlop J. (2009) A cog in cognition. How the α7 nicotinic acetylcholine receptor is geared towards improving cognitive deficits. Pharmacol. Ther. 122, 302–311 [DOI] [PubMed] [Google Scholar]
- 8. Stevens K. E., Kem W. R., Mahnir V. M., Freedman R. (1998) Selective α7-nicotinic agonists normalize inhibition of auditory response in DBA mice. Psychopharmacology 136, 320–327 [DOI] [PubMed] [Google Scholar]
- 9. Roncarati R., Scali C., Comery T. A., Grauer S. M., Aschmi S., Bothmann H., Jow B., Kowal D., Gianfriddo M., Kelley C., Zanelli U., Ghiron C., Haydar S., Dunlop J., Terstappen G. C. (2009) Procognitive and neuroprotective activity of a novel α7 nicotinic acetylcholine receptor agonist for treatment of neurodegenerative and cognitive disorders. J. Pharmacol. Exp. Ther. 329, 459–468 [DOI] [PubMed] [Google Scholar]
- 10. D'Andrea M. R., Nagele R. G. (2006) Targeting the α7 nicotinic acetylcholine receptor to reduce amyloid accumulation in Alzheimer disease pyramidal neurons. Curr. Pharm. Des. 12, 677–684 [DOI] [PubMed] [Google Scholar]
- 11. Martin L. F., Freedman R. (2007) Schizophrenia and the α7 nicotinic acetylcholine receptor. Int. Rev. Neurobiol. 78, 225–246 [DOI] [PubMed] [Google Scholar]
- 12. Terry A. V., Jr. (2008) Role of the central cholinergic system in the therapeutics of schizophrenia. Curr. Neuropharmacol. 6, 286–292 [DOI] [PMC free article] [PubMed] [Google Scholar]
- 13. Papke R. L., Bencherif M., Lippiello P. (1996) An evaluation of neuronal nicotinic acetylcholine receptor activation by quaternary nitrogen compounds indicates that choline is selective for the α7 subtype. Neurosci. Lett. 213, 201–204 [DOI] [PubMed] [Google Scholar]
- 14. Horenstein N. A., Leonik F. M., Papke R. L. (2008) Multiple pharmacophores for the selective activation of nicotinic α7-type acetylcholine receptors. Mol. Pharmacol. 74, 1496–1511 [DOI] [PMC free article] [PubMed] [Google Scholar]
- 15. Kem W. R. (2000) The brain α7 nicotinic receptor may be an important therapeutic target for the treatment of Alzheimer disease. Studies with DMXBA (GTS-21). Behav. Brain Res. 113, 169–181 [DOI] [PubMed] [Google Scholar]
- 16. Papke R. L., Kem W. R., Soti F., López-Hernández G. Y., Horenstein N. A. (2009) Activation and desensitization of nicotinic α7-type acetylcholine receptors by benzylidene anabaseines and nicotine. J. Pharmacol. Exp. Ther. 329, 791–807 [DOI] [PMC free article] [PubMed] [Google Scholar]
- 17. Williams D. K., Wang J., Papke R. L. (2011) Investigation of the molecular mechanism of the α7 nicotinic acetylcholine receptor positive allosteric modulator PNU-120596 provides evidence for two distinct desensitized states. Mol. Pharmacol. 80, 1013–1032 [DOI] [PMC free article] [PubMed] [Google Scholar]
- 18. Grønlien J. H., Håkerud M., Ween H., Thorin-Hagene K., Briggs C. A., Gopalakrishnan M., Malysz J. (2007) Distinct profiles of α7 nAChR positive allosteric modulation revealed by structurally diverse chemotypes. Mol. Pharmacol. 72, 715–724 [DOI] [PubMed] [Google Scholar]
- 19. Wang J., Horenstein N. A., Stokes C., Papke R. L. (2010) Tethered agonist analogs as site-specific probes for domains of the human α7 nicotinic acetylcholine receptor that differentially regulate activation and desensitization. Mol. Pharmacol. 78, 1012–1025 [DOI] [PMC free article] [PubMed] [Google Scholar]
- 20. Grutter T., Prado de Carvalho L., Le Novère N., Corringer P. J., Edelstein S., Changeux J. P. (2003) An H-bond between two residues from different loops of the acetylcholine binding site contributes to the activation mechanism of nicotinic receptors. EMBO J. 22, 1990–2003 [DOI] [PMC free article] [PubMed] [Google Scholar]
- 21. Xiu X., Puskar N. L., Shanata J. A., Lester H. A., Dougherty D. A. (2009) Nicotine binding to brain receptors requires a strong cation-pi interaction. Nature 458, 534–537 [DOI] [PMC free article] [PubMed] [Google Scholar]
- 22. Puskar N. L., Xiu X., Lester H. A., Dougherty D. A. (2011) Two neuronal nicotinic acetylcholine receptors, α4β4 and α7, show differential agonist binding modes. J. Biol. Chem. 286, 14618–14627 [DOI] [PMC free article] [PubMed] [Google Scholar]
- 23. Wang J., Papke R. L., Horenstein N. A. (2009) Synthesis of H-bonding probes of α7 nAChR agonist selectivity. Bioorg. Med. Chem. Lett. 19, 474–476 [DOI] [PMC free article] [PubMed] [Google Scholar]
- 24. Papke R. L., Porter Papke J. K. (2002) Comparative pharmacology of rat and human α7 nAChR conducted with net charge analysis. Br. J. Pharmacol. 137, 49–61 [DOI] [PMC free article] [PubMed] [Google Scholar]
- 25. Williams D. K., Stokes C., Horenstein N. A., Papke R. L. (2011) The effective opening of nicotinic acetylcholine receptors with single agonist binding sites. J. Gen. Physiol. 137, 369–384 [DOI] [PMC free article] [PubMed] [Google Scholar]
- 26. Hibbs R. E., Sulzenbacher G., Shi J., Talley T. T., Conrod S., Kem W. R., Taylor P., Marchot P., Bourne Y. (2009) Structural determinants for interaction of partial agonists with acetylcholine binding protein and neuronal α7 nicotinic acetylcholine receptor. EMBO J. 28, 3040–3051 [DOI] [PMC free article] [PubMed] [Google Scholar]
- 27. Jacobson M. P., Pincus D. L., Rapp C. S., Day T. J., Honig B., Shaw D. E., Friesner R. A. (2004) A hierarchical approach to all-atom protein loop prediction. Proteins 55, 351–367 [DOI] [PubMed] [Google Scholar]
- 28. Case D. A., Darden T. A., Cheatham T. E., Simmerling C. L., Wang J., Duke R. E., Luo R., Crowley M., Walker R. C., Zhang W., Merz K. M., Wang B., Hayik S., Roitberg A., Seabra G., Kolossváry I., Wong K. F., Paesani F., Vanicek J., Wu X., Brozell S. R., Steinbrecher T., Gohlke H., Yang L., Tan C., Mongan J., Hornak V., Cui G., Mathews D. H., Seetin M. G., Sagui C., Babin V., Kollman P. A. (2008) Amber 10, University of California, San Francisco, CA [Google Scholar]
- 29. Chen V. B., Arendall W. B., 3rd, Headd J. J., Keedy D. A., Immormino R. M., Kapral G. J., Murray L. W., Richardson J. S., Richardson D. C. (2010) MolProbity. All-atom structure validation for macromolecular crystallography. Acta Crystallogr. D Biol. Crystallogr. 66, 12–21 [DOI] [PMC free article] [PubMed] [Google Scholar]
- 30. Zoltewicz J. A., Prokai-Tatrai K., Bloom L. (1993) Long range transmission of polar effects in cholinergic 3-arylideneanabaseines. Conformations calculated by molecular modelling. Heterocycles 35, 171–180 [Google Scholar]
- 31. Young G. T., Zwart R., Walker A. S., Sher E., Millar N. S. (2008) Potentiation of α7 nicotinic acetylcholine receptors via an allosteric transmembrane site. Proc. Natl. Acad. Sci. U.S.A. 105, 14686–14691 [DOI] [PMC free article] [PubMed] [Google Scholar]
- 32. Papke R. L., Trocmé-Thibierge C., Guendisch D., Al Rubaiy S. A., Bloom S. A. (2011) Electrophysiological perspectives on the therapeutic use of nicotinic acetylcholine receptor partial agonists. J. Pharmacol. Exp. Ther. 337, 367–379 [DOI] [PMC free article] [PubMed] [Google Scholar]