

Abstract
Background
Recently, the Nijmegen Continuity Questionnaire (NCQ) was developed. It aims to measure continuity of care from the patient perspective across primary and secondary care settings. Initial pilot testing proved promising.
Aim
To further examine the validity, discriminative ability, and reliability of the NCQ.
Design
A prospective psychometric instrument validation study in primary and secondary care in the Netherlands.
Method
The NCQ was administered to patients with a chronic disease recruited from general practice (n = 145) and hospital outpatient departments (n = 123) (response rate 76%). A principal component analysis was performed to confirm three subscales that had been found previously. Construct validity was tested by correlating the NCQ score to scores of other scales measuring quality of care, continuity, trust, and satisfaction. Discriminative ability was tested by investigating differences in continuity subscores of different subgroups. Test–retest reliability was analysed in 172 patients.
Results
Principal factor analysis confirmed the previously found three continuity subscales — personal continuity, care provider knows me; personal continuity, care provider shows commitment; and team/cross-boundary continuity. Construct validity was demonstrated through expected correlations with other variables and discriminative ability through expected differences in continuity subscores of different subgroups. Test–retest reliability was high (the intraclass correlation coefficient varied between 0.71 and 0.82).
Conclusion
This study provides evidence for the validity, discriminative ability, and reliability of the NCQ. The NCQ can be of value to identify problems in continuity of care.
Keywords: continuity of patient care; factor analysis, statistical; healthcare surveys; questionnaires; reproducibility of results
INTRODUCTION
Continuity of care is an important characteristic of good health care. It has a positive impact on the health of people and populations and reduces medical errors.1–4 Continuity of care is, nowadays, considered a multidimensional concept.5–8 It comprises providers’ knowledge of the patient as a person, the development of an ongoing relationship (personal continuity), and communication and collaboration between care providers to connect care. For this last dimension, slightly different concepts of informational continuity, management continuity, or team/cross-boundary continuity are used in the literature, although they have proven difficult to differentiate for patients.9
Measuring continuity allows for the identification of problems and evaluation of interventions or changes in healthcare systems aimed at improving continuity of care. To explore and improve health care, it is especially important to measure continuity of care from the patients’ perspective, particularly patients with multimorbidity.10 Disease-specific instruments cannot be used for this purpose.
Recently, the Nijmegen Continuity Questionnaire (NCQ), a generic questionnaire that aims to measure patients’ perceptions of personal, team, and cross-boundary continuity, regardless of morbidity and care setting, was developed.11 In a preliminary study, the NCQ proved to be promising for use with patients in primary care; however, further testing of reliability and validity is needed before it can be more widely implemented. The aim of this study, therefore, was to assess the psychometric properties (validity and reliability) of the NCQ.
METHOD
Participants and design
In The Netherlands, every patient is registered with a GP. The GP functions as a gatekeeper for secondary care, which is provided in a hospital/outpatient department. In a previous pilot study, the NCQ was distributed among patients with a chronic disease recruited from general practice.11 As the NCQ had been changed during the pilot testing, and it was wanted to test it in both primary and secondary care, another sample of participants was used.
In January 2010, 19 GP trainees working in practices in the eastern part of The Netherlands were asked to distribute 20 NCQs each to patients with ≥1 chronic disease. For these patients, continuity is particularly important. At the same time, six medical specialists (oncologist, internist, cardiologist, lung specialist, psychiatrist, and rheumatologist) working in an academic hospital in Nijmegen were asked to distribute 30 questionnaires each to patients in the polyclinic outpatients department.
Patients aged <18 years or those who were unable to speak or read Dutch were excluded. Patients filled in the NCQ at home and could send it back to the researchers. The GP trainees and specialists registered age, sex, and type of chronic disease(s) of participating patients; GP trainees completed some questions on the type of practice in which they worked.
How this fits in
The Nijmegen Continuity Questionnaire (NCQ) was developed and aims tomeasure patients' experienced personal, team, and cross-boundary continuity of care, regardless ofmorbidity and acrossmultiple care settings. In a previous study, the NCQ showed to be promising in primary care; this study provides evidence to support the validity, discriminative ability, and reliability of the NCQ. The NCQmay be valuable in terms of: detecting problems in the care continuum; comparing continuity experiences for different diseases and multimorbidity patterns; and evaluating interventions or changes in healthcare systems aimed at improving continuity of care.
Ethical approval for the study was granted by the ethics committee Arnhem-Nijmegen.
Measurement instruments
The NCQ (Available from the authors on request) consists of 28 items within the following three subscales:
personal continuity: care provider knows me (five items each for two different providers);
personal continuity: care provider shows commitment (three items each for two different providers); and
team/cross-boundary continuity (four items each for three different groups of providers).
Items were scored on a five-point Likert scale ranging from 1 (strongly disagree) to 5 (strongly agree), with an additional option to choose ‘?’ (‘I do not know’). Patients recruited by the specialist also filled in questions about their GP and vice versa.
As well as the NCQ, all patients were asked to complete the following:
The ‘care suits patient’ subscale of the Consumer Quality Index General Practice Care questionnaire.12 The questionnaire measures patients’ experiences with general practice care and the subscale measures whether that care suits the patient, corresponding to their experiences with continuity. The subscale consists of nine items, which are scored on a four-point scale ranging from ‘never’ to ‘always’ (Appendix 2 available from the author on request). The option ‘not applicable’ was available for some items. The Consumer Quality Index has shown to be a valid and reliable instrument for measuring the quality of general practice; the higher the score, the better the primary care experience.
The Continuity of Care from the Client Perspective (VCC) questionnaire.13 This Dutch questionnaire was developed in 1998 to measure continuity of care from the perspective of patients with a chronic disease living at home. The questionnaire comprises items concerning patients’ experiences with their GP, medical specialist, physiotherapist, occupational therapist, dietitian, speech therapist, podiatrist, and home care. Patients were asked to answer only the questions concerning their GP (13 items) and their medical specialist (14 items) (Appendix 3 available from the author on request). Items are scored on a five-point scale, with an additional option of ‘not applicable’. Initial testing has shown that this questionnaire is a valid instrument with medium reliability.
Two questions on satisfaction (‘I am satisfied with the care I receive from my GP/specialist’).
Two questions about trust (‘I have trust in my GP/specialist’).
Validity
The following hypotheses were generated to assess construct validity:
Principal component analysis would confirm the previously found three continuity subscales11 — personal continuity: care provider knows me, personal continuity: care provider shows commitment, and team/cross-boundary continuity;
Higher scores on the three subscales about general practice (personal continuity: GP knows me, personal continuity: GP shows commitment, team/cross-boundary continuity between care providers within general practice) would be highly positively associated with scores on the Consumer Quality Index subscale ‘care suits patient’, the VCC the subscale general practice, and GP trust and satisfaction scores.
Scores on the three subscales about hospital/outpatient department care (personal continuity: specialist knows me, personal continuity: specialist shows commitment, team/cross-boundary continuity between care providers within hospital/outpatient department) would be highly positively associated with scores on the VCC subscale specialist care and specialist trust and satisfaction scores.
Scores on the team/cross-boundary continuity between GP and specialist subscale would be at least moderately positively associated with scores on the Consumer Quality Index care suits patient subscale, the VCC subscales, and GP and specialist trust and satisfaction scores.
Discriminative ability
The discriminative ability was tested by examining differences in the NCQ subscores for different subgroups. The following hypotheses were generated:
Patients recruited from general practice would experience greater continuity in general practice than in hospital/outpatient departments, whereas patients recruited from hospital/outpatient departments would experience greater continuity in hospital/outpatient department. It was expected that, in general, patients recruited from general practice would contact the hospital/outpatient department less frequently than patients recruited from hospital/outpatient departments and vice versa. Contacting a department infrequently was likely to diminish the levels of continuity experienced by the patient.
Patients who were psychiatrically ill would experience less continuity than those who were somatically ill, for example, those with diabetes mellitus. This hypothesis is powered from the literature.1,14,15
Patients registered in a general practice in a small town (<40 000 inhabitants) would experience more continuity in general practice than patients registered in a general practice in a large town. Patients from a small town are often found to be healthier than their counterparts in larger towns,16 thereby probably seeing fewer care providers, and tending to move less often to another general practice,17 which increases experienced continuity of care.
Patients who contacted one provider in the previous year would experience more personal continuity — be that in general practice or in hospital/outpatient departments — than patients who contacted >1 provider.
Reliability
Test–retest reliability was assessed by having participants complete the NCQ a second time, 2 weeks after their initial completion. No intervention took place in these 2 weeks. In the first questionnaire, participants were asked whether they were willing to fill in one more questionnaire after 2 weeks; if so, they had to write down their address so the retest could be sent by mail. No reminder was sent when participants did not respond.
Analyses
SPSS (version 16.0) was used to analyse the data. Item means, total subscale scores, and the percentage of responders with the highest and lowest subscale scores (ceiling and floor effect) were assessed. The subscale scores were calculated as the mean of the items in each subscale. To calculate this score, cases that were missing more than one question within a subscale were excluded.
Confirmatory principal component analysis with varimax rotation was used to verify the three continuity subscales that had been found previously.11 Principal component analysis was performed on the eight items about the patient–provider relationship across the multiple care settings and per care setting separately. In the first analysis, several observations from one patient are included (observations from the provider in general practice and in hospital/outpatient departments); in the second analysis, the observations are all independent. Principal component analysis was also performed on the four items regarding the collaboration and information exchange between the groups of providers across the multiple care settings and per care setting separately.
Validity was determined by examining the correlations between the total scores for all scales using Pearson’s product moment correlations. A moderate correlation was considered to be 0.3 to ≤0.5, and a high correlation was defined as ≥0.5.18,19 To calculate the total score for each scale, cases were excluded if more than one question within each scale was missing.
Independent student t-tests were conducted to determine the discriminative ability. To determine test–retest reliability, the intraclass correlation coefficient (ICC, two-way random effects model, absolute agreement) for the subscale scores was calculated. Reliability was assessed as good with an ICC of >0.70.20 Furthermore, the consistency of measurements was verified using the method described by Bland and Altman.21 The mean difference between the two measurements and the 95% limits of agreement (mean ±1.96 standard deviation of difference) were calculated for each subscale score. The consistency of measurement according to a Bland-Altman plot for one subscale was visualised.
RESULTS
In total, 14 GP trainees and six specialists participated; respectively they asked 192 and 162 patients to fill in the questionnaires, of which 145 (76%) and 123 (76%) respectively were returned. In total, 268 patients participated.
Patient characteristics
Table 1 shows patients’ characteristics and their medical care. Responders and non-responders did not differ in age (P = 0.34). Responders were more likely than non-responders to be male (P = 0.006).
Table 1.
Characteristics and medical care of responders and non-responders
| Patient characteristics | Recruited by GP (n = 145) | Recruited by specialist (n = 123) | Non-responders (n = 86) |
|---|---|---|---|
| Mean age, years | 66.0 | 57.7 | 56.4 |
| <50 | 13 (9) | 31 (25) | 25 (29) |
| 50–59 | 21 (15) | 32 (26) | 18 (21) |
| 60–69 | 54 (37) | 36 (29) | 16 (19) |
| 70–79 | 40 (28) | 20 (16) | 17 (20) |
| >80 | 17 (12) | 4 (3) | 2 (2) |
| missing | 0 (0) | 0 (0) | 8 (9) |
| Male sex | 67 (46) | 63 (51) | 25 (32) |
| Ethnicity | |||
| Dutch | 137 (95) | 114 (93) | |
| Other | 8 (6) | 9 (7) | |
| Assessment of patients’ own health status (5-point scale) | |||
| (Very) good | 80 (55) | 31 (25) | |
| Neutral | 52 (36) | 59 (48) | |
| (Very) bad | 12 (8) | 30 (24) | |
| Missing | 1 (1) | 3 (2) | |
| Medical care | |||
| Number of chronic diseases according to patient (mean ± SD) | 1.87 ± 1.03 | 2.13 ± 1.20 | |
| Type of chronic diseases | |||
| Diabetes mellitus | 52 (36) | 25 (20) | |
| Asthma/COPD | 28 (19) | 20 (16) | |
| Myocardial infarction | 15 (10) | 24 (20) | |
| CVA/TIA | 7 (5) | 6 (5) | |
| Hypertension | 91 (63) | 38 (31) | |
| Mental disorder | 5 (3) | 21 (17) | |
| Malignancy | 11 (8) | 26 (21) | |
| Disorder of muscles, bones, or joints | 31 (21) | 40 (33) | |
| Other | 23 (16) | 44 (36) | |
| Number of care providers in last year (mean) | |||
| GPs | 1.2 | 1.1 | |
| Medical specialists | 1.1 | 2.1 | |
| Othera | 1.3 | 1.5 | |
| Total | 3.6 | 4.7 | |
| Total number of contacts in the last year in general practice | |||
| 0 times | 0 (0) | 14 (11) | |
| 1 time | 7 (5) | 18 (15) | |
| 2 times | 12 (8) | 23 (19) | |
| 3–5 times | 67 (46) | 30 (24) | |
| >5 times | 53 (37) | 34 (28) | |
| Missing | 6 (4) | 4 (3) | |
| Total number of contacts in the last year in hospital/outpatient department | |||
| 0 times | 51 (35) | 0 (0) | |
| 1 time | 21 (15) | 4 (3) | |
| 2 times | 20 (14) | 14 (11) | |
| 3–5 times | 25 (17) | 42 (34) | |
| >5 times | 24 (167) | 61 (50) | |
| Missing | 4 (3) | 2 (2) | |
Values are n (%) unless otherwise indicated. COPD = chronic obstructive pulmonary disease. CVA = cerebrovascular accident. TIA = transient ischaemic attack.
Mainly nurse practitioners, physician assistants, physiotherapist, occupational therapist, psychologists, social worker, home care, and alternative healer.
Item and subscale analyses
Table 2 shows item means, total subscale scores, the percentage of patients with the highest and lowest subscale scores, and Cronbach’s alpha for the subscales. The percentage of patients with the highest or lowest subscale score was low (<7.5%), so the NCQ does not show a ceiling or floor effect. Internal consistency (Cronbach’s alpha) ranged from 0.86 to 0.96.
Table 2.
Item means and total subscale score
| GP | Most important medical specialist | ||
|---|---|---|---|
| Mean | Mean | ||
| Subscale 1: Personal continuity: care provider knows me | |||
| 1. I know this care provider very well | 3.85 (n = 249) | 3.80 (n = 202) | |
| 2. This care provider knows my medical history very well | 4.00 (n = 247) | 3.97 (n = 198) | |
| 3. This care provider always remembers what he/she did during my last visit(s) | 3.90 (n = 240) | 4.02 (n = 200) | |
| 4. This care provider knows my family circumstances very well | 3.69 (n = 246) | 3.12 (n = 195) | |
| 5. This care provider knows very well what I do in my day-to-day life | 3.28 (n = 246) | 3.22 (n = 196) | |
| Total subscale score | 3.74 (n = 245) | 3.63 (n = 198) | |
| Patients with highest subscale score (ceiling effect), n(%) | 19 (7.1) | 11 (4.1) | |
| Patients with lowest subscale score (floor effect), n(%) | 0 (0) | 2 (0.7) | |
| Internal consistency (Cronbach alpha) | 0.89 | 0.89 | |
| Test-retest: intraclass correlation coefficient (95% CI) | 0.82 (0.76 to 0.87) (n = 150) | 0.81 (0.75 to 0.87) (n = 123) | |
| Test-retest: mean difference between measurements (95% limits of agreement) | 0.07 (–0.82 to 0.97) (n = 150) | –0.02 (–0.90 to 0.86) (n = 123) | |
| Subscale 2: Personal continuity: care provider shows commitment | |||
| 1. This care provider contacts me when necessary without me having to ask him/her to do so | 3.08 (n = 236) | 3.27 (n = 184) | |
| 2. This care provider knows very well what I think is important when it comes to my care | 3.50 (n = 236) | 3.60 (n = 192) | |
| 3. This care provider maintains enough contact with me when I am seen by other care providers | 3.14 (n = 228) | 3.38 (n = 178) | |
| Total subscale score | 3.23 (n = 238) | 3.41 (n = 188) | |
| Patients with highest subscale score (ceiling effect), n(%) | 18 (6.7%) | 18 (6.7%) | |
| Patients with lowest subscale score (floor effect), n(%) | 11 (4.1%) | 7 (2.6%) | |
| Internal consistency (Cronbach alpha) | 0.86 | 0.90 | |
| Test–retest: intraclass correlation coefficient (95% CI) | 0.79 (0.72 to 0.85) (n = 145) | 0.80 (0.72 to 0.86) (n = 117) | |
| Test–retest: mean difference between measurements (95% limits of agreement) | –0.04 (–1.31 to 1.23) (n = 145) | –0.10 (–1.27 to 1.06) (n = 117) | |
| Collaboration between care providers … | |||
| … within general practice | … within hospital/outpatient department | … in general practice and hospital/outpatient department | |
| Mean | Mean | Mean | |
| Subscale 3: Team/cross-boundary continuity | |||
| 1. These care providers pass on information to each other very well | 3.83 (n = 154) | 3.71 (n = 142) | 3.39 (n = 158) |
| 2. These care providers work together very well | 3.87 (n = 152) | 3.68 (n = 141) | 3.30 (n = 148) |
| 3. The care given by these care providers is well-connected | 3.83 (n = 151) | 3.68 (n = 140) | 3.33 (n = 149) |
| 4. These care providers always know very well what the other care providers have done | 3.67 (n = 144) | 3.50 (n = 139) | 3.12 (n = 147) |
| Total subscale score | 3.80 (n = 148) | 3.65 (n = 141) | 3.28 (n = 149) |
| Patients with highest subscale score (ceiling effect), n(%) | 19 (7.1) | 17 (6.3) | 10 (3.7) |
| Patients with lowest subscale score (floor effect), n(%) | 0 (0) | 5 (1.9) | 0 (0) |
| Internal consistency (Cronbach alpha) | 0.96 | 0.96 | 0.95 |
| Test-retest: Intraclass correlation coefficient (95% CI) | 0.71 (0.58 to 0.81) (n = 77) | 0.71 (0.58 to 0.80) (n = 81) | 0.75 (0.64 to 0.83) (n = 90) |
| Test-retest: Mean difference between measurements (95% limits of agreement) | 0.11 (–1.02 to 1.24) (n = 77) 0.09 | (–1.30 to 1.48) (n = 81) | 0.02 (–1.14 to 1.18) (n = 90) |
Mean score (1 = strongly disagree, 2 = disagree, 3 = neutral, 4 = agree, 5 = strongly agree)
Principal component analysis confirmed the three factors that were found in a previous study (hypothesis one, construct validity);11 it was performed on the eight items about the GP and most important medical specialist together and for each care setting separately. Table 3 shows the factor loadings of this first analysis. It resulted in the same two factors as the last analysis — personal continuity: care provider knows me; personal continuity: care provider shows commitment — explaining 73.8% of the overall variance. A principal component analysis was also performed on the four items about collaboration between the groups of providers across the multiple care settings and per care setting separately. This resulted in the same single factor (team/cross-boundary continuity), explaining 88.8% of total variance.
Table 3.
Results of confirmatory principal component analysis
| Factor loadings | |||
|---|---|---|---|
| Factor 1 | Factor 2 | Factor 3 | |
| Principal component analysis on items about the collaboration and information exchange between care providers | |||
| Eigenvalue: 5.207 | Eigenvalue: 0.695 | Eigenvalue: 3.552 | |
| Personal continuity: care provider knows me | |||
| 1. I know this care provider very well (n = 443) | 0.808 | ||
| 2. This care provider knows my medical history very well (n = 437) | 0.799 | ||
| 4. This care provider knows my family circumstances very well (n = 432) | 0.799 | ||
| 3. This care provider always remembers what he/she did during my last visit(s) (n = 432) | 0.638 | 0.441 | |
| 5. This care provider knows very well what I do in my day-to-day life (n = 433) | 0.629 | 0.533 | |
| Personal continuity: care provider shows commitment | |||
| 1. This care provider contacts me when necessary without me having to ask him/her to do so (n = 411) | 0.857 | ||
| 3. This care provider maintains enough contact with me when I am seen by other care providers (n = 397) | 0.840 | ||
| 2. This care provider knows very well what I think is important when it comes to my care (n = 419) | 0.488 | 0.723 | |
| Principal component analysis on items about patient–provider relationship | |||
| Team and cross-boundary continuity | |||
| 2. These care providers work together very well (n = 361) | 0.959 | ||
| 3. The care given by these care providers is well-connected (n = 360) | 0.947 | ||
| 1. These care providers pass on information to each other very well (n = 373) | 0.933 | ||
| 4. These care providers always know very well what the other care providers have done (n = 353) | 0.930 | ||
Values <0.40 are suppressed. Missing values were excluded pairwise.
Construct validity
Table 4 shows the correlations between the NCQ and patient variables. As in hypothesis two, high correlations were found between the three subscales on general practice and the care suits patient subscale of the Consumer Quality Index (r = 0.57–0.75, P<0.01), the general practice subscale of the VCC questionnaire (r = 0.58–0.61, P<0.01), and GP trust (r = 0.59–0.64, P<0.01) and satisfaction (r = 0.63–0.67, P<0.01) scores.
Table 4.
Correlations among factors and patient variables
| Personal continuity | Team/cross-boundary continuity | ||||||
|---|---|---|---|---|---|---|---|
| GP knows me | GP shows commitment | Specialist knows me | Specialist shows commitment | Between care providers within general practice | Between care providers within hospital | Between GP and specialist | |
| Personal continuity: | |||||||
| GP shows commitment | 0.76b (n = 234) | – | – | – | – | – | – |
| Specialist knows me | 0.28b (n = 185) | 0.26b (n = 183) | – | – | – | – | – |
| Specialist shows commitment | 0.24b (n = 175) | 0.29b (n = 177) | 0.80b (n = 185) | – | – | – | – |
| Team/cross-boundary continuity: | |||||||
| Between care providers within general practice | 0.55b (n = 141) | 0.63b (n = 136) | –0.03 (n = 106) | –0.05 (n = 104) | – | – | – |
| Between care providers within hospital/outpatient department | 0.18a (n = 131) | 0.12 (n = 131) | 0.46b (n = 134) | 0.46b (n = 131) | 0.19 (n = 79) | – | – |
| Between GP and specialist | 0.39b (n = 145) | 0.48b (n = 142) | 0.39b (n = 140) | 0.39b (n = 133) | 0.54b (n = 91) | 0.51b (n = 115) | – |
| Care suits patients subscale of the consumer Quality Index General Practice Care questionnaire | 0.57b (n = 147) | 0.75b (n = 146) | 0.06 (n = 124) | 0.07 (n = 119) | 0.68b (n = 94) | 0.06 (n = 94) | 0.47b (n = 103) |
| VCC GP | 0.61b (n = 49) | 0.61b (n = 48) | 0.06 (n = 45) | 0.11 (n = 45) | 0.58b (n = 37) | 0.39a (n = 38) | 0.56b (n = 43) |
| VCC specialist | 0.35a (n = 40) | 0.14 (n = 41) | 0.56b (n = 40) | 0.63b (n = 40) | 0.17 (n = 25) | 0.73b (n = 36) | 0.65b (n = 34) |
| Trust in GP | 0.63b (n = 242) | 0.64b (n = 235) | 0.05 (n = 192) | –0.01 (n = 183) | 0.59b (n = 146) | 0.02 (n = 137) | 0.30b (n = 147) |
| Trust in specialist | 0.18b (n = 197) | 0.16b (n = 195) | 0.59b (n = 196) | 0.56b (n = 187) | 0.09 (n = 110) | 0.46b (n = 140) | 0.27b (n = 145) |
| Satisfaction from care of GP | 0.63b (n = 242) | 0.67b (n = 235) | 0.04 (n = 192) | –0.02 (n = 183) | 0.63b (n = 146) | 0.03 (n = 137) | 0.38b (n = 147) |
| Satisfaction from care of specialist | 0.17a (n = 195) | 0.14 (n = 193) | 0.59b (n = 194) | 0.54b (n = 185) | 0.10 (n = 108) | 0.48b (n = 139) | 0.33b (n = 144) |
P<0.05;
P<0.01; VCC: Continuity of Care from the Client Perspective questionnaire.
High correlations were also found between the three subscales on hospital/outpatient department care and the specialist care subscale of the VCC questionnaire (r = 0.56–0.73, P<0.01, hypothesis three). Two subscales (personal continuity: specialist knows me; personal continuity: specialist shows commitment) were highly correlated to specialist trust (r = 0.56–0.59, P<0.01) and satisfaction (r = 0.54–0.59, P<0.01) scores, whereas one subscale (team/cross-boundary continuity between care providers within hospital/outpatient departments) was moderately correlated to specialist trust (r = 0.46, P<0.01) and satisfaction (r = 0.48, P<0.01) scores (hypothesis three).
The team/cross-boundary continuity between GP and specialist subscale was at least moderately associated with the care suits patient subscale of the Consumer Quality Index (r = 0.47, P<0.01), VCC subscales (r = 0.56–0.65, P<0.01), GP trust (r = 0.30, P<0.01), GP satisfaction (r = 0.38, P<0.01), and specialist satisfaction (r = 0.33, P<0.01) scores. It was weakly correlated with specialist trust scores (r = 0.27, P<0.01) (hypothesis four).
Discriminative ability
Table 5 shows the continuity subscores of different subgroups. As outlined in hypothesis one, patients recruited from general practice experienced significantly more personal and team continuity in general practice, whereas patients recruited from hospital/outpatient departments experienced more personal continuity in hospital/outpatient departments. The score of team continuity in hospital/outpatient departments did not differ between these subgroups.
Table 5.
Continuity subscores of different subgroups
| Personal continuity | Team/cross-boundary continuity | ||||||
|---|---|---|---|---|---|---|---|
| GP knows me | GP shows commitment | Specialist knows me | Specialist shows commitment | Between care providers within general practice | Between care providers within hospital | Between GP and specialist | |
| Patients recruited from general practice | 3.86 (0.70) (n = 135) | 3.45 (0.87) (n = 128) | 3.31 (0.82) (n = 75) | 2.96 (1.04) (n=92) | 4.03 (0.64) (n = 81) | 3.61 (0.98) (n = 46) | 3.40 (0.80) (n = 59) |
| Patients recruited from hospital/outpatient department | 3.59b (0.78) (n = 110) | 2.97b (1.07) (n = 110) | 3.85b (0.64) (n = 117) | 3.71b (0.84) (n = 113) | 3.44b (0.82) (n = 56) | 3.66 (0.97) (n = 95) | 3.20 (0.92) (n = 90) |
| Patients with a psychiatric illness | 3.41 (0.78) (n = 26) | 2.72 (1.03) (n = 26) | 3.63 (0.81) (n = 23) | 3.29 (1.04) (n = 21) | 3.60 (0.73) (n=12) | 3.40 (1.12) (n = 17) | 3.24 (0.64) (n = 20) |
| Patients with diabetes mellitus | 3.77a (0.74) (n = 214) | 3.29b (0.97) (n = 208) | 3.62 (0.76) (n = 171) | 3.43 (0.99) (n = 163) | 3.83 (0.78) (n = 133) | 3.68 (0.95) (n = 124) | 3.29 (0.91) (n = 129) |
| Patients registered in a general practice in a town <40 000 inhabitants | 3.81 (0.72) (n = 183) | 3.31 (1.00) (n = 175) | 3.54 (0.79) (n = 143) | 3.33 (1.02) (n = 132) | 3.89 (0.74) (n = 115) | 3.61 (0.98) (n = 99) | 3.35 (0.90) (n = 106) |
| Patients registered in a general practice in a town >40 000 inhabitants | 3.54a (0.79) (n = 61) | 2.97a (0.93) (n = 62) | 3.86b (0.64) (n = 54) | 3.58 (0.90) (n = 55) | 3.53a (0.80) (n = 32) | 3.78 (0.93) (n = 41) | 3.12 (0.82) (n = 42) |
| Patients who saw 1 care provider in the last year | 4.18 (0.76) (n = 12) | 3.85 (0.66) (n = 10) | 3.55 (0.07) (n = 2) | 3.33 (0.00) (n = 2) | – | – | – |
| Patients who saw >1 care provider in the last year | 3.72a (0.74) (n = 230) | 3.20a (1.00) (n = 225) | 3.64 (0.77) (n = 192) | 3.42 (1.00) (n = 182) | 3.74 (0.76) (n = 134) | 3.66 (n = 0.99) (n = 136) | 3.27 (0.88) (n = 144) |
Data are shown as mean (SD);
P<0.05;
P<0.01. SD = standard deviation.
In agreement with the second hypothesis, patients who were psychiatrically ill experienced significantly less personal continuity from their GP than those with diabetes. No difference was found in other continuity subscores.
As suggested in hypothesis three, patients registered in a general practice in a small town experienced more personal and team continuity in general practice than patients registered in a general practice in a larger town.
Patients who saw one provider in the previous year experienced more personal continuity in general practice than patients who saw more providers (hypothesis four). No differences in personal continuity in hospital/outpatient departments were found (hypothesis four).
Reliability
In total, 184 patients (69%) agreed to fill in a repeat questionnaire, of whom 172 (93%) returned the retest. Patients who agreed to participate did not differ from those who did not agree in terms of age (P = 0.87), sex (P = 0.47), number of chronic diseases (P = 0.76), and NCQ subscale scores (0.18 to 0.96).
Table 2 shows the ICC per subscale for each provider(s) or group of providers; ICCs varied between 0.71 and 0.82. Table 2 also shows the mean difference between the two measurements and the limits of agreement for each subscale. The mean difference between the two measurements varied between –0.10 and 0.11. The limits of agreement are smallest for the personal continuity: care provider knows me subscale. Figure 1 shows the Bland-Altman plot of the personal continuity: GP knows me subscale. It visually shows the mean difference between test and retest (0.07) with its 95% limits of agreement (–082 to 0.97) plotted against the mean of the sum scores.
Figure 1.
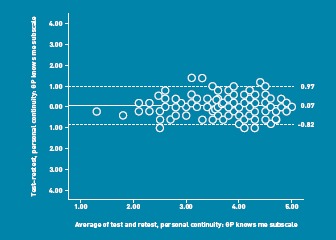
Bland-Altman plot of the personal continuity: GP knows me subscale. Intra-individual differences between test and retest responses plotted against the mean of the sum scores. The solid line represents the mean of the intra-individual differences. The dashed lines define the 95% limits of agreement. Mean of the difference ± 1.96 standard deviation.
DISCUSSION
Summary
This study provides evidence for the validity, discriminative ability, and reliability of the NCQ as a generic questionnaire that measures patients’ experiences of continuity of care as a multidimensional concept, regardless of care setting and morbidity.
Building on previous research,11 this study provides further evidence of its construct validity through the results of the confirmatory principal component analysis and the hypothesised correlations found between the NCQ and other scales measuring quality of care, continuity of care, trust, and satisfaction. Evidence for the discriminative ability of the NCQ is provided by (hypothesised) differences in continuity subscores of different subgroups. The reliability is further supported with the results of the test–retest and the internal consistencies of the subscales.
Strengths and limitations
One limitation is that only patients with a chronic disease were included, which reduces generalisability of the tool. However, patients with ≥1 chronic disease were purposively selected as, for these patients, continuity is particularly important.22–24
Another limitation is the possible recruitment bias. Providers could decide for themselves which patients to ask to participate. GP trainees, more than medical specialists, approached fewer patients than requested. Data of patients that met the inclusion criteria, but were not approached by their provider, were not available.
A last limitation is the finding that, as hypothesised, patients experienced more continuity over the place of recruitment. This may also reflect the likeliness to express satisfaction with the care organisation in which participants are given the questionnaire. The study tried to reduce this potential bias by asking patients to fill in the NCQ at home and send it back to the researchers.
A Cronbach’s alpha of >0.90 was found on the team/cross-boundary subscale, which can imply item redundancy. However, this subscale includes only four items, so was not necessary to shorten the questionnaire.
The NCQ does not show a floor or ceiling effect, so it could perhaps be capable of showing changes in continuity scores over time (responsiveness). This will need further testing.
A strength of this study is that patients from both primary and secondary care were included. The sample size and response rate of participants were high, which strengthens the results and conclusion of this study.
Comparison with existing literature
In a previous study, the NCQ proved to be promising for use with patients in primary care.11 In this preliminary study, the internal consistencies of the subscales and the interscale correlations also provided evidence of a reliable and valid questionnaire with good discriminant abilities.
Implications for practice
Nowadays, an increasing number of providers are involved in the care of patients, especially patients with a chronic disease; this can threaten the continuity of patients’ care. The NCQ is able to identify problems and could evaluate interventions or changes in healthcare systems aimed at improving continuity of care. This will be an important area for further research, given that poor continuity is suspected to have a negative impact on the health of people and populations and also increases medical errors.1–4 Moreover, the NCQ can be used to compare continuity experiences for different diseases and multimorbidity patterns.
Generalisability to other countries
The questionnaire was developed and tested in The Netherlands, a country where the GP is a gatekeeper. It is likely that it is easily applicable in other countries that have the same care system, such as the UK. In countries with a different care system, the GP could perhaps be replaced by another provider, which could make the questionnaire applicable to other care systems. More research is needed regarding the generalisability of the tool to other countries.
Funding
Funding for this study was supplied by Frans Huygen Foundation, Nijmegen, The Netherlands
Ethical approval
Ethical approval was granted by the Medical Ethics Committee Arnhem-Nijmegen.
Provenance
Freely submitted; externally peer reviewed.
Competing interests
The authors have declared no competing interests.
Discuss this article
Contribute and read comments about this article on the Discussion Forum: http://www.rcgp.org.uk/bjgp-discuss
REFERENCES
- 1.Adair CE, McDougall GM, Mitton CR, et al. Continuity of care and health outcomes among persons with severe mental illness. Psychiatr Serv. 2005;56(9):1061–1069. doi: 10.1176/appi.ps.56.9.1061. [DOI] [PubMed] [Google Scholar]
- 2.Hänninen J, Takala J, Keinänen-Kiukaanniemi S. Good continuity of care may improve quality of life in type 2 diabetes. Diabetes Res Clin Pract. 2001;51(1):21–27. doi: 10.1016/s0168-8227(00)00198-4. [DOI] [PubMed] [Google Scholar]
- 3.Moore C, Wisnivesky J, Williams S, McGinn T. Medical errors related to discontinuity of care from an inpatient to an outpatient setting. J Gen Intern Med. 2003;18(8):646–651. doi: 10.1046/j.1525-1497.2003.20722.x. [DOI] [PMC free article] [PubMed] [Google Scholar]
- 4.Stange KC, Ferrer RL. The paradox of primary care. Ann Fam Med. 2009;7(4):293–299. doi: 10.1370/afm.1023. [DOI] [PMC free article] [PubMed] [Google Scholar]
- 5.Gulliford M, Cowie L, Morgan M. Relational and management continuity survey in patients with multiple long-term conditions. J Health Serv Res Policy. 2011;16(2):67–74. doi: 10.1258/jhsrp.2010.010015. [DOI] [PubMed] [Google Scholar]
- 6.Haggerty JL, Reid RJ, Freeman GK, et al. Continuity of care: a multidisciplinary review. BMJ. 2003;327(7425):1219–1221. doi: 10.1136/bmj.327.7425.1219. [DOI] [PMC free article] [PubMed] [Google Scholar]
- 7.Reid R, Haggerty J, McKendry R. Defusing the confusion: concepts and measures of continuity of health care. Prepared for the Canadian Health Services Research Foundation, the Canadian Institute for health information and the advisory committee on health services of the federal/provincial/territorial Deputy Ministers of Health, 2002. http://www.chsrf.ca/Migrated/PDF/ResearchReports/CommissionedResearch/cr_contcare_e.pdf (accessed 6 Jun 2012). [Google Scholar]
- 8.Uijen AA, Schers HJ, Schellevis FG, van den Bosch WJ. How unique is continuity of care? A review of continuity and related concepts. Fam Pract. 2011. [Epub ahead of print] [DOI] [PubMed]
- 9.Gulliford M, Naithani S, Morgan M. Continuity of care in type 2 diabetes: patients’, professionals’ and carers’ experiences and health outcomes. Research summary. London: National Co-ordinating Centre for NHS Service Delivery and Organisation Research and Development; 2006. [Google Scholar]
- 10.Uijen AA, Schers HJ, van Weel C. Continuity of care preferably measured from the patients’ perspective. J Clin Epidemiol. 2010;63(9):998–999. doi: 10.1016/j.jclinepi.2010.03.015. [DOI] [PubMed] [Google Scholar]
- 11.Uijen AA, Schellevis FG, van den Bosch WJ, et al. Nijmegen Continuity Questionnaire: development and testing of a questionnaire that measures continuity of care. J Clin Epidemiol. 2011;64(12):1391–1399. doi: 10.1016/j.jclinepi.2011.03.006. [DOI] [PubMed] [Google Scholar]
- 12.Meuwissen LE, de Bakker DH. [‘Consumer quality’-index ‘General practice care’ measures patients’ experiences and compares general practices with each other] Ned Tijdschr Geneeskd. 2009;153:A180. [PubMed] [Google Scholar]
- 13.Casparie AF, Foets M, Raaijmakers MF, et al. Utrecht, the Netherlands: NIVEL; 1998. Onderzoeksprogramma Kwaliteit van Zorg: vragenlijst continuïteit van zorg vanuit cliëntperspectief VCC: handleiding en vragenlijsten. [Google Scholar]
- 14.Chien CF, Steinwachs DM, Lehman A, Fahey M, Skinner EA. Provider continuity and outcomes of care for persons with schizophrenia. Ment Health Serv Res. 2000;2(4):201–211. [Google Scholar]
- 15.Uijen AA, Bischoff EWMA, Schellevis FG, et al. COPD patients’ experienced continuity in different care modes and its relation to quality of life. Br J Gen Pract. 2012 doi: 10.3399/bjgp12X649115. DOI: 10.3399/bjgp12X649115. [DOI] [PMC free article] [PubMed] [Google Scholar]
- 16.Verheij RA. Explaining urban-rural variations in health: a review of interactions between individual and environment. Soc Sci Med. 1996;42(6):923–935. doi: 10.1016/0277-9536(95)00190-5. [DOI] [PubMed] [Google Scholar]
- 17.Schellevis FG, Jabaaij L. [Continuiteit en verhuizende patienten] Huisarts Wet. 2006;2:104. [Google Scholar]
- 18.Burns N, Grove SK. The practice of nursing research. 4th edn. Philadelphia, US: W.B. Saunders; 2001. [Google Scholar]
- 19.Cohen J. Statistical power analysis for the behavioral sciences. 2nd edn. Mahwah, NJ: Lawrence Erlbaum Associates; 1988. [Google Scholar]
- 20.Terwee CB, Bot SD, de Boer MR, et al. Quality criteria were proposed for measurement properties of health status questionnaires. J Clin Epidemiol. 2007;60(1):34–42. doi: 10.1016/j.jclinepi.2006.03.012. [DOI] [PubMed] [Google Scholar]
- 21.Bland JM, Altman DG. Statistical methods for assessing agreement between two methods of clinical measurement. Lancet. 1986;1(8476):307–310. [PubMed] [Google Scholar]
- 22.Cheraghi-Sohi S, Hole AR, Mead N, et al. What patients want from primary care consultations: a discrete choice experiment to identify patients’ priorities. Ann Fam Med. 2008;6(2):107–115. doi: 10.1370/afm.816. [DOI] [PMC free article] [PubMed] [Google Scholar]
- 23.Gerard K, Salisbury C, Street D, et al. Is fast access to general practice all that should matter? A discrete choice experiment of patients’ preferences. J Health Serv Res Policy. 2008;13(Suppl 2):3–10. doi: 10.1258/jhsrp.2007.007087. [DOI] [PubMed] [Google Scholar]
- 24.Turner D, Tarrant C, Windridge K, et al. Do patients value continuity of care in general practice? An investigation using stated preference discrete choice experiments. J Health Serv Res Policy. 2007;12(3):132–137. doi: 10.1258/135581907781543021. [DOI] [PubMed] [Google Scholar]