Abstract
Non-technical summary
Intellectual disability has long been attributed at the cellular level to abnormalities in the structures that receive incoming connections to the major classes of neurons in the brain. These misshaped ‘dendrites’ and especially misshaped ‘dendritic spines’ have been found in many types of intellectual disability. We have used a mouse model of one of the human intellectual disability mutations on a gene on the X-chromosome called Ophn-1. We show that, in addition to the misshaped dendritic spines, these mice have abnormal physiology in the inability of both excitatory and inhibitory inputs (‘synapses’) to operate repetitively as they need to in many aspects of normal brain function. A drug known as a Rho-GAP inhibitor was able to reverse the physiological impairment within 20 min, without changing the structure of dendrites or dendritic spines. This class of drug may have a role in limiting disability in this condition.
Abstract
Intellectual disability affects 2–3% of the population: those due to mutations of the X-chromosome are a major cause of moderate to severe cases (1.8/1000 males). Established theories ascribe the cellular aetiology of intellectual disability to malformations of dendritic spines. Recent work has identified changes in synaptic physiology in some experimental models. Here, we investigated the pathophysiology of a mouse model of intellectual disability using electrophysiological recordings combined with confocal imaging of dentate gyrus granule neurons. Lack of oligophrenin-1 resulted in reductions in dendritic tree complexity and mature dendritic spine density and in evoked and spontaneous EPSCs and IPSCs. In the case of inhibitory transmission, the physiological change was associated with a reduction in the readily releasable pool and vesicle recycling which impaired the efficiency of inhibitory synaptic transmission. Acute inhibition of the downstream signalling pathway of oligophrenin-1 fully reversed the functional changes in synaptic transmission but not the dendritic abnormalities. The impaired inhibitory (as well as excitatory) synaptic transmission at frequencies associated with cognitive function suggests a cellular mechanism for the intellectual disability, because cortical oscillations associated with cognition normally depend on inhibitory neurons firing on every cycle.
Introduction
The X-linked mental retardation (XLMR) disorders are a group of single gene mutations which lead to moderate to severe, non-specific intellectual disability (Chelly et al. 2006). While the molecular consequences of these mutations are increasingly well understood, how their physiological consequences result in cognitive impairment remains far from clear. A common feature of mental retardation disorders is abnormal dendritic structure, particularly of dendritic spines (Huttenlocher, 1970; Purpura, 1974), which are the principal site for glutamatergic neurotransmission within the brain (Harris & Kater, 1994). Several of the >82 genes implicated in XLMR encode proteins that control activity of Rho-GTPase signalling pathways, which are major regulators of neuronal morphology and development (Govek et al. 2004; Chiurazzi et al. 2008; Linseman & Loucks, 2008).
Mutations of OPHN-1 cause an XLMR; the gene encodes oligophrenin-1, a protein with a Rho-GAP domain known to negatively regulate RhoA, Rac and Cdc42 (Billuart et al. 1998; Fauchereau et al. 2003). Loss of oligophrenin-1 expression results in intellectual and learning disabilities in humans (Billuart et al. 1998) and learning impairments in mice (Khelfaoui et al. 2007). Reduced expression of oligophrenin-1 has been reported to cause distinct deficits in spine morphology and density (Govek et al. 2004; Khelfaoui et al. 2007), long term depression of synaptic transmission in hippocampal slices (Khelfaoui et al. 2009) and synaptic vesicle endocytosis in culture (Nakano-Kobayashi et al. 2009).
Perhaps as a result of a long standing association of mental retardation with dendritic spine abnormalities, the majority of studies on the pathophysiology of oligophrenin-1 dysfunction have focused on the role of excitatory neurotransmission. Inhibitory synapses form a fundamental component of the neuronal networks necessary for higher cognitive function, in particular the cortical oscillations and rhythmogenesis implicated in cognitive function, which require intact repetitive phasic inhibition (Bartos et al. 2007). GABAergic synapses do not form on dendritic spines (Wierenga et al. 2008), which means that spine dysgenesis is not likely to impact on inhibitory neurotransmission.
To gain a better understanding of the role of oligophrenin-1 in normal brain function and how its loss of function could lead to intellectual disability, we examined synaptic transmission and dendritic morphology from identified granule neurons in the dentate gyrus of the Ophn-1-/y mouse hippocampus. We found abnormal excitatory synaptic transmission in acute brain slices in vitro, consistent with a previous report in culture (Nadif Kasri et al. 2009). In contrast with the previous report, inhibitory synaptic transmission was also reduced, and resulted from a substantial decrease in the readily releasable pool (RRP) of synaptic vesicles and a slowing of vesicle recruitment after RRP depletion. The impaired synaptic transmission was paralleled by altered dendritic morphology, including a reduced density of mature dendritic spines in the same neurons. Synaptic function, but not the altered dendritic morphology, was rescued by small molecule pharmacological inhibition of the downstream signalling pathway of oligophrenin-1.
Methods
Ophn-1−/y mice and wild-type littermates were generated by breeding heterozygote females (Ophn-1+/−) with wild-type males (Ophn-1+/y), resulting in ∼50:50 Ophn-1+/y:Ophn-1−/y. Breeding and experiments were performed under regulation by the Animals (Scientific Procedures) Act 1986 of the UK, and approved by institutional ethical review. Experiments and analysis were performed blind to genotype.
Horizontal hippocampal slices (300 μm thick) were prepared from Ophn-1+/y and Ophn-1−/y age-matched mice (3–8 weeks old) anaesthetised by intraperitoneal injection of medetomidine (1 mg kg−1) and ketamine (76 mg kg−1). Animals were intracardiacally perfused with ∼5 ml of ice-cold cutting solution comprising (mm): 189 sucrose, 26 NaHCO3, 1.2 NaH2PO4, 2.5 KCl, 0.1 CaCl2, 5 MgCl2 and 10 glucose (flow rate ∼2.7 ml min−1). Slices were cut using an Integraslice (Campden Instruments, Loughborough, UK) and stored at room temperature in an interface chamber containing 95% O2–5% CO2-oxygenated artificial cerebrospinal fluid (aCSF; in mm: 135 NaCl, 16 NaHCO3, 1.25 NaH2PO4, 3 KCl, 2 CaCl2, 1 MgCl2 and 10 glucose, pH 7.4). Slices were submerged in a recording chamber, and perfused at 4–5 ml min−1 with warm (29–31°C) aCSF, oxygenated with 95% O2–5% CO2. Slices equilibrated for >10 min before recording, and were changed after ∼1 h.
Electrophysiology
Whole-cell patch-clamp recordings were made from dentate gyrus granule cell somata using infrared DIC (Olympus BX-51 upright microscope, fluorplan 40×, 0.8 NA water immersion lens; Micro Instruments, Long Hanborough, UK). Granule cells were recorded from the outer third of the cell layer in the lateral blade of the dentate gyrus. Patch electrodes were pulled from borosilicate glass (O.D. 1.2 mm, I.D. 0.69 mm; Harvard Apparatus, Edenbridge, UK) using a P-97 puller (Sutter, Novato, CA, USA). To investigate the basic properties of granule neurons, the intracellular solution comprised (mm): 140 KCH3SO4, 8 NaCl, 10 Hepes, 2 Mg-ATP and 0.3 Na-GTP; pH 7.3 with KOH (osmolarity ∼285 mosmol l-1). Alexa 488 (100 μm) was added to the intracellular solution for visualization of dendrites. For IPSC studies, intracellular solution comprised (in mm); 135 CsCl, 2 MgCl2, 10 Hepes, 1 EGTA, 2 Mg-ATP and 0.3 Na-GTP; pH adjusted to 7.3 with KOH (osmolarity ∼285 mosmol l-1); this shifted the reversal potential to 0 mV, resulting in inward IPSCs at –70 mV. Synaptic currents using this electrode solution were confirmed as IPSCs by their abolition by 10 μm bicuculline (not shown). Evoked postsynaptic currents were generated using a stimulating electrode placed in the inner molecular layer ∼50 μm from the recording site. For EPSC studies, intracellular solution comprised (in mm): 135 CsCH3SO4, 8 NaCl, 10 Hepes, 5 QX-314, 2 Mg-ATP and 0.3 Na-GTP; pH 7.3 with KOH (osmolarity ∼285 mosmol l-1). EPSCs were recorded at –75 mV to avoid contamination by IPSCs (reversal potential of IPSCs) and were confirmed as EPSCs by their abolition by 20 μm NBQX and 25 μm d-APV (not shown). Patch electrodes typically had resistances of 4–7 MΩ. Membrane potentials and currents were recorded using an NPI SEC-10L amplifier (Scientifica, Harpenden, UK), low-pass Bessel filtered at 1 kHz (NL-125, Digitimer Ltd, Welwyn Garden City, UK) and digitized at 10 kHz by a Power 1401 (CED Ltd, Cambridge, UK). Stimulation and data acquisition were controlled using Signal software (v. 3; CED).
Peak-scaled variance analysis
Miniature IPSCs were isolated by addition of tetrodotoxin (1 μm) to the aCSF. Variance analysis of miniature IPSCs was performed as described previously (Traynelis et al. 1993) using MiniAnalysis (version 6.0.3, Synaptosoft, Decatur, GA, USA). Criteria for recordings to be included for analysis were the lack of fluctuation of holding current, stability of decay time constant (τ) throughout the recording and lack of correlation between τ and peak amplitude. We analysed 79–187 events per recording; care was to taken to ensure that miniature IPSCs with anomalous noise or double peaks were rejected (see Fig. 4Ba). Events were classed as double peaks if they occurred within 3 times the decay time constant (typically 15 ms).
Figure 4. Peak-scaled noise analysis of miniature IPSCs revealed no difference in GABAA unitary current in Ophn-1-/y neurons.
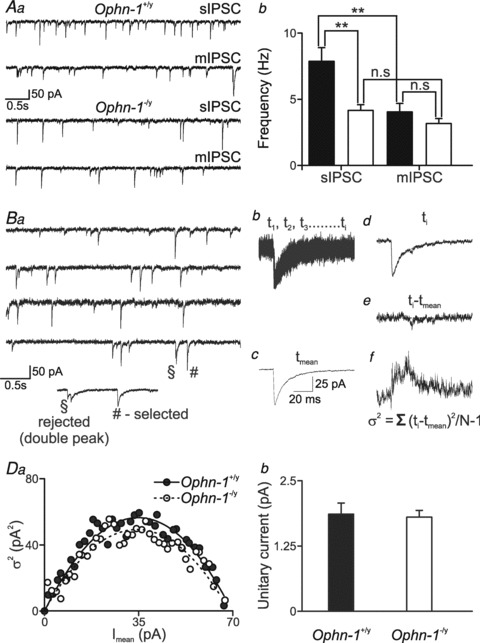
Superfusion of tetrodotoxin (1 μm) reduced the frequency of spontaneous IPSCs in Ophn-1+/y (Aa upper traces and Ab), but not Ophn1−/y neurons (Aa lower traces and Ab). B, protocol for peak-scaled noise analysis of miniature IPSCs. Ba, consecutive miniature recordings used to select events without double peaks or anomalous noise. Bb, 91 superimposed mIPSCs, selected as shown in Ba. Bc, mean waveform of selected events; d, a mIPSC superimposed on the scaled mean waveform; e, difference between the scaled mean waveform and the individual mIPSC; f, σ2 calculated by summing the squares of the difference traces divided by N– 1. Ca, relationship between mean current and peak-scaled variance obtained from Ophn-1+/y (filled circles) and Ophn-1-/y neurons (open circles). b, mean unitary currents in Ophn-1+/y and Ophn-1-/y neurons.
To isolate current fluctuations associated with random channel gating from those occurring due to quantal content or number of postsynaptic receptors, the mean waveform was scaled to the peak of each miniature IPSC and subtracted (Traynelis et al. 1993). The current–variance relationship for the decay of the miniature IPSCs was calculated by dividing the decaying phase into 40 sections based on equal fractional reductions in the amplitude. Baseline variance (σB2) was measured from the post event current and subtracted from the variance associated for each section. The relationship between peak scaled variance σ2(t) and mean amplitude I(t) was fitted with the following equation
where i is the weighted mean unitary current and Nch is the number of channels open at the peak of the synaptic current.
Evaluation of readily releasable pool size
We quantified the readily releasable pool (mature and fusion-competent) using both hypertonic sucrose application (Mozhayeva et al. 2002; Ashton & Ushkaryov, 2005) and cumulative evoked IPSC amplitude analysis during repetitive stimulation (Schneggenburger et al. 1999). Alexa 488 (100 μm) was added to the intracellular solution for visualization of dendrites. Hypertonic aCSF (+0.3 m sucrose; 5 s duration), was applied to the dendrites of the recorded cell via a puff electrode positioned ∼100 μm from the soma and ∼50 μm from the outer edge of the dendritic tree. For the cumulative IPSC studies, a stimulating electrode (2nd patch pipette filled with aCSF) was placed near the dendritic tree ∼50 μm from the soma. Stimulus intensity was varied to achieve minimal stimulation (activation of a single axon/cell). Stimulation was accepted as minimal if (1) evoked IPSC latency remained stable (< 20% variance), (2) lowering stimulus intensity by 20% resulted in a complete failure of evoked IPSCs, and (3) an increase in stimulus intensity by 20% changed neither mean evoked IPSC amplitude nor evoked IPSC shape. The stimulus intensity required for minimal stimulation was 7–9 V and did not differ between genotypes. The RRP size and probability of vesicle release from the RRP were calculated by applying repetitive stimuli (40 pulses at 20 Hz) and calculated as outlined in the Results (Schneggenburger et al. 1999) (Fig. 8).
Figure 8. Smaller RRP and altered vesicle recruitment in Ophn-1−/y neurons.
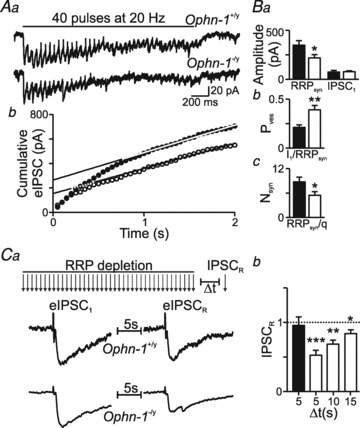
Averaged trains of evoked IPSCs recorded during a 20 Hz train of stimuli in an Ophn-1+/y (Aa, upper trace) and Ophn-1-/y neuron (lower trace). The traces are averages of 5 sweeps. Ab, the corresponding cumulative eIPSC amplitude plot (Ophn-1+/y, filled circles; Ophn-1-/y, open circles). Data between 1 and 2 s were fitted by linear regression and back-extrapolated to time 0 to estimate the RRP size (Ab and Ba). Ba, the mean amplitude of IPSC1 was unaltered in Ophn-1-/y neurons. Bb, mean Pves was increased in Ophn-1-/y neurons, whilst the mean number of vesicles forming the RRPsyn was reduced (Bc). Ca, protocol for assessing vesicle recycling. The readily releasable pool was depleted by 40 minimal stimuli at 20 Hz; after depletion, RRP replenishment was assessed by a further stimulus (IPSCR), Δt seconds after the stimulus train. Vesicle recruitment (IPSCR normalised to IPSC1, Cb) is reduced in Ophn-1-/y neurons. *P < 0.05, **P < 0.01, ***P < 0.001.
Dendritic spine/tree analysis
To correlate alterations in synaptic transmission with potential changes in dendritic arborisation and dendritic spine morphology, granule neurons were whole-cell patch clamped using an internal solution containing Alexa 488 (100 μm). Spontaneous EPSCs were recorded and images of the same cell were obtained using an upright Olympus FV1000 confocal microscope (Olympus Keymed, Southend on Sea, UK). Images to study dendritic arborisation were acquired with a Z resolution of 2 μm and an X–Y resolution of 397 nm pixel−1. Dendritic arborisation was assessed by Sholl analysis; concentric rings were placed at 10 μm intervals, centred on the soma. The complexity of the dendritic tree of each cell was quantified by counting the number of intersections at each ring (Sholl, 1953, 1956). Measurements of dendritic spine density and morphology were taken from unbranched principle dendrites. Images for dendritic spine analysis were acquired with a Z resolution of 0.2 μm and an X–Y resolution of 66 nm pixel−1, and were modified using a 1 pixel wide Gaussian filter prior to analysis of spines. Spines were counted in individual frames by manually scrolling through the z-stacks. All protrusions extending ≥4 pixels (≥264 nm) laterally from the dendritic shaft were measured and categorised according to their shape. Protrusions with a prominent head (larger than neck) were categorised as ‘mushroom’, those larger in the dimension parallel to the dendrite were ‘stubby’ and those larger in the dimension perpendicular to the dendritic spine were ‘filopodia’.
Values are expressed as means ± SEM. Curve fitting and data analysis were performed in Origin 8 (Silverdale Scientific, Stoke Mandeville, UK). Student's unpaired t test (with Bonferonni correction for multiple comparisons) was used to evaluate differences between genotypes; a Shapiro–Wilk tested normality. Paired pulse and repetitive stimulation experiments (Fig. 6) were analysed using ANOVA. The significance criterion was P < 0.05.
Figure 6. Responses to repetitive stimulation are reduced in Ophn-1-/y neurons.
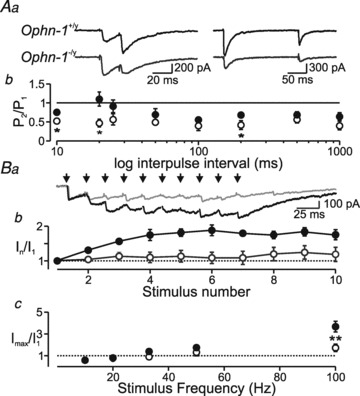
Aa, single-sweep recordings of double-pulse stimulation at stimuli that evoked 30% of the maximal IPSC when delivered singly, at intervals of 20 and 200 ms. Ab, the conditioned IPSC was isolated by digitally subtracting a single IPSC. The charge carried by the 2nd IPSC (normalized to the charge of the 1st IPSC) is plotted against paired pulse intervals for 6 Ophn-1−/y (open circles) and 8 Ophn-1+/y neurons (filled circles). Paired-pulse depression was greater in Ophn-1−/y neurons. Ba, representative traces illustrating IPSC summation in response to 10 stimuli delivered at 50 Hz. The responses to 1st stimuli were normalized. Ophn-1−/y IPSCs (grey trace) showed less summation. Bb, IPSC amplitude plotted against stimulus number for 50 Hz trains in Ophn-1+/y (filled circles, n = 11) and Ophn-1-/y neurons (open circles, n = 9). Bc, maximal IPSC amplitude (mean of the last 5 stimuli) plotted against stimulus frequency (same cells as Ba).
Results
Altered dendritic morphology in Ophn-1−/y neurons
Established theories on the aetiology of mental retardation suggest that alterations in the dendritic architecture and dendritic spine morphology are crucial cellular mechanisms (Newey et al. 2005). We investigated the relationship between granule cell intrinsic properties and the presence of structural abnormalities such as alterations in spine morphology using whole-cell recordings combined with confocal microscopy. Granule cells were filled with Alexa 488 to visualise the dendritic tree and dendritic spines (Fig. 1). The firing characteristics and intrinsic properties of Ophn-1−/y neurons did not differ from Ophn-1+/y neurons (Fig. 1A, Table 1). In contrast, Sholl analysis (Sholl, 1953, 1956) revealed that the dendritic tree branched less in Ophn-1−/y neurons than Ophn-1+/y neurons (Fig. 1B). This was confirmed by the smaller number of branch points (Ophn-1−/y 7 ± 1, Ophn-1+/y 10 ± 1 per cell; P = 0.01; Fig. 1Bc), but the total dendritic length remained unaltered (Ophn-1−/y 840.0 ± 94.8 μm, 11 cells from 6 mice, Ophn-1+/y 1045.9 ± 89.8 μm, 11 cells from 7 mice; P = 0.13; Fig. 1Bc).
Figure 1. Dendritic arborisation and spine density is altered in Ophn-1−/y neurons without alteration in firing characteristics.
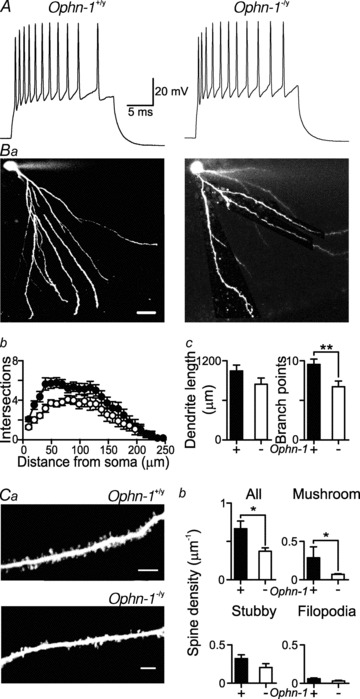
A, representative responses to a 300 pA depolarising current injection in Ophn-1+/y (left panel) and Ophn-1−/y neurons (right panel) (see also Table 1). Ba, representative images of dentate gyrus granule neurons filled with Alexa 488 from Ophn-1+/y (left) and Ophn-1−/y neurons (right); scale bars represent 20 μm. Bb, Sholl analysis showed that dendritic arborisation was reduced in Ophn-1−/y neurons (open circles). Bc, the number of branch points (right panel) but not the total dendritic length (left panel) was reduced in Ophn-1−/y neurons (**P < 0.01). Ca, dendritic spines were more sparse in Ophn-1−/y (lower panel) than Ophn-1+/y (upper panel) neurons, resulting in a lower overall spine density (Cb), which was largely due to a reduction in the density of ‘mushroom’ spines (upper right panel); the density of ‘stubby’ spines (lower left panel) and filopodia (lower right panel) were unaffected (scale bars represent 5 μm). *P < 0.05.
Table 1.
Intrinsic properties of dentate gyrus granule neurons are unaffected by Ophn-1 expression
| Ophn-1+/y | Ophn-1-/y | P | |
|---|---|---|---|
| Resting Membrane Potential (mV) | −73.8 ± 2.4 | −72.9 ± 1.9 | 0.81 |
| Input resistance (MΩ) | 351.3 ± 39.8 | 382.8 ± 62.2 | 0.75 |
| Membrane capacitance (pF) | 93.3 ± 10.1 | 78.2 ± 6.6 | 0.27 |
| Firing frequency (Hz) | 56.3 ± 7 | 67.3 ± 9.5 | 0.39 |
| Action potential threshold (mV) | −37.3 ± 3.5 | −41.4 ± 1.4 | 0.36 |
| Action potential half-width (ms) | 1.55 ± 0.09 | 1.61 ± 0.08 | 0.68 |
| Fast AHP (mV) | −4.1 ± 1.8 | −3.4 ± 1.5 | 0.81 |
| Slow AHP (mV) | −3.7 ± 0.8 | −2.4 ± 0.6 | 0.23 |
Resting membrane potential was the average potential recorded over 200 ms prior to a 200 ms, 300 pA current injection. Membrane resistance was calculated using a 100 pA hyperpolarising current injection. Membrane capacitance was calculated from the input resistance and the time constant, as Cm=τm/Rin.
Alterations in spine morphology have been associated with perturbation in oligophrenin-1 function (Govek et al. 2004; Khelfaoui et al. 2007; Nadif Kasri et al. 2009). Our measurements on intracellularly labelled neurons show that Ophn-1−/y neurons had a lower overall spine density than Ophn-1+/y neurons (Ophn-1−/y 0.31 ± 0.06 μm−1, 11 cells from 6 mice, Ophn-1+/y 0.68 ± 0.11 μm−1, 11 cells from 4 mice; P = 0.02; Fig. 1C). The reduction in spine density was primarily due to a reduction in the number of mature ‘mushroom’ spines (Ophn-1−/y 0.07 ± 0.02 μm−1, Ophn-1+/y 0.29 ± 0.07 μm−1; P = 0.02; Fig. 1Cb). The absence of oligophrenin-1 did not alter the density of filopodia (Ophn-1−/y 0.03 ± 0.01 μm−1, Ophn-1+/y 0.06 ± 0.01 μm−1; P = 0.1) or stubby spines (Ophn-1−/y 0.20 ± 0.05 μm−1, Ophn-1+/y 0.33 ± 0.05 μm−1; P = 0.11) (Fig. 1Cb).
Excitatory neurotransmission is reduced in Ophn-1−/y neurons
The lower density of dendritic spines in Ophn-1−/y, and their primary role in excitatory neurotransmission, led us to test for changes in EPSCs evoked by stimulating the inner molecular layer. The maximum evoked EPSC amplitude was smaller in Ophn-1-/y neurons than in Ophn-1+/y neurons (374 ± 40 pA, 10 cells from 4 mice and 576 ± 85 pA, 9 cells from 4 mice, respectively; P = 0.04; Fig. 2A and B); neither the slope (Ophn-1-/y 0.69 ± 0.1 pA V-1, Ophn-1+/y 0.76 ± 0.13 pA V−1, P = 0.69), nor the half-maximal stimulus strength (Ophn-1-/y 3.9 ± 0.3 V, Ophn-1+/y 3.6 ± 0.4 V, P = 0.55) of the stimulus–response curve was altered in Ophn-1-/y neurons (Fig. 2B). These observations agree with a recent study on cultures and brain slices in which oligophrenin-1 expression had been reduced by RNAi (Nadif Kasri et al. 2009). Here the frequency of spontaneous EPSCs in Ophn-1-/y neurons was approximately half that in Ophn-1+/y neurons (1.3 ± 0.7 Hz and 2.7 ± 0.6 Hz, respectively; 9 cells from 4 mice for both genotypes, P = 0.03; Fig. 2Ca and Da), paralleling the smaller evoked EPSCs. The amplitude of spontaneous EPSCs was unaffected in Ophn-1-/y neurons (Ophn-1-/y 13.8 ± 0.6 pA, Ophn-1+/y 14.5 ± 1.0 pA; P = 0.51; Fig. 2Cb and Db).
Figure 2. Excitatory neurotransmission onto dentate gyrus granule cells is reduced in Ophn-1-/y neurons.
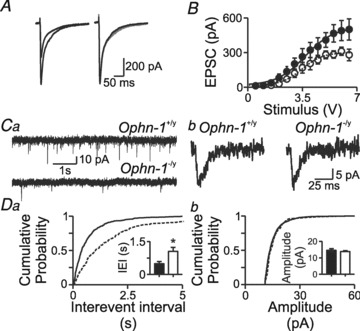
A, evoked EPSCs were smaller in Ophn-1-/y than Ophn-1+/y neurons. Normalisation (right panel) of the Ophn-1-/y EPSC (grey trace) revealed that the kinetics of the EPSCs were unaltered by genotype. B, input–output relationships of EPSCs were fitted by a Boltzmann function, which showed that the maximal amplitude was smaller in Ophn-1-/y neurons (open circles) than in Ophn-1+/y neurons (filled circles). Other fit parameters did not differ between genotypes. Ca, spontaneous EPSCs were less frequent in Ophn-1−/y (lower trace) than Ophn-1+/y (upper trace) neurons. The kinetics and amplitudes of spontaneous EPSCs did not differ between the genotypes (Cb). Da, cumulative probability plots showed that spontaneous events in Ophn-1-/y neurons shifted to longer interevent intervals (IEIs)/lower frequencies (IEI:Ophn-1-/y dotted line, Ophn-1+/y continuous line); mean IEI (inset) was longer in Ophn-1-/y neurons (*P < 0.05). Db, cumulative probability plot and mean amplitude (inset) of spontaneous EPSCs were unaltered.
Inhibitory synaptic transmission is reduced in Ophn-1-/y mice
Previous work reported that miniature IPSCs are unaffected by siRNA knockdown of oligophrenin-1 in organotypic hippocampal slices (Nadif Kasri et al. 2009). Nevertheless we measured IPSCs in acute hippocampal slices from Ophn-1-/y mice. Maximal evoked IPSCs were significantly smaller in Ophn-1-/y neurons than Ophn-1+/y neurons (381 ± 80 pA, 10 cells from 4 mice and 908 ± 117 pA, 20 cells from 9 mice, respectively; P = 0.02; Fig. 3A and B); neither the slope (Ophn-1-/y 3.5 ± 1.5 pA V−1, Ophn-1+/y 3.0 ± 0.6 pA V−1, P = 0.43), nor the half-maximal stimulus strength (Ophn-1-/y 15.6 ± 2.3 V, Ophn-1+/y 18.2 ± 1.6 V, P = 0.4) of the stimulus–response curve was altered in Ophn-1-/y neurons (Fig. 3B). The frequency of spontaneous IPSCs was lower in Ophn-1-/y neurons than Ophn-1+/y neurons (4.4 ± 0.5 Hz, 12 cells from 5 mice and 7.2 ± 0.8 Hz, 19 cells from 9 mice, respectively; P = 0.02; Fig. 3Ca and Da), consistent with the smaller evoked IPSCs. The amplitude of spontaneous IPSCs was unaffected in Ophn-1-/y neurons (Ophn-1-/y 42.8 ± 2.2 pA, 12 cells from 5 mice, Ophn-1+/y 41.8 ± 2.1 pA, 19 cells from 9 mice; P = 0.39; Fig. 3Cb and Db).
Figure 3. Inhibitory neurotransmission onto dentate gyrus granule cells is reduced in Ophn-1-/y neurons.
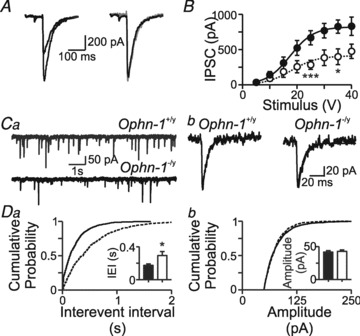
A, evoked IPSCs were smaller in Ophn-1-/y than Ophn-1+/y neurons. Normalisation (right panel) of the Ophn-1-/y IPSC (grey trace) revealed that the kinetics of the IPSCs were unaltered by genotype. B, input–output relationships of IPSCs were fitted by a Boltzmann function, which showed that the maximal amplitude was smaller in Ophn-1-/y neurons (open circles) than in Ophn-1+/y neurons (filled circles). Other fit parameters did not differ between genotypes. Ca, spontaneous IPSCs were less frequent in Ophn-1−/y (lower trace) than Ophn-1+/y (upper trace) neurons. The kinetics and amplitudes of spontaneous IPSCs did not differ between the genotypes (Cb). Da, cumulative probability plots showed that spontaneous events in Ophn-1-/y neurons shifted to longer interevent intervals (IEIs)/lower frequencies (IEI: Ophn-1-/y dotted line, Ophn-1+/y continuous line); mean IEI (inset) was longer in Ophn-1-/y neurons (*P < 0.05). Db, cumulative probability plot and mean amplitude (inset) of spontaneous IPSCs were unaltered.
The reduction of spontaneous IPSC frequency without alteration of amplitude suggested that the reduced inhibition is due to either a change in presynaptic function or loss of synapses. To test further whether or not postsynaptic abnormalities (in unitary conductance or receptor density) could account for the observed reductions, we performed peak-scaled variance analysis (PSVA) of miniature IPSCs, which allows an estimate of unitary current carried by postsynaptic channels (Traynelis et al. 1993). Superfusion of tetrodotoxin (TTX; 1 μm) blocked spontaneous action potential firing and revealed the miniature IPSCs (Fig. 4A). In contrast to spontaneous events, the frequency of miniature IPSCs was not significantly different between Ophn-1−/y and Ophn-1+/y neurons (3.2 ± 0.4 Hz, 9 cells from 5 mice, 4.0 ± 0.6 Hz, 14 cells from 9 mice, respectively; P = 0.28). The miniature amplitude was also unaffected (Ophn-1−/y 42.3 ± 2.7 pA, Ophn-1+/y 41.9 ± 2.1 pA; P = 0.92). The procedure for estimating unitary conductance is illustrated in Fig. 4B and C. The relationship between mean current and peak-scaled variance was best described by similar parabolic functions in Ophn-1+/y and Ophn-1−/y neurons. The weighted single channel current (obtained from the initial slope of the parabola) was not different between genotypes (Ophn-1+/y 2.0 ± 0.2 pA, 8 cells from 5 mice, Ophn-1−/y 1.8 ± 0.1 pA, 7 cells from 4 mice; P = 0.39), corresponding to a GABAA receptor conductance of 29.3 ± 2.8 pS and 25.8 ± 1.8 pS, respectively (Fig. 4Cb). The alteration in evoked IPSC amplitude cannot therefore be explained by alterations in GABAA receptor conductance. Furthermore it cannot be explained by alterations in receptor density or quantal content because the miniature IPSC amplitude was unaltered, confirming a presynaptic locus for the reduced inhibitory neurotransmission.
We tested the hypothesis that presynaptic alterations in Ca2+ sensitivity of release (Littleton et al. 1994) could explain the observed phenotype by correlating evoked IPSC amplitude with the external Ca2+ concentration ({Ca2+}o) (Fig. 5). Evoked IPSCs depend strongly on {Ca2+}o, an effect that saturated at ∼5 mm (Fig. 5A). The maximal amplitude was smaller in Ophn-1−/y than in Ophn-1+/y neurons (193 ± 69 pA, 4 cells from 2 mice, 483 ± 85, 6 cells from 3 mice), without altering the Hill coefficient (3.3 ± 0.7 and 3.7 ± 0.8, respectively) or Kd (1.6 ± 0.3 mm and 1.3 ± 0.2 mm, respectively). The ratio of IPSCs between Ophn-1−/y and Ophn-1+/y was independent of {Ca2+}o (Fig. 5B). We conclude that the observed reduction in neurotransmission in Ophn-1−/y neurons cannot be explained by an altered Ca2+ dependence of the release process.
Figure 5. Ca2+ dependence of GABAergic transmission is unaltered in Ophn-1-/y neurons.
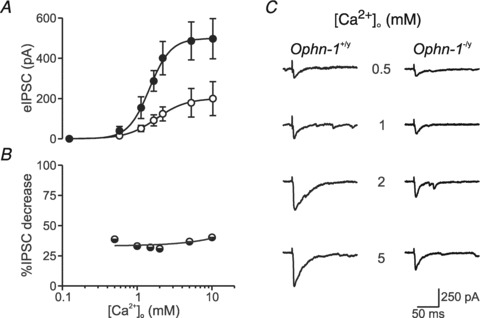
A, mean evoked IPSC vs.{Ca2+}o fitted with a Hill equation: I =Imax{Ca2+}n/({Ca2+}n+Kd). Evoked IPSCs were smaller in Ophn-1−/y neurons, without alteration in the Hill coefficient (n) or Kd. B, percentage decrease in evoked IPSCs in Ophn-1−/y neurons remained constant at different {Ca2+}o levels relative to evoked IPSCs recorded from Ophn-1+/y neurons. C, representative evoked IPSCs recorded in the presence of different {Ca2+}o.
Oligophrenin-1 has been implicated in the regulation of synaptic vesicle availability at excitatory synapses (Nakano-Kobayashi et al. 2009). We therefore tested whether alterations in the rapid dynamics of synaptic plasticity could explain the reduced inhibitory neurotransmission using paired stimuli and repetitive high frequency stimuli. In response to paired stimuli, IPSCs in Ophn-1−/y neurons were significantly more depressed than in Ophn-1+/y neurons (P < 0.001, ANOVA; Fig. 6A). In Ophn-1+/y neurons, repetitive high frequency stimuli (50 Hz) resulted in facilitation of the IPSCs, achieving a steady level within 10 stimuli (179 ± 5%, 11 cells from 7 mice; Fig. 6Ba and b). In contrast, IPSC facilitation was absent in Ophn-1-/y neurons (114 ± 18%, 9 cells from 5 mice; P = 0.002; Fig. 6Bb). Facilitation was also significantly weaker in Ophn-1−/y neurons at all frequencies tested (P < 0.005 GLM; Fig. 6Bc).
Altered vesicle dynamics in Ophn-1−/y neurons
Having demonstrated the synaptic deficit in Ophn-1−/y animals can be attributed to a presynaptic malfunction, we examined its origin in more detail. We tested the hypothesis that these synaptic deficits result from depletion of the readily releasable pool (RRP) of vesicles (Neher, 1998). We used two approaches to examine the functional state of the RRP in Ophn-1+/y and Ophn-1-/y synapses: hypertonic sucrose application (Mozhayeva et al. 2002; Ashton & Ushkaryov, 2005) and high-frequency minimal stimulation (Schneggenburger et al. 1999; Wesseling & Lo, 2002). Pressure ejection of hyperosmotic sucrose solution increased spontaneous IPSC frequency and shifted the holding current (Fig. 7A). The RRP was significantly smaller in Ophn-1−/y neurons than in Ophn-1+/y neurons (433 ± 135, 7 cells from 4 mice and 1091 ± 227 pC, 5 cells from 3 mice, respectively; P = 0.02; Fig. 7B). The high-frequency minimal stimulation protocol can be used to estimate the RRP for single axons/synapses (Kirmse & Kirischuk, 2006a; Wesseling & Lo, 2002). A minimal stimulus was defined as the smallest stimulus that would evoke an all or nothing IPSC. This approach uses the depression of averaged IPSC amplitude during high frequency stimulus trains (here 40 stimuli at 20 Hz, averages of 5 repeats; Fig. 8A) to estimate the number of readily releasable vesicles. Additionally, the recovery following depletion of the RRP gives an estimate of the rate of replenishment of vesicles from the reserve pool (Fig. 8C) (Kirischuk & Grantyn, 2000; Kirmse & Kirischuk, 2006a). These two phases were resolved by plotting cumulative IPSC amplitude: the initial rapid increase reflects release of vesicles from the RRP, and the second slow linear rise reflects a steady state release due to vesicle replenishment (Fig. 8Ab). The size of the RRP was obtained by extrapolating the linear component (between 1 and 2 s) back to time zero, designated RRPsyn (Schneggenburger et al. 1999). The estimate of RRP was unaffected by fitting shorter segments of data ending at 2 s, demonstrating that the period 1–2 s was steady state (data not shown). The RRPsyn was significantly smaller in Ophn-1-/y neurons than in Ophn-1+/y neurons (221 ± 35 pA and 354 ± 46, respectively, 9 cells from 7 mice for both genotypes; P = 0.04; Fig. 8Ab and Ba), corresponding to a smaller number of vesicles in the RRP (5 ± 1 and 8 ± 1, respectively; P = 0.04; Fig. 8Bc). The number of vesicles in the RRP at single synapses in Ophn-1+/y neurons agrees with previous estimates for central GABAergic synapses (Kirmse & Kirischuk, 2006b). The reduction in RRP did not alter the mean amplitude of the first IPSC (Ophn-1-/y 77.3 ± 7.6 pA and Ophn-1+/y 75.4 ± 16.3 pA, P = 0.86; Fig. 8Bi), which means that the probability of releasing single vesicles from the RRP (Pves, calculated as I1/RRPsyn) was significantly greater in Ophn-1-/y neurons (0.39 ± 0.04 vs. 0.20 ± 0.02, P < 0.001; Fig. 8Bb). The reduction in RRP size without change in the first IPSC amplitude shows that Ophn-1-/y synapses can function normally in response to minimal stimulation paradigms, but fail in response to higher stimulation frequencies/intensities. This inability of synapses to sustain inhibition during rhythmic activity may be one of the key mechanisms responsible for the learning disability in these mice (Khelfaoui et al. 2007).
Figure 7. Application of hypertonic sucrose reveals a smaller readily releasable pool in Ophn-1−/y neurons.
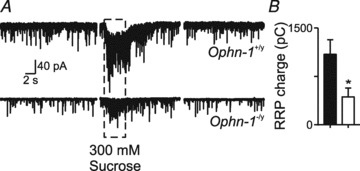
A, representative traces of responses to sucrose solution from Ophn-1+/y (upper panel) and Ophn-1-/y neurons (lower panel). Under normal conditions (left panel) spontaneous IPSCs were observed, but at a lower frequency in Ophn-1-/y neurons. Application of sucrose (5 s) to the dendrites of granule cells increased the frequency of spontaneous IPSCs and increased holding current (centre panel), which reversed on wash (right panel). B, RRP size was estimated from the charge transfer in response to sucrose divided by the mean charge of miniature IPSCs recorded in the presence of 1 μm TTX. RRP is smaller in Ophn-1-/y neurons (open bars). *P < 0.05.
As oligophrenin-1 has been implicated in the control of endocytosis (Khelfaoui et al. 2009; Nakano-Kobayashi et al. 2009), we examined whether changes in vesicle recycling dynamics could explain Ophn-1-/y neurons having fewer vesicles in their RRPs. This was tested in two ways. Firstly, the slope of the slow linear rise of the cumulative IPSC amplitude plot reflects vesicle replenishment after RRP depletion. Vesicle replenishment was slower in Ophn-1−/y synapses than Ophn-1+/y synapses (Ophn-1-/y, 7.4 ± 1.2 pA s−1, Ophn-1+/y 18.7 ± 4.6 pA s−1, P = 0.04; Fig. 8Ab). Secondly, after RRP depletion, a further stimulus tested RRP replenishment (Kirmse & Kirischuk, 2006b) (Fig. 8C). In Ophn-1+/y neurons, the RRP was completely restored within 5 s (RRPrefill, 0.96 ± 0.12), while in Ophn-1-/y neurons the RRP was not completely restored after 15 s (RRPrefill 0.84 ± 0.06; P = 0.03; Fig. 8Cb), showing that Ophn-1-/y synapses have impaired vesicle recycling dynamics.
Rescue of synaptic deficits in Ophn-1-/y
Oligophrenin-1 negatively modulates Rho-A signalling (Fauchereau et al. 2003): we examined the downstream effectors likely to be instrumental in the altered vesicle dynamics, in particular Rho-kinase (ROCK) (Newey et al. 2005). Prolonged inhibition of ROCK by Y-27632 (over 48 h) reversed dendritic abnormalities caused by Ophn-1 silencing (Govek et al. 2004). Here, 20 min of bath application of Y-27632 (10 μm) increased both the amplitude of evoked IPSCs (Ophn-1-/y, 161 ± 33 pA, 6 cells from 3 mice; Ophn-1-/y+ Y-27632, 475.4 ± 120.9 pA, 6 cells from 3 mice; P = 0.02; Fig. 9B) and the frequency of spontaneous IPSCs (Ophn-1-/y, 2.62 ± 0.48 Hz, 7 cells from 3 mice; Ophn-1−/y+ Y-27632, 5.75 ± 0.88 Hz, 6 cells from 3 mice; P = 0.008; Fig. 9A). Y-27632 also reversed the reduction in the RRP (Ophn-1-/y, 5 ± 1, 7 cells from 3 mice; Ophn-1-/y+ Y-27632, 10 ± 1, 6 cells from 3 mice; P = 0.005; Fig. 9C) and the impaired vesicle replenishment (Ophn-1-/y, 0.48 ± 0.06, 7 cells from 3 mice; Ophn-1-/y+ Y-27632, 0.91 ± 0.06, 6 cells from 3 mice; P = 0.0005; Fig. 9D). Ophn-1+/y synaptic responses were unaffected by Y-27632 (Fig. 9A–D).
Figure 9. ROCK inhibitor, Y-27632, reversed the synaptic deficits in Ophn-1-/y neurons.
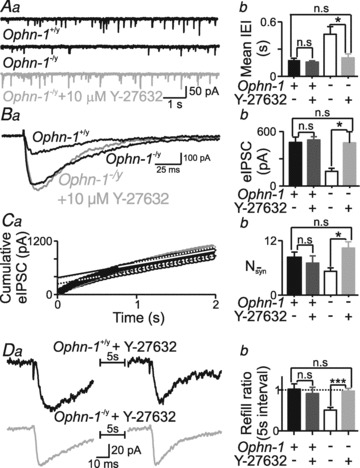
Y-27632 reversed: the reduced sIPSC frequency (A), eIPSC amplitude (B), RRP size (C) and vesicle availability (D), in Ophn-1-/y neurons (light grey traces and columns). Y-27632 did not affect Ophn-1+/y responses (dark grey columns). Y-27632 (10 μm) was applied 10–20 min before whole cell recording and applied continually throughout the recording. *P < 0.05, ***P < 0.001.
As the deficit in inhibitory transmission was acutely reversed by Y-27632, we hypothesised that the alteration in excitatory neurotransmission would be similarly rescued and this would be correlated with changes in spine density. Similar to GABAergic transmission, superfusion of Y-27632 (10 μm, 20 min) increased the frequency of spontaneous EPSCs in Ophn-1−/y neurons (Ophn-1-/y, 0.82 ± 0.14 Hz, 11 cells from 3 mice; Ophn-1−/y+ Y-27632, 1.83 ± 0.47 Hz, 6 cells from 3 mice; P = 0.02), but did not alter spontaneous EPSC frequency in Ophn-1+/y neurons (Ophn-1+/y, 1.53 ± 0.18 Hz, 11 cells from 5 mice; Ophn-1+/y+ Y-27632, 1.52 ± 0.44 Hz, 5 cells from 3 mice; P = 0.97; data not shown). The reversal of spontaneous EPSC frequency by ROCK inhibition was not associated with any change in dendritic spine density (Ophn-1+/y 0.66 ± 0.15 μm−1, 5 cells from 3 mice, Ophn-1+/y+Y-27632, 0.58 ± 0.06 μm−1, Ophn-1−/y 0.37 ± 0.04 μm−1, 7 cells from 4 mice, Ophn-1−/y+Y-27632, 0.31 ± 0.06 μm−1, 6 cells from 4 mice).
Discussion
The aetiology and pathophysiology of intellectual disability are poorly understood, but mutations in single genes that result in cognitive deficits provide an excellent opportunity to discover underlying causes. Mutation of the OPHN1 gene in humans produces a non-specific X-linked mental retardation (Billuart et al. 1998). Reduced expression of oligophrenin-1, the protein encoded by Ophn-1, results in altered dendritic spine morphology (Govek et al. 2004; Khelfaoui et al. 2007) and learning impairments in mice (Khelfaoui et al. 2007).
Alterations in oligophrenin-1 expression result in multiple deficits that depend on oligophrenin-1 being expressed in both the pre- and postsynaptic terminals. Here we found Ophn-1−/y mice had disrupted dendritic spines, attributable to the loss of postsynaptic Ophn-1, and consistent with previous reports on spine morphology in Ophn-1−/y mice (Khelfaoui et al. 2007) and Ophn-1 knockdown by siRNA (Govek et al. 2004). Other postsynaptic actions include stabilisation of AMPA receptors (Nadif Kasri et al. 2009) and our previous report of the maintenance of LTD (Khelfaoui et al. 2009). Our main focus here was on the presynaptic consequences of Ophn-1 loss. We found impairments of evoked and spontaneous EPSCs (consistent with previous work on knockdown in slice culture –Nakano-Koboyashi et al. 2009). The crucial finding is that IPSCs are also impaired, with a reduced RRP preventing repetitive release, which is important because of the role of repetitive firing of interneurons during physiological oscillations (Bartos et al. 2007).
Presynaptic mechanism of oligophrenin-1
The presynaptic function of oligophrenin-1 was as a modulator of synaptic vesicle availability and regulator of vesicle pool dynamics. Synaptic vesicles within the presynaptic terminal are organized in tightly regulated pools, from slowly accessible reserve pools to the RRP from which vesicle fusion occurs (Schweizer & Ryan, 2006). As the functional state of the RRP is a critical regulator of release probability and synaptic depression (Srinivasan et al. 2008; von Gersdorff et al. 1997; Wu & Betz, 1998), alterations in RRP dynamics may provide a mechanism for the behavioural phenotypes observed in Ophn-1 mice.
The present study cannot distinguish whether the changes in RRP and vesicle availability are due to reduced endocytosis or vesicle recycling, but the most likely explanation is that oligophrenin-1 alters clathrin-mediated endocytosis (Granseth et al. 2007), which is impaired in Ophn-1-/y mice (Khelfaoui et al. 2009; Nakano-Kobayashi et al. 2009). Two possible mechanisms exist for modulation of endocytosis by oligophrenin-1; either through a direct interaction with endocytic proteins such as endophilin 1 and amphiphysin II (Khelfaoui et al. 2009; Nakano-Kobayashi et al. 2009), or by a ROCK-dependent signalling cascade. Here, we show that all of the effects of Ophn-1 deletion on synaptic function can be rapidly reversed by inhibition of ROCK-dependent signalling (Fig. 9). Therefore, although previously reports have demonstrated that oligophrenin-1 directly interacts with endophilin-1 via its third proline rich domain (Khelfaoui et al. 2009; Nakano-Kobayashi et al. 2009), it is unlikely that this interaction alone is sufficient to mediate the effect on synaptic vesicle availability. The complete reversibility of the presynaptic dysfunction is in agreement with postsynaptic phenomena in the study of Khelfaoui et al. (2009), who showed that in Ophn-1 knockout cells overactivation of the RhoA/ROCK signalling pathway resulted in reduced receptor endocytosis and altered expression of LTD.
The change in synaptic vesicle availability predicts impairment of processes dependent on prolonged synaptic transmission, such as long term potentiation (LTP). Evidence on the role of Ophn-1 in LTP appears inconsistent; Khelfaoui et al. (2007) reported that LTP induced by tetanic stimulation was unaffected in Ophn-1−/y neurons. In contrast, Nadif Kasri et al. (2009) demonstrate that LTP induced by 3 Hz stimulation and postsynaptic depolarisation is weakened in CA1 neurons where Ophn-1 expression was reduced by RNAi. This discrepancy may result from the method of LTP induction, as has been demonstrated for induction of LTD in Ophn-1−/y mice (Khelfaoui et al. 2007, 2009), but may also be complicated by changes in RRP size that can be caused by LTP protocols (Stanton et al. 2005).
Changes in cell morphology
In addition to changes in presynaptic function, we report that Ophn-1−/y mice also change in dendritic morphology and spine density, presumably as a result of the postsynaptic role of oligophrenin-1 in the modulation of actin dynamics (Govek et al. 2004). What effect does the reduced arborisation have on granule cell function? Targeted acute dendrotomy of cortical neurons has demonstrated that reduced dendritic arborisation increases neuronal firing rates (Bekkers & Hausser, 2007). We found that the intrinsic properties were unchanged in Ophn-1−/y neurons, which may be explained by the lack of change in the overall dendritic length and the minor changes in branching patterns in the same neurons.
The difference in branching may be expected to have some impact on the attenuation of synaptic currents, but no such changes were found in Ophn-1−/y neurons (Figs 2A and 3A): either any effect was below statistical noise, or the rather strong attenuation of distal excitatory inputs recently reported for granule cells (Krueppel et al., 2011) may mean our results are dominated by proximal synapses. Similar to previous reports (Govek et al. 2004; Khelfaoui et al. 2007), dendritic spine morphology was altered in Ophn-1−/y neurons, with the major abnormality being a reduced density of mature mushroom spines, whilst the density of the more immature stubby spines and filopodia were unaffected. The observation that the excitatory synaptic phenotype was reversed independently of the altered spine morphology was unexpected as dendritic spines are the major site of excitatory transmission. This discrepancy may be explained by the hypothesis that in Ophn-1−/y neurons, a large proportion of synapses are directly onto the dendritic shaft (Khelfaoui et al. 2007). The erosion of cortical structures that is observed in older mice (Khelfaoui et al. 2007) suggest that morphological changes will become more important in later stages of the condition, but are modest or non-existent in the initial stages, which are the subject of this study. A detailed developmental study will be required to fully understand the relative contributions of the changes in synaptic transmission and altered dendritic morphology to the aetiology of the disease.
The role of synaptic activity in the regulation and stabilisation of dendritic spines is becoming clearer (Mantyh et al. 1995; Okamoto et al. 2004). Interestingly, spontaneous synaptic activity has been demonstrated to maintain spine stability (McKinney et al. 1999), which is thought to contribute to learning and memory (Yuste & Bonhoeffer, 2001). Therefore, presynaptic deficit and associated reduced synaptic activity in Ophn-1−/y mice may result in decreased spine density. It has been shown previously that dendritic spine abnormalities associated with reduced oligophrenin-1 expression in neuronal cultures can be reversed by Y-27632 inhibition of the Rho signalling cascade (Govek et al. 2004). In contrast to the rapid reversibility of the physiological synaptic phenotype in this study, Govek et al. used prolonged inhibition of Y-27632 (>48 h) to reverse changes in the dendritic phenotype. In contrast, our study showed rapid reversibility of the synaptic phenotype without requiring reversal of dendritic spine density and dendritic tree abnormalities. This strongly suggests that the presynaptic phenotype cannot be explained by changes in synapse number.
Treatment implications
The treatment of intellectual disability is largely based on special education, because pharmacotherapy is lacking. Recent evidence suggests that some phenotypes associated with learning disabilities can be reversed, through both genetic mechanisms (Guy et al. 2007) and pharmacotherapy (Dolen et al. 2007). At present, whether these provide a realistic opportunity for treatment remains unclear. Y-27632 reversed the synaptic deficits observed in Ophn-1-/y neurons and, on a slower time scale, also changes in dendritic structure (Govek et al. 2004), suggesting that interference with the downstream signalling pathways may provide a potential therapeutic intervention for intellectual disability. Early treatment would be beneficial to avoid the development of structural changes. Another positive feature of this treatment is that it had no effect on wild-type neurons in this study, and similar Rho-kinase inhibitors have proved well tolerated in clinical trials for vascular disorders (Shimokawa & Takeshita, 2005) and subarachnoid haemorrhage (Zhao et al. 2011).
Here we demonstrate that in the hippocampus, oligophrenin-1 null mice show a multifaceted deficit attributed to changes in both the pre- and postsynaptic terminals. The postsynaptic effect was manifested as a change in dendritic spine density and dendritic morphology. The presynaptic deficit could be explained by changes in the number of vesicles in the readily releasable pool and secretory vesicle availability. The impaired RRP dynamics in inhibitory synapses which prevents repetitive release is important because of the role of repetitive firing of interneurons during physiological oscillations.
Acknowledgments
This work was supported by a Wellcome Trust grant to J.G.R.J. (074771/Z/04/Z) and an Epilepsy Research UK fellowship to P.J. The Olympus Fluoview FV1000 confocal microscope used in this research was obtained through the Birmingham Science City Translational Medicine Clinical Research Infrastructure and Trials Platform, with support from Advantage West Midlands (AWM).
Glossary
Abbreviations
- IEI
interevent interval
- RRP
readily releasable pool
- XLMR
X-linked mental retardation
Author contributions
A.D.P. designed, performed and analyzed the experiments; K.K.G. co-performed and co-analysed the morphology experiments, P.P.S. co-designed and co-analyzed the reversal experiments; P.J. analyzed physiological data, J.G.R.J. conceived the study, provided leadership, experimental design and project management. P.B. and J.C. provided the mouse model and helped conceive the study and review progress. A.D.P. and J.G.R.J. wrote the manuscript. All authors discussed the results and approved the manuscript. All experiments were carried out at the University of Birmingham.
References
- Ashton AC, Ushkaryov YA. Properties of synaptic vesicle pools in mature central nerve terminals. J Biol Chem. 2005;280:37278–37288. doi: 10.1074/jbc.M504137200. [DOI] [PubMed] [Google Scholar]
- Bartos M, Vida I, Jonas P. Synaptic mechanisms of synchronized gamma oscillations in inhibitory interneuron networks. Nat Rev Neurosci. 2007;8:45–56. doi: 10.1038/nrn2044. [DOI] [PubMed] [Google Scholar]
- Bekkers JM, Hausser M. Targeted dendrotomy reveals active and passive contributions of the dendritic tree to synaptic integration and neuronal output. Proc Natl Acad Sci U S A. 2007;104:11447–11452. doi: 10.1073/pnas.0701586104. [DOI] [PMC free article] [PubMed] [Google Scholar]
- Billuart P, Bienvenu T, Ronce N, des Portes V, Vinet MC, Zemni R, Roest CH, Carrie A, Fauchereau F, Cherry M, Briault S, Hamel B, Fryns JP, Beldjord C, Kahn A, Moraine C, Chelly J. Oligophrenin-1 encodes a RhoGAP protein involved in X-linked mental retardation. Nature. 1998;392:923–926. doi: 10.1038/31940. [DOI] [PubMed] [Google Scholar]
- Chelly J, Khelfaoui M, Francis F, Cherif B, Bienvenu T. Genetics and pathophysiology of mental retardation. Eur J Hum Genet. 2006;14:701–713. doi: 10.1038/sj.ejhg.5201595. [DOI] [PubMed] [Google Scholar]
- Chiurazzi P, Schwartz CE, Gecz J, Neri G. XLMR genes: update 2007. Eur J Hum Genet. 2008;16:422–434. doi: 10.1038/sj.ejhg.5201994. [DOI] [PubMed] [Google Scholar]
- Dolen G, Osterweil E, Rao BSS, Smith GB, Auerbach BD, Chattarji S, Bear MF. Correction of fragile X syndrome in mice. Neuron. 2007;56:955–962. doi: 10.1016/j.neuron.2007.12.001. [DOI] [PMC free article] [PubMed] [Google Scholar]
- Fauchereau F, Herbrand U, Chafey P, Eberth A, Koulakoff A, Vinet MC, Ahmadian MR, Chelly J, Billuart P. The RhoGAP activity of OPHN1, a new F-actin-binding protein, is negatively controlled by its amino-terminal domain. Mol Cell Neurosci. 2003;23:574–586. doi: 10.1016/s1044-7431(03)00078-2. [DOI] [PubMed] [Google Scholar]
- Govek EE, Newey SE, Akerman CJ, Cross JR, Van der Veken L, Van Aelst L. The X-linked mental retardation protein oligophrenin-1 is required for dendritic spine morphogenesis. Nat Neurosci. 2004;7:364–372. doi: 10.1038/nn1210. [DOI] [PubMed] [Google Scholar]
- Granseth B, Odermatt B, Royle SJ, Lagnado L. Clathrin-mediated endocytosis: the physiological mechanism of vesicle retrieval at hippocampal synapses. J Physiol. 2007;585:681–686. doi: 10.1113/jphysiol.2007.139022. [DOI] [PMC free article] [PubMed] [Google Scholar]
- Guy J, Gan J, Selfridge J, Cobb S, Bird A. Reversal of neurological defects in a mouse model of rett syndrome. Science. 2007;315:1143–1147. doi: 10.1126/science.1138389. [DOI] [PMC free article] [PubMed] [Google Scholar]
- Harris KM, Kater SB. Dendritic spines: cellular specializations imparting both stability and flexibility to synaptic function. Annu Rev Neurosci. 1994;17:341–371. doi: 10.1146/annurev.ne.17.030194.002013. [DOI] [PubMed] [Google Scholar]
- Huttenlocher PR. Dendritic development and mental defect. Neurology. 1970;20:381. [PubMed] [Google Scholar]
- Khelfaoui M, Alice P, Powell AD, Valnegri P, Cheong KW, Blandin Y, Passafaro M, Jefferys JGR, Chelly J, Billuart P. Inhibition of RhoA pathway rescues the endocytosis defects in oligophrenin1 mouse model of mental retardation. Hum Mol Genet. 2009;18:2575–2583. doi: 10.1093/hmg/ddp189. [DOI] [PMC free article] [PubMed] [Google Scholar]
- Khelfaoui M, Denis C, van Galen E, de Bock F, Schmitt A, Houbron C, Morice E, Giros B, Ramakers G, Fagni L, Chelly J, Nosten-Bertrand M, Billuart P. Loss of X-linked mental retardation gene oligophrenin1 in mice impairs spatial memory and leads to ventricular enlargement and dendritic spine immaturity. J Neurosci. 2007;27:9439–9450. doi: 10.1523/JNEUROSCI.2029-07.2007. [DOI] [PMC free article] [PubMed] [Google Scholar]
- Kirischuk S, Grantyn R. A readily releasable pool of single inhibitory boutons in culture. NeuroReport. 2000;11:3709–3713. doi: 10.1097/00001756-200011270-00024. [DOI] [PubMed] [Google Scholar]
- Kirmse K, Kirischuk S. Ambient GABA constrains the strength of GABAergic synapses at Cajal-Retzius cells in the developing visual cortex. J Neurosci. 2006a;26:4216–4227. doi: 10.1523/JNEUROSCI.0589-06.2006. [DOI] [PMC free article] [PubMed] [Google Scholar]
- Kirmse K, Kirischuk S. N-Ethylmaleimide increases release probability at GABAergic synapses in layer I of the mouse visual cortex. Eur J Neurosci. 2006b;24:2741–2748. doi: 10.1111/j.1460-9568.2006.05179.x. [DOI] [PubMed] [Google Scholar]
- Krueppel R, Remy S, Beck H. Dendritic integration in hippocampal dentate granule cells. Neuron. 2011;71:512–528. doi: 10.1016/j.neuron.2011.05.043. [DOI] [PubMed] [Google Scholar]
- Linseman DA, Loucks FA. Diverse roles of Rho family GTPases in neuronal development, survival, and death. Front Biosci. 2008;13:657–676. doi: 10.2741/2710. [DOI] [PubMed] [Google Scholar]
- Littleton JT, Stern M, Perin M, Bellen HJ. Calcium dependence of neurotransmitter release and rate of spontaneous vesicle fusions are altered in Drosophila synaptotagmin mutants. Proc Natl Acad Sci U S A. 1994;91:10888–10892. doi: 10.1073/pnas.91.23.10888. [DOI] [PMC free article] [PubMed] [Google Scholar]
- Mantyh PW, Demaster E, Malhotra A, Ghilardi JR, Rogers SD, Mantyh CR, Liu H, Basbaum AI, Vigna SR, Maggio JE, et al. Receptor endocytosis and dendrite reshaping in spinal neurons after somatosensory stimulation. Science. 1995;268:1629–1632. doi: 10.1126/science.7539937. [DOI] [PubMed] [Google Scholar]
- McKinney RA, Capogna M, Durr R, Gahwiler BH, Thompson SM. Miniature synaptic events maintain dendritic spines via AMPA receptor activation. Nat Neurosci. 1999;2:44–49. doi: 10.1038/4548. [DOI] [PubMed] [Google Scholar]
- Mozhayeva MG, Sara Y, Liu X, Kavalali ET. Development of vesicle pools during maturation of hippocampal synapses. J Neurosci. 2002;22:654–665. doi: 10.1523/JNEUROSCI.22-03-00654.2002. [DOI] [PMC free article] [PubMed] [Google Scholar]
- Nadif Kasri N, Nakano-Kobayashi A, Malinow R, Li B, Van Aelst L. The Rho-linked mental retardation protein oligophrenin-1 controls synapse maturation and plasticity by stabilizing AMPA receptors. Genes Dev. 2009;23:1289–1302. doi: 10.1101/gad.1783809. [DOI] [PMC free article] [PubMed] [Google Scholar]
- Nakano-Kobayashi A, Kasri NN, Newey SE, Van Aelst L. The Rho-linked mental retardation protein OPHN1 controls synaptic vesicle endocytosis via endophilin A1. Curr Biol. 2009;19:1133–1139. doi: 10.1016/j.cub.2009.05.022. [DOI] [PMC free article] [PubMed] [Google Scholar]
- Neher E. Vesicle pools and Ca2+ microdomains: new tools for understanding their roles in neurotransmitter release. Neuron. 1998;20:389–399. doi: 10.1016/s0896-6273(00)80983-6. [DOI] [PubMed] [Google Scholar]
- Newey SE, Velamoor V, Govek EE, Van Aelst L. Rho GTPases, dendritic structure, and mental retardation. J Neurobiol. 2005;64:58–74. doi: 10.1002/neu.20153. [DOI] [PubMed] [Google Scholar]
- Okamoto K, Nagai T, Miyawaki A, Hayashi Y. Rapid and persistent modulation of actin dynamics regulates postsynaptic reorganization underlying bidirectional plasticity. Nat Neurosci. 2004;7:1104–1112. doi: 10.1038/nn1311. [DOI] [PubMed] [Google Scholar]
- Purpura DP. Dendritic spine “dysgenesis” and mental retardation. Science. 1974;186:1126–1128. doi: 10.1126/science.186.4169.1126. [DOI] [PubMed] [Google Scholar]
- Schneggenburger R, Meyer AC, Neher E. Released fraction and total size of a pool of immediately available transmitter quanta at a calyx synapse. Neuron. 1999;23:399–409. doi: 10.1016/s0896-6273(00)80789-8. [DOI] [PubMed] [Google Scholar]
- Schweizer FE, Ryan TA. The synaptic vesicle: cycle of exocytosis and endocytosis. Curr Opin Neurobiol. 2006;16:298–304. doi: 10.1016/j.conb.2006.05.006. [DOI] [PubMed] [Google Scholar]
- Shimokawa H, Takeshita A. Rho-kinase is an important therapeutic target in cardiovascular medicine. Arterioscler Thromb Vasc Biol. 2005;25:1767–1775. doi: 10.1161/01.ATV.0000176193.83629.c8. [DOI] [PubMed] [Google Scholar]
- Sholl DA. Dendritic organization in the neurons of the visual and motor cortices of the cat. J Anat. 1953;87:387–406. [PMC free article] [PubMed] [Google Scholar]
- Sholl DA. The measurable parameters of the cerebral cortex and their significance in its organization. Prog Neurobiol. 1956:324–333. [PubMed] [Google Scholar]
- Srinivasan G, Kim JH, von Gersdorff H. The pool of fast releasing vesicles is augmented by myosin light chain kinase inhibition at the calyx of Held synapse. J Neurophysiol. 2008;94:1810–1824. doi: 10.1152/jn.00949.2007. [DOI] [PubMed] [Google Scholar]
- Stanton PK, Winterer J, Zhang XL, Muller W. Imaging LTP of presynaptic release of FM1–43 from the rapidly recycling vesicle pool of Schaffer collateral-CA1 synapses in rat hippocampal slices. Eur J Neurosci. 2005;22:2451–2461. doi: 10.1111/j.1460-9568.2005.04437.x. [DOI] [PubMed] [Google Scholar]
- Traynelis SF, Silver RA, Cull-Candy SG. Estimated conductance of glutamate receptor channels activated during EPSCs at the cerebellar mossy fiber-granule cell synapse. Neuron. 1993;11:279–289. doi: 10.1016/0896-6273(93)90184-s. [DOI] [PubMed] [Google Scholar]
- von Gersdorff H, Schneggenburger R, Weis S, Neher E. Presynaptic depression at a calyx synapse: the small contribution of metabotropic glutamate receptors. J Neurosci. 1997;17:8137–8146. doi: 10.1523/JNEUROSCI.17-21-08137.1997. [DOI] [PMC free article] [PubMed] [Google Scholar]
- Wesseling JF, Lo DC. Limit on the role of activity in controlling the release-ready supply of synaptic vesicles. J Neurosci. 2002;22:9708–9720. doi: 10.1523/JNEUROSCI.22-22-09708.2002. [DOI] [PMC free article] [PubMed] [Google Scholar]
- Wierenga CJ, Becker N, Bonhoeffer T. GABAergic synapses are formed without the involvement of dendritic protrusions. Nat Neurosci. 2008;11:1044–1052. doi: 10.1038/nn.2180. [DOI] [PubMed] [Google Scholar]
- Wu LG, Betz WJ. Kinetics of synaptic depression and vesicle recycling after tetanic stimulation of frog motor nerve terminals. Biophys J. 1998;74:3003–3009. doi: 10.1016/S0006-3495(98)78007-5. [DOI] [PMC free article] [PubMed] [Google Scholar]
- Yuste R, Bonhoeffer T. Morphological changes in dendritic spines associated with long-term synaptic plasticity. Annu Rev Neurosci. 2001;24:1071–1089. doi: 10.1146/annurev.neuro.24.1.1071. [DOI] [PubMed] [Google Scholar]
- Zhao J, Zhou D, Guo J, Ren J, Zhou L, Wang S, Zhang Y, Xu B, Zhao K, Wand R, Mao Y, Xu B, Zhang X the Fasudil Aneurysmal Subarachnoid Hemorrhage Study Group. Efficacy and safety of fasudil in patients with subarachnoid hemorrhage: final results of a randomized trial of fasudil versus nimodipine. Neurol Med Chir (Tokyo) 2011;51:679–683. doi: 10.2176/nmc.51.679. [DOI] [PubMed] [Google Scholar]


