

Abstract
Non-technical summary
Specific membrane proteins called ‘M channels’ control the excitability of peripheral pain-sensing nerves. In certain disease conditions (e.g. inflammation), M channels become inhibited, and this contributes to the increased excitability of these nerves and, ultimately, to pain sensation. Recently, chemical compounds that enhance M channel activity have been discovered and were suggested as prospective analgesics. However, it was previously unknown whether these M channel enhancers could augment the activity of M channels that are inhibited in inflammatory conditions. We tested four compounds that possess M channel enhancer activity in various conditions mimicking inflammation. Our conclusions suggest that while the overall effect of the enhancers is reduced when M channels are inhibited, the remaining enhancement is sufficient to ‘recover’ M channel activity from inflammation-induced inhibition. Our results support pharmacological targeting of M channels in peripheral nerves as a strategy against inflammatory pain.
Abstract
M-type (Kv7, KCNQ) K+ channels control the resting membrane potential of many neurons, including peripheral nociceptive sensory neurons. Several M channel enhancers were suggested as prospective analgesics, and targeting M channels specifically in peripheral nociceptors is a plausible strategy for peripheral analgesia. However, receptor-induced inhibition of M channels in nociceptors is often observed in inflammation and may contribute to inflammatory pain. Such inhibition is predominantly mediated by phospholipase C. We investigated four M channel enhancers (retigabine, flupirtine, zinc pyrithione and H2O2) for their ability to overcome M channel inhibition via two phospholipase C-mediated mechanisms, namely depletion of membrane phosphatidylinositol 4,5-bisphosphate (PIP2) and a rise in intracellular Ca2+ (an action mediated by calmodulin). Data from overexpressed Kv7.2/Kv7.3 heteromers and native M currents in dorsal root ganglion neurons suggest the following conclusions. (i) All enhancers had a dual effect on M channel activity, a negative shift in voltage dependence and an increase of the maximal current at saturating voltages. The enhancers differed in their efficacy to produce these effects. (ii) Both PIP2 depletion and Ca2+/calmodulin strongly reduced the M current amplitude; however, at voltages near the threshold for M channel activation (−60 mV) all enhancers were able to restore M channel activity to a control level or above, while at saturating voltages the effects were more variable. (iii) Receptor-mediated inhibition of M current in nociceptive dorsal root ganglion neurons did not reduce the efficacy of retigabine or flupirtine to hyperpolarize the resting membrane potential. In conclusion, we show that all four M channel enhancers tested could overcome both PIP2 and Ca2+–calmodulin-induced inhibition of Kv7.2/7.3 at voltages close to the threshold for action potential firing (−60 mV) but generally had reduced efficacy at a saturating voltage (0 mV). We suggest that the efficacy of an M channel enhancer to shift the voltage dependence of activation may be most important for rescuing M channel function in sensory neurons innervating inflamed tissue.
Introduction
M-type K+ channels (KCNQ, Kv7) are important regulators of neuronal excitability because they control resting membrane potential and promote accommodation within bursts of action potentials in neurons that express them (reviewed by Delmas & Brown, 2005; Shapiro & Gamper, 2009). A general rule of thumb is that the inhibition of M channels in neurons is excitatory, while their activation has an anti-excitatory, silencing effect. Loss-of-function mutations within M channel genes (KCNQ1–5) are often associated with excitability disorders, such as epilepsy (Biervert et al. 1998; Charlier et al. 1998; Singh et al. 1998), cardiac arrhythmias (Splawski et al. 1997; Yang et al. 1997) and deafness (Neyroud et al. 1997; Kubisch et al. 1999). Accordingly, several pharmacological M channel enhancers (or ‘openers’) are undergoing clinical trials as prospective anti-excitatory (e.g. anti-epileptic) drugs (Main et al. 2000; Tatulian et al. 2001; Blackburn-Munro & Jensen, 2003).
Recently, functional M channels have been identified in peripheral damage-sensing (nociceptive) sensory neurons (Passmore et al. 2003; Crozier et al. 2007; Linley et al. 2008; Liu et al. 2010; Mucha et al. 2010; Rose et al. 2011), where these channels control excitability by ‘clamping’ the resting membrane potential and setting the threshold for action potential firing (Passmore et al. 2003; Linley et al. 2008; Liu et al. 2010). Nociceptive neurons are normally silent and fire action potentials only in response to strong (potentially damaging) mechanical, thermal or chemical stimuli. It is therefore thought that the membrane potential of these neurons is very tightly controlled at subthreshold voltages, and M current may play a crucial role in such control. In accordance with this new role in controlling excitability of neurons in nociceptive pathways, M channel enhancers were put forward as candidate analgesics. However, M channels are expressed throughout the CNS; thus, systemically applied M channel enhancers are potentially prone to CNS side-effects. Therefore, it has been suggested that targeting M channels in the peripheral nerves with locally active M channel enhancers that cannot cross the blood–brain barrier would be a plausible strategy to tackle some types of pain (Brown & Passmore, 2010). Yet, the expression of M channels in the peripheral nerves has its flip-side; inhibition of M channels may itself result in sensory neuron overexcitability and pain. Thus, pharmacological inhibition of M channels at the peripheral nociceptive terminals produced by plantar injections of the specific M channel blocker, XE991, produced moderate pain in rats (Linley et al. 2008; Liu et al. 2010). Furthermore, recent reports suggest that M channels in sensory neurons are inhibited by inflammatory mediators coupled to phospholipase C (PLC), such as bradykinin (BK; Liu et al. 2010) and proteases (Linley et al. 2008), and that this inhibition contributes to the development of inflammatory pain (Linley et al. 2008; Liu et al. 2010). But can M channel enhancers overcome the inflammatory mediator-induced M channel inhibition? In this study, we addressed this question by studying the effects of the following four enhancers (Fig. 1): retigabine (Rtg; Wickenden et al. 2000; Tatulian et al. 2001; Tatulian & Brown, 2003), flupirtine (Flu; Gribkoff, 2003), zinc pyrithione (ZnPth; Xiong et al. 2007) and hydrogen peroxide (H2O2; Gamper et al. 2006) on native and heterologously expressed M channels, inhibited by second messengers of PLC signalling, namely depletion of membrane phosphatidylinositol 4,5-bisphosphate (PIP2) and cytosolic Ca2+ elevation.
Figure 1.

Chemical structure of M channel enhancers used
Methods
All experiments were performed in accord with the regulations of the Research Ethics Committee of the Faculty of Biological Sciences at the University of Leeds and under the provisions of the UK Animals (Scientific Procedures) Act 1986.
Cell culture, cDNA constructs and transfections
Chinese hamster ovary (CHO) cells were handled as described previously (Gamper et al. 2005b). For dorsal root ganglion (DRG) neuron dissociation, 7-day-old Wistar rats were humanely killed by an overdose of isoflurane in accordance with the Schedule 1 protocol. Dorsal root ganglia were extracted from all spinal levels, and ganglia were enzymatically dissociated in Hanks’ balanced salt solution supplemented with collagenase type 1A (1 mg ml−1) and dispase (10 mg ml−1; Gibco, Paisley, UK) at 37°C for 15–20 min. Cells were then mechanically triturated, washed twice by centrifugation, resuspended in 800 μl of growth medium and plated onto glass coverslips coated with poly-d-lysine and laminin. Neurons were cultured for 2–5 days in a humidified incubator (37°C, air supplemented with 5% CO2) in Dulbecco's modified Eagle's medium supplemented with GlutaMAX I (Gibco), 10% fetal bovine serum, penicillin (50 U ml−1) and streptomycin (50 μg ml−1); no nerve growth factor was added to the culture media.
Plasmids encoding human Kv7.2 and human Kv7.3 (GenBank accession numbers AF110020 and AAC96101, respectively) were given to us by David McKinnon (State University of New York at Stony Brook, NY, USA) and Thomas Jentsch (Zentrum fur Molekulare Neurobiologie, Hamburg, Germany) and subcloned into pcDNA3.1 (Invitrogen, Grand Island, NY, USA). Plasmid containing wild-type vertebrate calmodulin (CaM; given to us by Trisha Davis, University of Washington, Seattle, WA, USA) was subcloned into the pEYFP-C1 vector (Clonetech Mountain View, CA, USA) using XmalI/SalI sites. Human B2 receptor (accession number AY275465) in pcDNA3.1 was purchased from the Missouri S&T cDNA Resource Centre (Rolla, MO, USA). Chemically induced dimerization (CID) system containing truncated human type IV 5-phosphatase fused with FK506 binding protein 12 (FKBP12) and mRFP and CFP-fused FKBP12-Rapamycin Binding domain of mammalian target of rapamycin (FRB) was given to us by Tamas Balla (Section on Molecular Signal Transduction, NICHD, National Institutes of Health, Bethesda, MD, USA).
Chinese hamster ovary cells were transfected using FuGENE®HD transfection reagent (Roche, Welwyn Garden City, UK) according to the instructions of the manufacturer. Dorsal root ganglion neurons were transfected using a nucleofector device (Amaxa, Lonza UK Ltd, Slough, UK) in combination with a rat DRG transfection kit and O-03 voltage protocol according to the instructions of the manufacturer.
Electrophysiology
In patch-clamp experiments, the standard bath solution contained (mm): NaCl, 160; KCl, 2.5; CaCl2, 2; MgCl2, 1; and Hepes, 10; with pH adjusted to 7.4 using NaOH. In perforated-patch experiments on CHO cells, the patch pipette contained (mm): KCl, 160; MgCl2, 5; Hepes, 5; and amphotericin B, 400 μg ml−1; with pH adjusted to 7.4 using KOH. For perforated-patch experiments on DRG neurons, the patch pipette contained (mm): potassium acetate, 90; KCl, 10; NaCl, 10; CaCl2, 1; MgCl2, 3; EGTA, 3; Hepes, 40; and amphotericin B, 400 μg ml−1; with pH adjusted to 7.4 using KOH. In conventional whole-cell experiments the pipette solution contained (mm): KCl, 130; MgCl2, 5; CaCl2, 1.94 or 4.63, giving 50 nm or 1 μm free Ca2+; EGTA, 5; potassium-ATP, 3; and HEPES, 5; with pH adjusted to 7.4 using KOH. Currents were amplified using an EPC-10 patch-clamp amplifier (HEKA Elektronik, Lambrecht/Pfalz, Germany) and recorded using Patchmaster software (v2.2; HEKA). The current signal was sampled at 1 kHz and filtered online at 500 Hz using a software-based Bessel filter. Patch pipettes were fabricated from borosilicate glass (Harvard Apparatus, Edenbridge, UK) using a horizontal puller (DMZ-universal puller; Zeitz-Instruments GmbH, Martinsried, Germany) and heat polished to a resistance of 3–4 MΩ. Cells were mounted on an inverted microscope (TE-2000; Nikon Instruments UK, Kingston, UK) in a low-profile perfusion chamber fed by a gravity-driven perfusion system flowing at ∼2 ml min−1, resulting in a bath exchange time of ∼0.5 s. Series resistance was corrected online by up to 70% using the Patchmaster software, and liquid junction potentials were corrected. Steady-state currents at 0 and –60 mV were analysed. Specific M channel blocker, XE991 (3–10 μm), was used at the end of the recording to verify the current identity. The G–V relationships were determined using the peak amplitudes of the slow-activating outward currents induced by stepping from the prepulse voltage (−100 or −120 mV) to +40 mV for 800 ms; the voltage was held at –60 mV between the pulses. The M channel activation kinetics were measured by a 600 ms depolarizing voltage pulses from a holding potential of –100 mV and fitted with a single-exponential function. Deactivation kinetics were measured upon stepping from 0 to –60 mV for 800 ms and fitted with a single-exponential function. The M current in DRG neurons was measured by square 800 ms voltage pulses from −30 to –60 mV, and the steady-state current at –60 mV was analysed. All patch-clamp data analysis was conducted using Fitmaster (v2.11; HEKA) and Origin software (OriginLab Corp., Northampton, MA, USA).
Reagents
Retigabine was a kind gift from Professor Hailin Zhang (Hebei Medical University, Shijiazhuang, China); XE991 was from Tocris; and all other chemicals were from Sigma-Aldrich or Calbiochem.
Statistics
Data are presented as means ± SEM and were statistically compared using Student's paired or unpaired t test or one-way ANOVA with Tukey's or Bonferroni's post hoc tests as appropriate.
Results
Effects of four different M channel enhancers on heterologously expressed Kv7.2/Kv7.3 channels
Initially, we compared the actions of the M channel enhancers Rtg, Flu, ZnPth and H2O2 on Kv7.2/Kv7.3 channels heterologously expressed in CHO cells. All Kv7 channel enhancers were applied at concentrations predicted to exert a maximal effect. Results of these experiments are presented in Figs 2–4 and Table 1. Despite having different binding/action sites within the Kv7 channel proteins, but in agreement with previous reports (Schenzer et al. 2005; Wuttke et al. 2005; Gamper et al. 2006; Xiong et al. 2007), all four compounds tested had the following two aspects to their M current augmenting effects: (i) a negative shift of channel voltage dependence; and (ii) an increase in maximal conductance at saturating voltages (Fig. 2). The enhancers differed, however, in their efficacy towards both these effects. Figure 2 summarizes the effects of four enhancers on the M channel G–V relationships (see Methods). Figure 2A shows the voltage protocol used for measurement of outward activating M currents, which were used to plot the IM activation curves analysed in Fig. 2D, E, G, H, J, K, M and N. Figure 2B depicts exemplar currents elicited in Kv7.2/Kv7.3-overexpressing CHO cells by the voltage protocol shown in Fig. 2A before and during (as indicated) the application of Rtg (10 μm). Figure 2C shows the mean G–V relationship of M current in the control conditions. Figure 2D, G, J and M shows non-normalized curves, so both the negative shift in G–V curves and the effect on maximal conductance can be seen. Figure 2E, H, K and N displays normalized G–V curves, which highlight the shift of channel voltage dependence. Figure 2F, I, L and O shows the mean effect of each enhancer on the current–voltage relationship (measured at the end of the voltage prepulse shown in Fig. 2A). The effects of enhancers on channel voltage dependence are summarized in Table 1. Ranking the M channel enhancers based on their ability to shift the voltage dependence of activation in a negative direction, Rtg produced the largest negative shift of V0.5 and ZnPth the smallest (RTG > H2O2= Flu > ZnPth; ANOVA, P < 0.05). By contrast, when the enhancers were ranked based on their ability to increase M current at saturating voltages a different order of efficacy was observed (H2O2= Rtg > ZnPth > Flu; ANOVA, P < 0.05) Interestingly, ZnPth caused a change in the slope of the Boltzmann curve (P < 0.05), whereas the other enhancers had no statistically significant effect on this parameter (Table 1).
Figure 2. Effects of enhancers on the voltage dependence of Kv7.2/Kv7.3 channels.

Perforated whole-cell patch-clamp recording from Chinese hamster ovary (CHO) cells overexpressing Kv7.2/Kv7.3 subunits. A, voltage protocol used to derive G–V curves for Kv7.2/Kv7.3. B, exemplar current traces in response to application of the voltage protocol depicted in A during resting conditions (Basal; left) and in the presence of a maximal concentration (10 μm) of the Kv7 channel enhancer retigabine (Rtg; right). Dotted line indicates zero current. C, mean G–V curve obtained using the protocol shown in A; n = 20 for Kv7.2/Kv7.3 channels under control conditions. D, G, J and M, conductance (G) measured in response to stepping from the prepulse voltage (Vpre) to +40 mV was normalized to the maximal conductance (Gmax) measured at a saturating voltage in basal conditions. Data were fitted with a Boltzmann equation. Black squares indicate voltage dependence of Kv7.2/Kv7.3 in basal conditions; red circles indicate data in the presence of saturating/maximal concentration of the M channel enhancers, retigabine (Rtg; 10 μm), flupirtine (Flu; 10 μm), zinc pyrithione (ZnPth; 10 μm) or hydrogen peroxide (H2O2; 300 μm). E, H, K and N, normalized activation curves from the data shown in (D, G, J and M, respectively). The data were constrained such that Gmax= 1, allowing comparison of the shift in V0.5 induced by M channel enhancers. F, I, L and O, mean steady-state current–voltage relationships obtained using the voltage protocol shown in A.
Figure 4. Effect of Kv7 channel enhancers on activation and deactivation kinetics of heterologously expressed Kv7.2/Kv7.3.
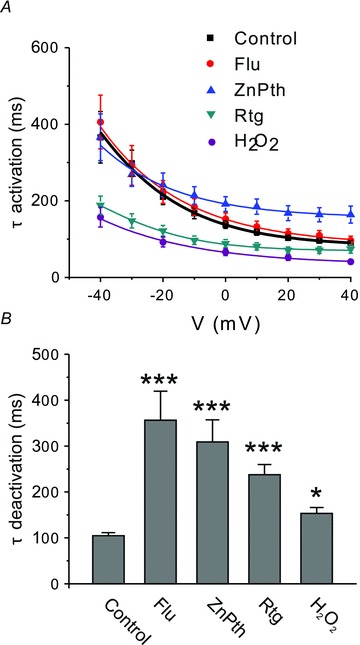
A, channel activation in response to 600 ms depolarizing voltage pulses from a holding potential of –100 mV was fitted with a single-exponential function, and the time constant (τ) was plotted against the voltage. Control (n = 35), Flu (n = 12), ZnPth (n = 9), Rtg (n = 8) and H2O2 (n = 12). B, channel deactivation was measured upon stepping from 0 to −100 mV for 800 ms and fitted with a single-exponential function with a time constant, τ. Significant difference from control is indicated by *P < 0.05, ***P < 0.001 (ANOVA with Bonferroni's post hoc test). Control (n = 39), Flu (n = 12), ZnPth (n = 9), Rtg (n = 5) and H2O2 (n = 12).
Table 1.
Effect of M channel enhancers on the M current voltage dependence and kinetics
| Treatment | V0.5 (mV) | ΔV0.5 (mV) | Slope factor, h | τ activation (from −60 to 0 mV; ms) | τ deactivation (from 0 to −100 mV; ms) |
|---|---|---|---|---|---|
| Control, n = 40 | −26.1 ± 0.6 | Not applicable | 14.0 ± 0.6 | 128 ± 9 | 104 ± 7 |
| Rtg, n = 7 | −60.6 ± 0.3 | −30.5 ± 1.7 | 11.4 ± 0.3 | 88 ± 10 | 237 ± 22 |
| Flu, n = 12 | −45.7 ± 0.4 | −18.5 ± 1.4 | 13.9 ± 0.4 | 152 ± 16 | 356 ± 63 |
| ZnPth, n = 9 | −26.3 ± 0.9 | −5.7 ± 0.9 | 16.8 ± 0.9 | 191 ± 19 | 309 ± 48 |
| H2O2, n = 12 | −40.8 ± 0.9 | −20.4 ± 1.3 | 13.9 ± 0.7 | 66 ± 9 | 153 ± 13 |
Abbreviations: Flu, flupirtine; Rtg, retigabine; and ZnPth, zinc pyrithione.
Our aim was to compare the efficacy of M channel enhancers in conditions of M channel inhibition. However, correct analysis of activation curves in such conditions is difficult owing to the small and variable size of currents (especially at negative potentials), therefore, in the rest of this study we analysed the effect of the enhancers on the steady-state M current amplitude at two voltages, 0 and –60 mV. Increases in M current amplitude at a saturating voltage of 0 mV characterizes the effect on maximal current, while at –60 mV (which is a voltage that is just above the threshold for M channel activation) enhancement of the steady-state M current mainly reflects the negative shift of the channel voltage dependence. Figure 3A and B shows the current enhancement at 0 mV as absolute current amplitude increase (Fig. 3A) and as fold increase of the basal current after the addition of the enhancer (Fig. 3B); the latter figure gives a more accurate comparison of the efficacy of individual enhancers because it gives paired data for each enhancer compared with each own paired control, while Fig. 3A is a group comparison with the control group being the mean value for all cells before the addition of an enhancer. At 0 mV, Flu, Rtg, ZnPth and H2O2 enhanced the M current amplitude by 1.35 ± 0.04-, 1.72 ± 0.13-, 1.50 ± 0.10- and 1.92 ± 0.13-fold, respectively. At –60 mV in control conditions, there was a small outward current that was sensitive to the specific M channel blocker, XE991 (10 μm). All the enhancers augmented this steady-state current (Fig. 3C and D); Flu, Rtg, ZnPth and H2O2 enhanced the M current amplitude at –60 mV by 4.93 ± 0.72-, 14.07 ± 3.8-, 2.52 ± 0.60- and 4.76 ± 0.82-fold, respectively.
Figure 3. Efficacy of M channel enhancers at saturating (0 mV) and near-threshold voltages (−60 mV).
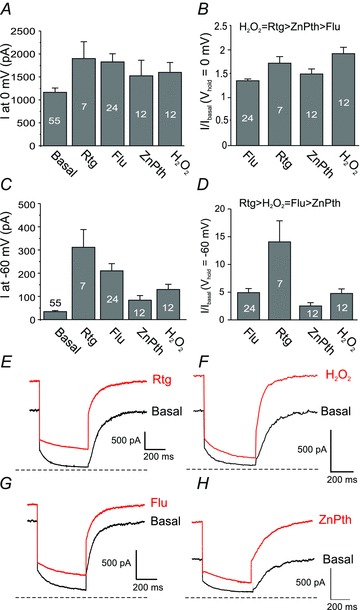
A, effect of M channel enhancers on the steady-state M current amplitude of heterologously expressed Kv7.2/Kv7.3 channels at 0 mV. Number of experiments is depicted within bars. B, effect of M channel enhancers at 0 mV expressed as fold increase of the basal current. Order of efficacy was determined using a one-way ANOVA with Tukey's post hoc test (P < 0.05). C and D, same as A and B but for the steady-state M current amplitude at –60 mV. E–H, exemplar current traces in response to a hyperpolarizing voltage step from 0 to –60 mV before and after the application of an individual M channel enhancer (as indicated). Concentrations of Kv7 enhancers were the same as those used in Fig. 2. Dashed line indicates zero current.
All four enhancers significantly slowed the M current deactivation kinetics (Fig. 4 and Table 1), with Flu and ZnPth producing the largest slowing, and H2O2 the smallest. Hydrogen peroxide and Rtg produced significant acceleration of M current activation kinetics across all voltages tested, Flu had no effect, and ZnPth produced a small slowing of activation times at voltages above +20 mV.
Action of enhancers on physiologically inhibited M channels
The most studied mechanism of physiological modulation of M channel activity is the inhibition of M channels by G-protein-coupled receptors that utilize Gq/11 types of Gα and activate PLC (reviewed by Delmas & Brown, 2005). Phospholipase C hydrolyses membrane PIP2 into diacylglycerol (DAG) and inositol 1,4,5-trisphosphate (IP3); the latter can then induce release of Ca2+ from IP3-sensitive intracellular stores. M channels are inhibited by both PIP2 depletion (because they need PIP2 for their activity; Suh & Hille, 2002; Zhang et al. 2003; Li et al. 2005) and by CaM-mediated Ca2+ action (Selyanko & Brown, 1996; Gamper & Shapiro, 2003; Gamper et al. 2005a; Etzioni et al. 2011), although different Gq/11 receptors vary in their ‘preference’ towards one or the other mechanism (Delmas & Brown, 2005; Delmas et al. 2005; Gamper & Shapiro, 2007; Hernandez et al. 2008). It has been hypothesized that in nociceptive DRG neurons, inflammatory mediators, such as BK and proteases, preferentially use Ca2+-dependent inhibition, although PIP2 depletion is also likely to contribute to an overall effect (Linley et al. 2008; Liu et al. 2010). In order to test the efficacy of enhancers to ‘rescue’ M channel activity in conditions of physiological inhibition, we designed experiments to mimic both routes of PLC-mediated M channel inhibition.
Effect of acute PIP2 depletion on M channel enhancer efficacy
Initially, we tested the efficacy of four enhancers to augment M current during acute PIP2 depletion. Thus, we used a recently developed chemically induced dimerisation (CID) system that allows rapid inducible PIP2 depletion in cells, without the subsequent production of any second messengers that are normally released when PIP2 is hydrolysed by PLC (Suh et al. 2006; Varnai et al. 2006). The variant of the system used in this study contained a membrane-targeted FRB domain of the mammalian target of rapamycin (Rapa) and Rapa-binding protein FKBP12 fused with truncated human type IV 5-phosphatase (Ptase). Coexpression of such systems in cell lines, together with a PIP2-sensitive ion channel, such as Kv7, allows rapid induction of PIP2 depletion and channel inhibition by Rapa perfusion (Suh et al. 2006; Varnai et al. 2006). In accord with previous reports, in cells overexpressing the CID system and Kv7.2/Kv7.3, Rapa (100 nm) induced a 3.2 ± 0.3-fold reduction in tonic M current density (n = 36; measured at 0 mV). However, in agreement with a previous study (Suh et al. 2006), Rapa had no effect on M current in cells without CID (data not shown). We then performed experiments in which Rtg, Flu or ZnPth were first applied twice on their own, to test for possible ‘desensitization’ of the response. We then applied Rapa and, once the M current amplitude had reached its new, reduced steady state, the enhancer was applied for a third time to test the effect of the enhancer following PIP2 depletion (Fig. 5A and C). Only cells in which the first and second control application of the enhancer did not differ by more than 10% were analysed. As the action of H2O2 on M channels is not reversible, it was not possible to implement this protocol for H2O2. In this case, separate populations of cells (with and without Rapa pretreatment) were analysed for H2O2 effects. At 0 mV after Rapa treatment, all the enhancers tested were able to produce a marked increase in the whole-cell M current (Fig. 5D and Table 2), augmenting the current amplitude to the basal level or above (with the exception of Flu, for which the current in the presence of Rapa and Flu was still significantly lower than basal; Fig. 5D and Tables 2 and 4). However, the maximal current amplitudes in the presence of Rapa (Rapa + enhancer) in all cases were still significantly smaller in comparison to the maximal amplitudes of enhanced currents before Rapa (Fig. 5D and Table 2). At –60 mV, all the enhancers were able to restore the M channel activity to resting levels or above (Fig. 5E and Table 4). Zinc pyrithione augmented currents to a level that was significantly higher than the resting M current amplitude before PIP2 depletion; these data are summarized in Table 2. An important conclusion of these experiments is that all the enhancers were able to ‘restore’ M current after PIP2 depletion to pre-inhibited levels or above at both –60 and 0 mV (with the exception of Flu at 0 mV).
Figure 5. Effect of phosphatidylinositol 4,5-bisphosphate (PIP2) depletion and Ca2+/CaM on the efficacy of Kv7 channel enhancers.

A and C–E, CHO cells were transfected with a rapamycin (Rapa)-operated chemically induced dimerization system along with Kv7.2/Kv7.3 channel subunits and whole-cell current measured using perforated patch. A, example voltage-clamp traces showing the effects of successive application of Rtg (10 μm), Rapa (100 nm), Rtg + Rapa and XE991 (10 μm) on Kv7.2/Kv7.3 current in response to a depolarizing voltage step from –60 to 0 mV. C, time course of a typical Rapa experiment. The M current amplitude (XE991-sensitive steady-state current) at 0 mV is plotted against time; substances were applied as indicated by the bars. D, mean steady-state M current amplitudes at 0 mV for four enhancers tested in experiments as in C. Number of experiments is given in Table 2. Values significantly smaller than the control value are indicated by *; those that are larger than control are indicated by $ (p < 0.05); $$ (p < 0.01; Student's paired t test). Data representing the effect of H2O2 in the control conditions are not included because these were not paired control experiments (as explained in the main text); these data are given in Table 2. E, similar to D, but for steady-state M current amplitudes at –60 mV; labelled as in D. B, F and G, CHO cells were transfected with calmodulin along with Kv7.2/Kv7.3 channel subunits, and whole-cell current was measured using conventional (‘fast’) whole-cell patch clamp, in which the pipette solution contained 1 μm free Ca2+ buffered with EGTA. Control cells were not transfected with calmodulin, and the pipette solution contained 50 nm free Ca2+. B, example voltage clamp trace showing the effect of Rtg (10 μm) on Kv7.2/Kv7.3 current in response to a depolarizing voltage step from –60 to 0 mV. F and G, similar to D and E, but for Ca2+/CaM saturation experiments. Number of experiments is given in Table 3.
Table 2.
Effect of M channel enhancers on the M current amplitude (in nanoamperes) after phosphatidylinositol 4,5-bisphosphate (PIP2) depletion
| Control | Enhancer | Rapamycin | Rapamycin + enhancer | |||||
|---|---|---|---|---|---|---|---|---|
| Treatment | 0 mV | −60 mV | 0 mV | −60 mV | 0 mV | −60 mV | 0 mV | −60 mV |
| Rtg, n = 9 | 0.56 ± 0.15 | 0.08 ± 0.01 | 0.92 ± 0.22 | 0.18 ± 0.04 | 0.22 ± 0.08 | 0.03 ± 0.01 | 0.50 ± 0.17 | 0.14 ±0.06 |
| Flu, n = 9 | 0.78 ±0.13 | 0.13 ± 0.06 | 1.10 ± 0.15 | 0.19 ± 0.08 | 0.30 ± 0.07 | 0.08 ± 0.04 | 0.45 ± 0.09 | 0.12 ± 0.04 |
| ZnPth, n = 12 | 0.77 ± 0.12 | 0.13 ± 0.04 | 1.54 ± 0.23 | 0.35 ± 0.07 | 0.35 ± 0.08 | 0.11 ± 0.04 | 1.18 ± 0.16 | 0.37 ± 0.06 |
| H2O2, n = 8 | 1.17 ± 0.13 | 0.10 ± 0.02 | 2.02 ± 0.34 | 0.25 ± 0.07 | 0.48 ± .012 | 0.07 ± 0.02 | 1.58 ± 0.20 | 0.20 ± 0.05 |
Table 4.
Efficacy of M channel enhancers to ‘reverse’ inhibitory action of PIP2 depletion or Ca2+/CaM
| Enhancer (Iinhib+enhancer/Ibasal) | |||||
|---|---|---|---|---|---|
| Vm | Inhibitory conditions | Flu | Rtg | ZnPth | H2O2 |
| −60 mV | Ptase/Rapa | 1.87 ± 0.4* | 2.09 ± 0.6* | 3.86 ± 0.8* | 2.51 ± 0.6* |
| −60 mV | Ca2+/CaM | 1.32* | 2.92* | 1.74* | — |
| 0 mV | Ptase/Rapa | 0.62 ± 0.1‡ | 0.97 ± 0.03† | 1.86 ± 0.2* | 1.33 ± 0.3* |
| 0 mV | Ca2+/CaM | 0.46‡ | 0.17‡ | 0.61‡ | — |
Efficacy to augment M current amplitude was measured at 0 and –60 mV and expressed as a ratio of Iinhib+enhancer to Ibasal. Where possible, ratios (R) were calculated from the individual paired experiments and are given as means ± SEM; where this was not possible, the ratio of mean amplitudes is used and given as single values. *R > 1.25; †R = 0.75−1.25; ‡R < 0.75. A ratio of 1 indicates restoration of inhibited current to basal level.
Effect of Ca2+/CaM inhibition on M channel enhancer efficacy
We next tested the effect of the enhancers on M channels tonically inhibited by elevated Ca2+ and CaM levels. Intracellular Ca2+ partly inhibits M current, with an IC50 in the range of 100 nm (Selyanko & Brown, 1996; Gamper & Shapiro, 2003), and in order to confer maximal Ca2+ sensitivity to heterologously expressed Kv7.2/Kv7.3 channels, an excess of CaM is required (Gamper & Shapiro, 2003; Etzioni et al. 2011). Thus, in order to create intracellular conditions in which M channels are maximally inhibited by Ca2+/CaM, we coexpressed Kv7.2, Kv7.3 and CaM in CHO cells and performed conventional whole-cell recordings with 1 μm free Ca2+ in the pipette (see Methods for details). We could not analyse the effect of H2O2 in these settings because it is based on the oxidative modification of the channel protein, which takes some 10 min to develop; long recordings in the conventional whole-cell mode with high Ca2+ in the pipette were often compromised by the development of secondary ‘leak’ conductance; thus, we restricted our analysis to Rtg, Flu and ZnPth. In Ca2+/CaM-loaded cells, tonic M current amplitude at 0 mV was 4.8 ± 0.6-fold (n = 27) smaller than the control value (that is, recorded in fast whole-cell mode with the pipette solution containing 50 nm free Ca2+ from CHO cells overexpressing Kv7.2/Kv7.3 only; n = 23; Fig. 5B and F). As in the case of the PIP2-depleted cells, all enhancers tested were able to augment M current amplitude at both 0 and –60 mV (Fig. 5B, F, G and Table 3); but at 0 mV, none of the enhancers were able to return the current to control values obtained with low {Ca2+}i in the patch pipette in basal conditions (Fig. 5F and Tables 3 and 4). However, at –60 mV, all enhancers were able to recover the current to control levels or above, with Rtg augmenting Ca2+/CaM-inhibited current to a level significantly larger than the control value (Fig. 5G and Tables 3 and 4). In general, the inhibitory effect of Ca2+/CaM was comparable to that of the PIP2 depletion (4.8 ± 0.6- vs. 3.2 ± 0.3-fold). However, it is possible that the effect of PIP2 depletion on M current amplitude is underestimated in our experiments because some level of tonic activity of the overexpressed phosphatase could have resulted in a degree of tonic PIP2 depletion.
Table 3.
Effect of M channel enhancers on the M current amplitude (in nanoamperes) in calmodulin (CaM)-overexpressing cells with 1 μm{Ca2+}i
| Control cells (no CaM overexpression, {Ca2+}i = 50 nm) before enhancer | Control cells (no CaM overexpression, {Ca2+}i = 50 nm) after enhancer | Calmodulin-overexpressing cells ({Ca2+}i= 1 μm) before enhancer | Calmodulin-overexpressing cells ({Ca2+}i = 1 μm) after enhancer | |||||
|---|---|---|---|---|---|---|---|---|
| Treatment | 0 mV | −60 mV | 0 mV | −60 mV | 0 mV | −60 mV | 0 mV | −60 mV |
| Rtg, n = 8 | 1.18 ± 0.25 | 0.022 ± 0.005 | 1.92 ± 0.36 | 0.33 ± 0.084 | 0.10 ± 0.043 | 0.008 ± 0.005 | 0.20 ± 0.088 | 0.065 ± 0.02 |
| Flu, n = 11 | 1.33 ± 0.18 | 0.043 ± 0.009 | 1.77 ± 0.25 | 0.23 ± 0.042 | 0.34 ± 0.090 | 0.012 ± 0.007 | 0.61 ± 0.13 | 0.057 ± 0.016 |
| ZnPth, n = 11 | 1.05 ± 0.13 | 0.031 ± 0.012 | 1.48 ± 0.19 | 0.061 ± 0.015 | 0.28 ± 0.042 | 0.021 ± 0.007 | 0.65 ± 0.10 | 0.055 ± 0.009 |
Rescue of native M channels from bradykinin-induced inhibition
Next we looked at the native M current in cultured DRG neurons. As cultured DRG neurons represent a heterogeneous population of neurons, we restricted this study to small-diameter (∼20 μm) DRG neurons responsive to capsaicin (and thus TRPV1 positive), which are mostly nociceptive neurons (Binshtok et al. 2007). In a previous study, we have demonstrated that activation of PLC by BK produces robust rises in intracellular Ca2+ but does not produce significant global PIP2 depletion in nociceptive DRG neurons (Liu et al. 2010). However, overexpression of exogenous bradykinin B2 receptors (B2Rs) resulted in a large global depletion of PIP2 (Liu et al. 2010). Thus, the inhibition of native M channels in DRG neurons by triggering endogenous B2Rs would be mediated largely by Ca2+/CaM (Liu et al. 2010), while the application of BK to neurons overexpressing exogenous B2Rs would result in inhibition of M channels via both Ca2+/CaM and PIP2 depletion.
Figure 6 summarizes data from experiments performed on cultured small-diameter TRPV1-positive DRG neurons. As DRG neurons express many other K+ channels that activate at depolarizing voltages, thus masking M current at saturating voltages (e.g. at 0 mV), we only evaluated the effect of enhancers at a threshold voltage of –60 mV. In agreement with the data from CHO cells (Fig. 3C and D), Rtg induced an 8.9 ± 1.6-fold (n = 6) augmentation of the outward current at –60 mV, with H2O2, ZnPth and Flu augmenting the current by 4.4 ± 1.0- (n = 12), 2.6 ± 0.6- (n = 10) and 3.8 ± 0.6-fold (n = 10), respectively (Fig. 6A and B). By the efficacy to produce activation of native M channels at –60 mV in DRG neurons, the enhancers can be arranged in the sequence Rtg > H2O2= Flu ≥ ZnPth, which is essentially the same as the sequence for the efficacy to produce a voltage shift as measured in CHO cells.
Figure 6. Effects of Kv7 channel enhancers on M current in cultured dorsal root ganglion (DRG) neurons.

Perforated whole-cell patch-clamp recording from cultured small-diameter TRPV1-positive rat DRG neurons. A, mean current was measured at –60 mV in the presence of Kv7 channel enhancers and normalized to basal current (I/Ibasal). B, effect of Kv7 channel enhancers was assayed during conditions of receptor-mediated inhibition induced by bradykinin (BK; 1 μm). Data were normalized to the current at –60 mV in the presence of BK. C, example time course from B, showing the change in current at –60 mV upon addition of flupirtine (10 μm) in the absence and in the presence (as indicated by the bars) of 1 μm BK. D, experiment similar to that shown in C, but performed with a neuron overexpressing (Amaxa nucleofection) exogenous bradykinin B2 receptors (B2Rs). E, summary of the experiments as in D; data are represented as the absolute current at –60 mV. NS, not significant. F, effects of BK, Flu and Rtg on the resting membrane potential of DRG neurons. Shown are the mean time courses for ΔVm=Vm−Vm0; compounds were applied during the periods indicated by the bars; difference from BK is indicated by **P < 0.01, ***P < 0.001 (ANOVA with Tukey's post hoc test). G, summary of the effects measured as in F. H, exemplary current-clamp recording, showing an increase of action potential firing by the cultured small DRG neuron in response to BK application, which is reversed by the application of Flu. Firing was induced by injection of depolarizing current of 200 pA.
In accord with previous observations (Liu et al. 2010), 200 nm BK inhibited M current (measured as a whole-cell outward current at –60 mV sensitive to the specific M channel blocker, XE991; Fig. 6B and C) in small DRG neurons from 34.2 ± 11 to 12.5 ± 9 pA (n = 11), which is an inhibition of 63%. The M channel enhancers, Rtg and Flu, augmented BK-inhibited outward current by 11.3 ± 2.2- (n = 6) and 8.0 ± 2.5-fold (n = 6), respectively (Fig. 6B and C). Thus, Rtg and Flu were able to enhance the BK-inhibited M current to a level significantly higher than the control value (that is, basal M current amplitude before BK application); however, in the presence of BK the maximal current amplitudes for both enhancers were still significantly smaller in comparison to the maximal enhancer-augmented current amplitudes before the BK addition (Fig. 6A–C). It was not possible to analyse the effects of H2O2 and ZnPth properly using this experimental protocol; as mentioned above, the effect of H2O2 takes some 10 min to plateau and BK receptors desensitize during this time, causing M current inhibition to recover (Liu et al. 2010). Zinc pyrithione was found to have multiple non-reversible effects on the whole-cell currents in DRG neurons, which made it impossible to isolate a pure M channel enhancer effect.
In order to saturate both endogenous pathways of M channel inhibition in DRG neurons, we transfected them with exogenous B2Rs. The results of these experiments are shown in Fig. 6D and E. In B2R-overexpresing DRG neurons, BK induced complete inhibition of the XE991-sensitive outward current at –60 mV (Fig. 6E; n = 5) and Flu failed to produce significant augmentation of such maximally inhibited M channels. The wash-out of BK, however, not only resulted in recovery of M current but also restored the ability of Flu to induce the same degree of M current augmentation as before the application of BK.
Finally, we evaluated the effects of Rtg and Flu on the resting membrane potential and the excitability of DRG neurons in current-clamp mode. The DRG neurons had a resting membrane potential of −51 ± 1.6 mV (n = 27); Rtg and Flu induced rapid hyperpolarization by 15.2 ± 1.5 (n = 5) and 6.5 ± 0.5 mV (n = 7), respectively (Fig. 6F and G; a higher efficacy of Rtg in comparison to Flu is in accord with the higher magnitude of voltage shift induced by this opener, see Fig. 2). Bradykinin at 200 nm induced depolarization of the resting membrane potential by 3.7 ± 0.3 mV (n = 15). However both Rtg and Flu, added at the peak of BK-induced depolarization (Fig. 6F), were still able to hyperpolarize the membrane potential to the same level as in the control conditions (without BK application; Fig. 6F and G). Thus, during BK application Rtg and Flu hyperpolarized the membrane potential by 14.8 ± 1.3 (n = 5) and 5.9 ± 1.9 mV (n = 4), respectively (Fig. 6F and G); these ΔVm values were calculated as the difference between basal Vm (before BK application) and Vm during application of BK and enhancer. This unhindered ability of openers to hyperpolarize the resting membrane potential of a DRG neuron was somewhat surprising because the efficacy of openers to augment M current amplitude at –60 mV (which is near the basal resting membrane potential of a cultured DRG neuron) in absolute terms was reduced (Fig. 6A–C). However, it is conceivable that there is a certain limit for hyperpolarization in the DRG neurons brought about, for example, by the hyperpolarization-activated h-current (Ih), which is abundantly expressed in small nociceptive DRG neurons (Emery et al. 2011) and which would limit the ability of K+ channels to hyperpolarize the membrane potential. In such a scenario, after BK treatment Rtg and Flu are still capable of producing sufficient M channel activation to hyperpolarize the membrane potential to such hypothetical limits. We also tested the effect of BK and openers on the excitability of DRG neurons. Thus, we measured the number of action potentials fired by a DRG neuron in response to the injection of 200 pA of depolarizing current; all untreated neurons (n = 15) fired a single action potential. However, BK induced multiple action potential firing in five of 15 neurons (Fig. 6H). This multiple firing was subject to varying levels of desensitization (that is, some neurons spontaneously reverted to a single action potential phenotype even in the presence of BK and still depolarized); thus, the effect of the enhancers was difficult to evaluate unambiguously. However, as in the example shown in Fig. 6H, in some neurons the BK-induced excitability was rapidly quenched by both Flu (as shown) and Rtg (not shown).
Discussion
In this study, we compared the action of four M channel enhancers with distinct sites of action within the M channel protein. Triaminopyridines, such as Rtg and Flu, bind to a specific tryptophan of the cytosolic part of S5 (Schenzer et al. 2005; Wuttke et al. 2005); ZnPth most probably interacts with the pore region of the channel (Xiong et al. 2007), while H2O2 covalently modifies cysteines within the channel S2–S3 linker (Gamper et al. 2006). The three classes of enhancers are reported to have different subunit specificity profiles within the Kv7 family; thus, triaminopyridines do not activate Kv7.1, while the Kv7.3 subunit is the most sensitive to their action (Tatulian et al. 2001; Tatulian & Brown, 2003; Schenzer et al. 2005; Wuttke et al. 2005). In contrast, ZnPth augments all Kv7 currents except Kv7.3, while H2O2 activates only Kv7.2, Kv7.4 and Kv7.5 (Gamper et al. 2006). All three types of enhancers augment currents of the heteromeric Kv7.2/Kv7.3 M channels. The enhancers also have different effects on M channel kinetics. As evident from Table 1 and Fig. 4 (and also in accord with previous literature), all four compounds tested slowed the kinetics of M channel deactivation, but they differed in their effects on activation kinetics; Flu had little or no effect on kinetics, whereas H2O2 and Rtg accelerated the time-dependent activation and ZnPth induced slowing of activation at depolarized voltages. All these data suggest that the three types of enhancers are indeed mechanistically different in their actions.
Inflammatory mediators, such as bradykinin and proteases, inhibit M current in DRG neurons through a PLC-dependent mechanism (Linley et al. 2008, 2010; Liu et al. 2010), resulting in an increase in peripheral nerve excitability in nerves innervating the inflamed tissue. M channel enhancers have been proposed as possible analgesics (Gribkoff, 2008; Brown & Passmore, 2010), and we therefore investigated whether they would be suitable for treatment of inflammatory pain, in which M channels may be tonically inhibited. We asked the following three questions. (i) Is it possible to overcome physiological (receptor-induced) M channel inhibition with pharmacological tools? (ii) Is the relative efficacy of M channel enhancers altered after physiological inhibition? (iii) What biophysical features of the M channel opening effect would confer efficient recovery of the physiological M channel block?
To quantify the ability of enhancers to recover M current amplitude after inhibition, we calculated the ratio of the M current amplitude after enhancer in the presence of inhibition (by either PIP2 depletion or by Ca2+/CaM) to the M current amplitude in basal conditions (Iinhib+enhancer/Ibasal; Table 4). The ratio of one indicates enhancer induced restoration of inhibited current to basal level; values below unity indicate failure to restore the basal amplitude, while values above unity indicate enhancement of M current to a level higher than basal. In CHO cells expressing Kv7.2/Kv7.3, we found that, irrespective of the mechanism of inhibition, all enhancers were able to recover the M current at –60 mV to control levels or above (Fig. 5E and G and Table 4). At 0 mV, none of the enhancers applied during Ca2+/CaM-inhibited conditions could recover the M current to control levels (Fig. 5F and Table 4); however, Rapa-inhibited currents could be recovered by Rtg, ZnPth and H2O2 but not by Flu (Fig. 5D and Table 4). Likewise, in DRG neurons both Flu and Rtg were able to increase the BK-inhibited M current at –60 mV to above control levels (Fig. 6B and C), resulting in a significant hyperpolarization of the membrane potential (Fig. 6F and G) and a reduction in BK-induced neuronal hyperexcitability (Fig. 6H). We suggest that the efficacy to augment M channel activity at or near the channel threshold voltage of –60 mV (which is also close to the resting membrane potential of many neurons) is most important for the control of neuronal membrane potential and, thus, for setting the threshold for the action potential firing. The steepness of voltage dependence of Kv7 channels suggests that a –20 to –30 mV shift of the activation curve will have a dramatic effect on the M current amplitude at –60 mV, because it would correspond to a change in the channel open probability from that at the threshold (open probability close to 0) to that at near the V0.5 (Table 1 and Fig. 2). On the other contrary, the efficacy to augment M channel activity at more depolarizing voltages will be more important for accommodation within a train of action potentials and for modulation of firing patterns; at saturating voltages, the effect of the leftward shift of the voltage dependence tails off, while the increase of maximal conductance would still be seen as an enhanced repolarizing action of M current. Nociceptive neurons have a high and tightly controlled threshold for action potential firing and are normally silent unless challenged with potentially damaging external stimuli (Linley et al. 2010). Thus, we hypothesize that in order to prevent action potential firing by nociceptive fibres (which is essential for peripheral analgesia), the control of resting membrane potential and firing threshold would be the most important aspects. Thus, the enhancer conferring the largest shift in channel voltage dependence (e.g. Rtg in this study) would have the highest analgesic efficacy, while the efficacy to produce an enhancement of maximal conductance would have a much lesser bearing at the periphery.
We also investigated whether the relative efficacy (that is the increase in current amplitude relative to the previous steady state) of M channel enhancers is altered after the inhibition by PIP2 depletion or Ca2+/CaM. We calculated the ratio of the M current enhancement in basal conditions (as a fold change in current amplitude) to that during the inhibition with PIP2 depletion or Ca2+/CaM {(Ibasal/Ienhancer)/(Iinhib/Iinhib+enhancer); Table 5}. The ratio of one indicates that during the inhibition the enhancer has the same relative efficacy (i.e. induces the same fold change of M current amplitude) as during basal conditions, while values below or above unity indicate reduced or increased relative efficacy, respectively. Interestingly, while the absolute efficacy (i.e. the maximal current amplitude in the presence of an enhancer) was generally reduced by both inhibitory conditions (sometimes dramatically; Tables 2 and 3 and Fig. 5), we found that the relative efficacy of all enhancers was either the same or enhanced during both inhibitory conditions (with the exception of Rtg at –60 mV during Ca2+/CaM inhibition; Table 5). Phosphatidylinositol 4,5-bisphosphate stabilizes M channel opening; thus, PIP2 depletion forces M channels into the closed state and reduces the open probability (Li et al. 2005). Likewise, CaM was also recently suggested to reduce open probability of Kv7.2 (Etzioni et al. 2011; although there is still a debate concerning whether it is a transient binding of CaM that affects channel activity or a conformational change of tethered CaM; Wen & Levitan, 2002). Therefore, increased relative efficacy of an enhancer during conditions of partial M channel inhibition may suggest state dependence of an effect (e.g. preferential binding of an enhancer in the closed state of a channel). However, the increased relative efficacy of Rtg was only observed in M channels inhibited by PIP2 depletion but not in channels inhibited by Ca2+/CaM, which makes such a possibility less likely for Rtg.
Table 5.
Changes in the relative efficacy of the M channel enhancers to augment M current during PIP2 depletion or Ca2+/CaM saturation
| Enhancer (Ibasal/Ienhancer)/(Iinhib/Iinhib+enhancer) | |||||
|---|---|---|---|---|---|
| Vm | Inhibitory conditions | Flu | Rtg | ZnPth | H2O2 |
| −60 mV | Ptase/Rapa | 1.02† | 2.05* | 1.24† | 1.1† |
| −60 mV | Ca2+/CaM | 0.9† | 0.57‡ | 1.34* | — |
| 0 mV | Ptase/Rapa | 1.1† | 1.36* | 1.69* | 1.9* |
| 0 mV | Ca2+/CaM | 1.34* | 1.23† | 1.64* | — |
Ratios of Ibasal/Ienhancer divided by Iinhib/Iinhib+enhancer were calculated from the M current amplitudes measured at 0 and –60 mV in basal conditions (Ibasal), during PIP2 depletion or Ca2+/CaM saturation (Iinhib) or during PIP2 depletion or Ca2+/CaM saturation after the application of enhancer (Iinhib+enhancer). *R > 1.25; †R = 0.75−1.25; ‡R < 0.75. A ratio of 1 indicates that the fractional increase in current induced by the enhancer is the same under basal or inhibited conditions.
Interestingly, when we overexpressed exogenous B2 receptors in DRG neurons and, thus, maximised both Ca2+/CaM-mediated and PIP2 depletion-mediated inhibition of native M channels in DRG neurons, the ability of the enhancer (Flu) to rescue pre-inhibited M current was almost completely (but reversibly) lost (Fig. 6D). This experiment suggests that when channel activity is completely suppressed, no pharmacological M current enhancement is possible. It would be interesting to test ZnPth further in this regard because our data suggest that this compound was able to reverse the M channel inhibition by PIP2 depletion to a certain extent; unfortunately, ZnPth induced large leak-like conductance in DRG neurons, which hindered the analysis.
In conclusion, our data suggest that pharmacological M channel enhancers have the potential to overcome inhibition of M channels in peripheral sensory neurons induced by inflammatory mediators and, thus, may be considered as a therapeutic strategy in management of inflammatory pain.
Acknowledgments
We thank Katarzyna Marszalek for expert technical assistance. This work was supported by grants from the Wellcome Trust (080593/Z06/Z), MRC (G0700966 and G1002183) and Royal Society (JP080524) to N.G.
Glossary
Abbreviations
- BK
bradykinin
- B2R
bradykinin B2 receptor
- CaM
calmodulin
- CHO cells
Chinese hamster ovary cells
- CID
chemically induced dimerization
- DAG
diacylglycerol
- DRG
dorsal root ganglion
- EGFP
enhanced green fluorescent protein
- FKBP12
FK506 binding protein 12
- Flu
flupirtine
- FRB
FKBP12-Rapamycin Binding domain of mammalian target of rapamycin (mTOR)
- GPCR
G-protein-coupled receptor
- IP3
inositol 1,4,5-trisphosphate
- PIP2
phosphatidylinositol 4,5-bisphosphate
- PLC
phospholipase C
- Rapa
rapamycin
- Rtg
retigabine
- V0.5
voltage of half-maximal activation
- ZnPth
zinc pyrithione
Author contributions
J.E.L.: conception and design of the experiments; collection, analysis and interpretation of data; drafting the article. L.P.: collection, analysis and interpretation of data; drafting the article. D.H.: collection, analysis and interpretation of data; drafting the article. N.G.: conception and design of the experiments; analysis and interpretation of data; writing the article. All authors approved the final version of the manuscript.
References
- Biervert C, Schroeder BC, Kubisch C, Berkovic SF, Propping P, Jentsch TJ, Steinlein OK. A potassium channel mutation in neonatal human epilepsy. Science. 1998;279:403–406. doi: 10.1126/science.279.5349.403. [DOI] [PubMed] [Google Scholar]
- Binshtok AM, Bean BP, Woolf CJ. Inhibition of nociceptors by TRPV1-mediated entry of impermeant sodium channel blockers. Nature. 2007;449:607–610. doi: 10.1038/nature06191. [DOI] [PubMed] [Google Scholar]
- Blackburn-Munro G, Jensen BS. The anticonvulsant retigabine attenuates nociceptive behaviours in rat models of persistent and neuropathic pain. Eur J Pharmacol. 2003;460:109–116. doi: 10.1016/s0014-2999(02)02924-2. [DOI] [PubMed] [Google Scholar]
- Brown DA, Passmore GM. Some new insights into the molecular mechanisms of pain perception. J Clin Invest. 2010;120:1380–1383. doi: 10.1172/JCI42143. [DOI] [PMC free article] [PubMed] [Google Scholar]
- Charlier C, Singh NA, Ryan SG, Lewis TB, Reus BE, Leach RJ, Leppert M. A pore mutation in a novel KQT-like potassium channel gene in an idiopathic epilepsy family. Nat Genet. 1998;18:53–55. doi: 10.1038/ng0198-53. [DOI] [PubMed] [Google Scholar]
- Crozier RA, Ajit SK, Kaftan EJ, Pausch MH. MrgD activation inhibits KCNQ/M-currents and contributes to enhanced neuronal excitability. J Neurosci. 2007;27:4492–4496. doi: 10.1523/JNEUROSCI.4932-06.2007. [DOI] [PMC free article] [PubMed] [Google Scholar]
- Delmas P, Brown DA. Pathways modulating neural KCNQ/M (Kv7) potassium channels. Nat Rev Neurosci. 2005;6:850–862. doi: 10.1038/nrn1785. [DOI] [PubMed] [Google Scholar]
- Delmas P, Coste B, Gamper N, Shapiro MS. Phosphoinositide lipid second messengers: new paradigms for calcium channel modulation. Neuron. 2005;47:179–182. doi: 10.1016/j.neuron.2005.07.001. [DOI] [PubMed] [Google Scholar]
- Emery EC, Young GT, Berrocoso EM, Chen L, McNaughton PA. HCN2 ion channels play a central role in inflammatory and neuropathic pain. Science. 2011;333:1462–1466. doi: 10.1126/science.1206243. [DOI] [PubMed] [Google Scholar]
- Etzioni A, Siloni S, Chikvashvilli D, Strulovich R, Sachyani D, Regev N, Greitzer-Antes D, Hirsch JA, Lotan I. Regulation of neuronal M-channel gating in an isoform-specific manner: functional interplay between calmodulin and syntaxin 1A. J Neurosci. 2011;31:14158–14171. doi: 10.1523/JNEUROSCI.2666-11.2011. [DOI] [PMC free article] [PubMed] [Google Scholar]
- Gamper N, Li Y, Shapiro MS. Structural requirements for differential sensitivity of KCNQ K+ channels to modulation by Ca2+/calmodulin. Mol Biol Cell. 2005a;16:3538–3551. doi: 10.1091/mbc.E04-09-0849. [DOI] [PMC free article] [PubMed] [Google Scholar]
- Gamper N, Shapiro MS. Calmodulin mediates Ca2+-dependent modulation of M-type K+ channels. J Gen Physiol. 2003;122:17–31. doi: 10.1085/jgp.200208783. [DOI] [PMC free article] [PubMed] [Google Scholar]
- Gamper N, Shapiro MS. Target-specific PIP2 signalling: how might it work? J Physiol. 2007;582:967–975. doi: 10.1113/jphysiol.2007.132787. [DOI] [PMC free article] [PubMed] [Google Scholar]
- Gamper N, Stockand JD, Shapiro MS. The use of Chinese hamster ovary (CHO) cells in the study of ion channels. J Pharmacol Toxicol Methods. 2005b;51:177–185. doi: 10.1016/j.vascn.2004.08.008. [DOI] [PubMed] [Google Scholar]
- Gamper N, Zaika O, Li Y, Martin P, Hernandez CC, Perez MR, Wang AY, Jaffe DB, Shapiro MS. Oxidative modification of M-type K+ channels as a mechanism of cytoprotective neuronal silencing. EMBO J. 2006;25:4996–5004. doi: 10.1038/sj.emboj.7601374. [DOI] [PMC free article] [PubMed] [Google Scholar]
- Gribkoff VK. The therapeutic potential of neuronal KCNQ channel modulators. Expert Opin Ther Targets. 2003;7:737–748. doi: 10.1517/14728222.7.6.737. [DOI] [PubMed] [Google Scholar]
- Gribkoff VK. The therapeutic potential of neuronal Kv7 (KCNQ) channel modulators: an update. Expert Opin Ther Targets. 2008;12:565–581. doi: 10.1517/14728222.12.5.565. [DOI] [PubMed] [Google Scholar]
- Hernandez CC, Zaika O, Tolstykh GP, Shapiro MS. Regulation of neural KCNQ channels: signalling pathways, structural motifs and functional implications. J Physiol. 2008;586:1811–1821. doi: 10.1113/jphysiol.2007.148304. [DOI] [PMC free article] [PubMed] [Google Scholar]
- Kubisch C, Schroeder BC, Friedrich T, Lutjohann B, El-Amraoui A, Marlin S, Petit C, Jentsch TJ. KCNQ4, a novel potassium channel expressed in sensory outer hair cells, is mutated in dominant deafness. Cell. 1999;96:437–446. doi: 10.1016/s0092-8674(00)80556-5. [DOI] [PubMed] [Google Scholar]
- Li Y, Gamper N, Hilgemann DW, Shapiro MS. Regulation of Kv7 (KCNQ) K+ channel open probability by phosphatidylinositol (4,5)-bisphosphate. J Neurosci. 2005;25:9825–9835. doi: 10.1523/JNEUROSCI.2597-05.2005. [DOI] [PMC free article] [PubMed] [Google Scholar]
- Linley JE, Rose K, Ooi L, Gamper N. Understanding inflammatory pain: ion channels contributing to acute and chronic nociception. Pflugers Arch. 2010;459:657–669. doi: 10.1007/s00424-010-0784-6. [DOI] [PubMed] [Google Scholar]
- Linley JE, Rose K, Patil M, Robertson B, Akopian AN, Gamper N. Inhibition of M current in sensory neurons by exogenous proteases: a signaling pathway mediating inflammatory nociception. J Neurosci. 2008;28:11240–11249. doi: 10.1523/JNEUROSCI.2297-08.2008. [DOI] [PMC free article] [PubMed] [Google Scholar]
- Liu B, Linley JE, Du X, Zhang X, Ooi L, Zhang H, Gamper N. The acute nociceptive signals induced by bradykinin in rat sensory neurons are mediated by inhibition of M-type K+ channels and activation of Ca2+-activated Cl− channels. J Clin Invest. 2010;120:1240–1252. doi: 10.1172/JCI41084. [DOI] [PMC free article] [PubMed] [Google Scholar]
- Main MJ, Cryan JE, Dupere JR, Cox B, Clare JJ, Burbidge SA. Modulation of KCNQ2/3 potassium channels by the novel anticonvulsant retigabine. Mol Pharmacol. 2000;58:253–262. doi: 10.1124/mol.58.2.253. [DOI] [PubMed] [Google Scholar]
- Mucha M, Ooi L, Linley JE, Mordaka P, Dalle C, Robertson B, Gamper N, Wood IC. Transcriptional control of KCNQ channel genes and the regulation of neuronal excitability. J Neurosci. 2010;30:13235–13245. doi: 10.1523/JNEUROSCI.1981-10.2010. [DOI] [PMC free article] [PubMed] [Google Scholar]
- Neyroud N, Tesson F, Denjoy I, Leibovici M, Donger C, Barhanin J, Faure S, Gary F, Coumel P, Petit C, Schwartz K, Guicheney P. A novel mutation in the potassium channel gene KVLQT1 causes the Jervell and Lange-Nielsen cardioauditory syndrome. Nat Genet. 1997;15:186–189. doi: 10.1038/ng0297-186. [DOI] [PubMed] [Google Scholar]
- Passmore GM, Selyanko AA, Mistry M, Al-Qatari M, Marsh SJ, Matthews EA, Dickenson AH, Brown TA, Burbidge SA, Main M, Brown DA. KCNQ/M currents in sensory neurons: significance for pain therapy. J Neurosci. 2003;23:7227–7236. doi: 10.1523/JNEUROSCI.23-18-07227.2003. [DOI] [PMC free article] [PubMed] [Google Scholar]
- Rose K, Ooi L, Dalle C, Robertson B, Wood IC, Gamper N. Transcriptional repression of the M channel subunit Kv7.2 in chronic nerve injury. Pain. 2011;152:742–754. doi: 10.1016/j.pain.2010.12.028. [DOI] [PMC free article] [PubMed] [Google Scholar]
- Schenzer A, Friedrich T, Pusch M, Saftig P, Jentsch TJ, Grotzinger J, Schwake M. Molecular determinants of KCNQ (Kv7) K+ channel sensitivity to the anticonvulsant retigabine. J Neurosci. 2005;25:5051–5060. doi: 10.1523/JNEUROSCI.0128-05.2005. [DOI] [PMC free article] [PubMed] [Google Scholar]
- Selyanko AA, Brown DA. Intracellular calcium directly inhibits potassium M channels in excised membrane patches from rat sympathetic neurons. Neuron. 1996;16:151–162. doi: 10.1016/s0896-6273(00)80032-x. [DOI] [PubMed] [Google Scholar]
- Shapiro MS, Gamper N. Regulation of neuronal ion channels by G-protein-coupled receptors in sympathetic neurons. In: Gribkoff VK, Kaczmarek LK, editors. Structure, Function and Modulation of Neuronal Voltage-Gated Ion Channels. NJ, USA: Wiley, Hoboken; 2009. pp. 291–316. [Google Scholar]
- Singh NA, Charlier C, Stauffer D, DuPont BR, Leach RJ, Melis R, Ronen GM, Bjerre I, Quattlebaum T, Murphy JV, McHarg ML, Gagnon D, Rosales TO, Peiffer A, Anderson VE, Leppert M. A novel potassium channel gene, KCNQ2, is mutated in an inherited epilepsy of newborns. Nat Genet. 1998;18:25–29. doi: 10.1038/ng0198-25. [DOI] [PubMed] [Google Scholar]
- Splawski I, Tristani-Firouzi M, Lehmann MH, Sanguinetti MC, Keating MT. Mutations in the hminK gene cause long QT syndrome and suppress IKs function. Nat Genet. 1997;17:338–340. doi: 10.1038/ng1197-338. [DOI] [PubMed] [Google Scholar]
- Suh B, Hille B. Recovery from muscarinic modulation of M current channels requires phosphatidylinositol 4,5-bisphosphate synthesis. Neuron. 2002;35:507–520. doi: 10.1016/s0896-6273(02)00790-0. [DOI] [PubMed] [Google Scholar]
- Suh BC, Inoue T, Meyer T, Hille B. Rapid chemically induced changes of PtdIns(4,5)P2 gate KCNQ ion channels. Science. 2006;314:1454–1457. doi: 10.1126/science.1131163. [DOI] [PMC free article] [PubMed] [Google Scholar]
- Tatulian L, Brown DA. Effect of the KCNQ potassium channel opener retigabine on single KCNQ2/3 channels expressed in CHO cells. J Physiol. 2003;549:57–63. doi: 10.1113/jphysiol.2003.039842. [DOI] [PMC free article] [PubMed] [Google Scholar]
- Tatulian L, Delmas P, Abogadie FC, Brown DA. Activation of expressed KCNQ potassium currents and native neuronal M- type potassium currents by the anti-convulsant drug retigabine. J Neurosci. 2001;21:5535–5545. doi: 10.1523/JNEUROSCI.21-15-05535.2001. [DOI] [PMC free article] [PubMed] [Google Scholar]
- Varnai P, Thyagarajan B, Rohacs T, Balla T. Rapidly inducible changes in phosphatidylinositol 4,5-bisphosphate levels influence multiple regulatory functions of the lipid in intact living cells. J Cell Biol. 2006;175:377–382. doi: 10.1083/jcb.200607116. [DOI] [PMC free article] [PubMed] [Google Scholar]
- Wen H, Levitan IB. Calmodulin is an auxiliary subunit of KCNQ2/3 potassium channels. J Neurosci. 2002;22:7991–8001. doi: 10.1523/JNEUROSCI.22-18-07991.2002. [DOI] [PMC free article] [PubMed] [Google Scholar]
- Wickenden AD, Yu W, Zou A, Jegla T, Wagoner PK. Retigabine, a novel anti-convulsant, enhances activation of KCNQ2/Q3 potassium channels. Mol Pharmacol. 2000;58:591–600. doi: 10.1124/mol.58.3.591. [DOI] [PubMed] [Google Scholar]
- Wuttke TV, Seebohm G, Bail S, Maljevic S, Lerche H. The new anticonvulsant retigabine favors voltage-dependent opening of the Kv7.2 (KCNQ2) channel by binding to its activation gate. Mol Pharmacol. 2005;67:1009–1017. doi: 10.1124/mol.104.010793. [DOI] [PubMed] [Google Scholar]
- Xiong Q, Sun H, Li M. Zinc pyrithione-mediated activation of voltage-gated KCNQ potassium channels rescues epileptogenic mutants. Nat Chem Biol. 2007;3:287–296. doi: 10.1038/nchembio874. [DOI] [PubMed] [Google Scholar]
- Yang WP, Levesque PC, Little WA, Conder ML, Shalaby FY, Blanar MA. KvLQT1, a voltage-gated potassium channel responsible for human cardiac arrhythmias. Proc Natl Acad Sci U S A. 1997;94:4017–4021. doi: 10.1073/pnas.94.8.4017. [DOI] [PMC free article] [PubMed] [Google Scholar]
- Zhang H, Craciun LC, Mirshahi T, Rohacs T, Lopes CM, Jin T, Logothetis DE. PIP2 activates KCNQ channels, and its hydrolysis underlies receptor-mediated inhibition of M currents. Neuron. 2003;37:963–975. doi: 10.1016/s0896-6273(03)00125-9. [DOI] [PubMed] [Google Scholar]