

Abstract
Non-technical summary
Lidocaine and bupivacaine are the most commonly used local anaesthetics in clinical practices such as neuraxial anaesthesia and local infiltration. They are known to suppress phagocytosis and the production of reactive oxygen species in immune cells. Voltage-gated proton channels are abundantly expressed in immune cells, including microglia, and play crucial roles in sustaining phagocytosis. We show that both lidocaine and bupivacaine increase the intracellular pH of microglia by their weak base properties and, consequently, inhibit proton channels. This is a novel mechanism underlying actions of local anaesthetics. Our results also indicate that the proton channel is a useful tool for monitoring the behaviours of lidocaine and bupivacaine across the cellular membrane.
Abstract
Voltage-gated proton channels play crucial roles during the respiratory burst in phagocytes, such as microglia. As local anaesthetics have a variety of anti-inflammatory properties, including inhibition of phagocytosis, they may act on the proton channels. Most local anaesthetics are tertiary amines and may affect proton channels through modification of pHi as weak bases. To test these hypotheses, the effects of lidocaine and bupivacaine on proton channels were examined in a rat microglial cell line (GMI-R1) as a function of pHo and pHi. Both lidocaine and bupivacaine reversibly decreased the current, with IC50 values of ∼1.2 and ∼0.5 mm, respectively, at pHo/pHi 7.3/5.5. The inhibition was enhanced with either pHo increase or pHi decrease, suggesting that the protonation of the base forms inside the cell contributed to the inhibitory effects. Both local anaesthetics shifted the reversal potentials to more positive voltages, indicating increases in pHi. The potencies of inhibition were correlated well with the degree of increase in pHi. The lidocaine-induced inhibition was eliminated when the pHi increases were cancelled by co-application of a weak acid, butyrate. The cytosolic alkalizations by lidocaine and bupivacaine were confirmed using a pH-sensitive fluorescent dye, BCECF, in non-voltage-clamped cells. Furthermore, chemiluminescence measurement proved that both anaesthetics inhibited production of reactive oxygen species by the cells. In conclusion, lidocaine and bupivacaine inhibit proton channels primarily by the weak base mechanism via an increase in pHi. This is a novel mechanism underlying actions of local anaesthtics.
Introduction
Microglia, immune cells of the CNS, play crucial roles in regulating inflammatory responses in various CNS disorders, including infection, ischaemia and neurodegenerative diseases, which are often accompanied by a disturbance of pH homeostasis (Streit, 1996; Liu & Hong, 2003). Activated microglia perform phagocytosis, migration and secretion of biologically active substances (Nakajima & Kohsaka, 2004). Voltage-gated proton channels are abundantly expressed in both cortical and spinal microglia (Eder et al. 1995; Morihata et al. 2000b). Recently, the molecular candidates for voltage-gated channels (HV1/VSOP channel) were cloned by Ramsey et al. (2006) and Sasaki et al. (2006). Proton extrusion through the proton channels could compensate for cytosolic acidification generated through respiratory bursts during phagocytosis (Henderson et al. 1988; reviewed by DeCoursey, 2003) and also provide substrates for the production of reactive oxygen species (ROS; H2O2, HOCl, etc.) that kill ingested microbes (Nauseef, 2007; Rada et al. 2008). In neutrophils of HV1 knock-out mice, ROS production was inhibited (Morgan et al. 2009; Ramsey et al. 2009; El Chemaly et al. 2010). Protons secreted into the extracellular space may change the ambient pH as well. Thus, the proton channels on microglia could function as one of the key modulators in inflammatory responses in the CNS.
In addition to blocking nerve conduction, local anaesthetics are now known to have a variety of anti-inflammatory actions, such as inhibition of phagocytosis in macrophages or leucocytes, decrease in adhesion of polymorphonuclear granulocytes, and reduction in platelet aggregation (Cullen & Haschke, 1974; Hu & Muscoplat, 1980; Ogata et al. 1993; Hollmann & Durieux, 2000). Local anaesthetics are weak bases with specific pKa, and therefore take a positively charged form or an uncharged base form depending on the ambient pH and the pKa. The protonation–deprotonation reaction may change the intracellular and extracellular pH. Voltage-gated proton channels are characterized by extremely high selectivity for protons and voltage- and pH-dependent activation (DeCoursey, 2003). The activity of proton channels depends primarily on the pH gradient across the plasma membrane, and weak bases have been suggested to affect the proton currents by altering the pH in unstirred layers near the membrane (DeCoursey, 2003). How local anaesthetics affect the proton channels is an issue of importance, but has not yet been examined.
Lidocaine and bupivacaine are the most commonly used local anaesthetics for regional anaesthesia, including neuraxial anaesthesia. They are tertiary amines with similar pKa at room temperature (8.0 for lidocaine and 8.2 for bupivacaine), permeable through the cell membrane as a base, and generate a cationic form inside the cell. In this process, intracellular pH is increased. It is predicted that they could inhibit proton channels that are highly sensitive to pHi. In order to test this hypothesis, we investigated the effects of lidocaine and bupivacaine on the voltage-gated proton channels in microglia. The proton channels themselves function as an intrinsic pH meter, which enabled us to evaluate the acutely induced change in the pH in the microenvironment. The data showed that the local anaesthetics increased the pHi, which led to a decrease in the proton current. The potencies of lidocaine or bupivacaine were well correlated with the increase in pHi evaluated with the reversal potential of the proton current.
Methods
Cell preparations
A rat microglia cell line (GMI-R1; Sawada et al. 1998; Salmi et al. 2002) was cultured in Eagle's minimal essential medium containing 1 ng ml−1 recombinant mouse granulocyte/macrophage colony-stimulating factor (PeproTec, London, UK), 10 ng ml−1 insulin, 10 mm glucose, 100 U ml−1 penicillin, 0.1 mg ml−1 streptomycin, 0.25 ng ml−1 amphotericin B and 10% fetal calf serum. Cells were incubated at 37°C in a 95% air–5% CO2 atmosphere. The culture medium was changed every 3–4 days. GMI-R1 cells have characteristics similar to those of microglia in primary culture (Salmi et al. 2002) and consistently exhibit voltage-gated proton channels (Morihata et al. 2000a, 2008). The proton channels share the same characteristics as those of cerebral (Eder et al. 1995; Eder & DeCoursey, 2001) and spinal microglia (Morihata et al. 2000b) in primary culture.
Solutions for electrophysiological recordings
The standard external solution contained the following (mm): 50 Hepes, 100 NMDG aspartate, 1 CaCl2 and 1 MgCl2. The pHo was adjusted to 7.3 by using CsOH. An alkaline version (pHo 8.0) was made by increasing the NMDG concentration (110 mm). A weak acid solution was prepared by replacing aspartate (100 mm) with butyrate (110 mm). The pH of the solutions was readjusted after addition of lidocaine, bupivacaine or butyrate. The pipette solutions (pHi 5.5–6.5) contained the following (mm): 120 Mes, 65 NMDG aspartate, 3 MgCl2, 1 BAPTA and 1 Na2ATP. In the solution of pHi 7.3, Hepes and EGTA were substituted for Mes and BAPTA, respectively. The osmolarities of the external and pipette solutions were measured using a freezing-point depression osmometer (OS osmometer; Fiske, Norwood, MA, USA) and were maintained between 280 and 290 mosmol l−1. Although the recordings were performed in low-Cl− external solutions, they might have been contaminated with anion currents (Morihata et al. 2000b). To minimize contamination of anion currents, 50 μm of a Cl− channel blocker, DIDS, was added to the extracellular solutions.
Electrophysiological recordings
The whole-cell recording technique was used to record proton currents. The reference electrode was an Ag–AgCl wire connected to the bath through a physiological saline–agar bridge. The liquid junction potential was corrected before formation of the gigaseal in all experiments. The pipette resistances ranged from 10 to 20 MΩ. The currents were recorded with a patch-clamp amplifier (AxoPatch 200A; Axon Instruments, Union City, CA, USA). Current signals were filtered at 5 kHz, digitized at 1–10 kHz with an analog-to-digital converter (Digidata 1200; Axon Instruments) and analysed using pCLAMP 9 software (Axon Instruments). Glass coverslips bearing microglia were placed in a recording chamber (approximately 3 ml volume), where the external solutions were perfused at a rate of 3.5–5 ml min−1 throughout the experiments. Proton currents were evoked by depolarization pulses (2–4 s) applied at a holding potential of −80 mV every 20–30 s. Local anaesthetics were added to the perfusing solutions. In some experiments, a gravity-fed U-tube system was utilized for short application of local anaesthetics on the steady-state proton currents. The U-tube was placed within 30–50 μm of the target cell. The timing and duration of each application were controlled by computer-driven solaenoid valves (General Valve, Fairfield, NJ, USA). This permitted us to exchange the external solution around the cell within 50 ms (Mori et al. 2001; Nakanishi et al. 2007). Leak currents were estimated from the linear portion of the current–voltage (I–V) relationship at voltages lower than the threshold potential for proton channels and were subtracted from the current records. All experiments were performed at room temperature (22–24°C; Kuno et al. 2009).
Data analysis
The proton currents activated by depolarization pulses were fitted with a single-exponential function after a delay, giving estimates of the steady-state currents and the activation time constant (τact). The reversal potentials (Vrev) were estimated using the repolarization-pulse method (Gordienko et al. 1996); the I–V relationships were obtained by applying 20 ms repolarization voltage ramps at the end of a 3 s depolarization pulse and at the end of a mock 10 ms depolarization pulse. The subtracted currents yielded the net I–V curves for the proton currents. Curve fittings were performed using SigmaPlot (Systat Software Inc., San Jose, CA, USA). Data are means ± SD unless described otherwise. The statistical significances (P < 0.05) were evaluated using Student's paired or unpaired t test.
Measurements of pHi in non-clamped cells
The pHi of single non-clamped cells was determined with a digital fluorescence microscope (Attoflour; Atto Instruments, Rockville, MD, USA) using a pH-sensitive fluorescent dye, 2′,7′-bis-(2-carboxyethyl)-5 (and -6) carboxyfluorescein (BCECF). Cells were plated on glass coverslips for 10Cells were plated on glass coverslips for 10–24 h and loaded with the acetoxymethylester form of BCECF (BCECF AM; 1 μm) for 30 min at 37°C. After washout of the dye, the ratios of fluorescence images (the emission wavelength ≥520 nm) excited at two wavelengths (488 and 460 nm) were measured every 10 s with 30–100 ms exposures. Data (80–120 pixels for each cell) for each illumination were averaged and plotted against time. The external solution contained the following (mm): 140 NaCl, 4 KCl, 10 Hepes, 1 CaCl2 and 1 MgCl2 (pH 7.3). To measure the lidocaine or bupivacaine-induced change in pHi at low pHi, cells were loaded with NH4Cl and then washed by the Na+-free solution. The NH4Cl solution was made by replacing NaCl with NH4Cl (40 mm), and the Na+-free solution by replacing NaCl with NMDG chloride. Calibration of pHi was carried out by dissipating pH gradient across the membrane with 10 μm nigericin in K+-rich solutions with known pH values (Grinstein & Furuya, 1988).
Measurements of ROS
Production of ROS by the cells was measured with a photon-counting luminometer (Lumat LB 9501; Berthold, Wildbad, Germany) using a chemiluminescence dye, 8-amino-5-chloro-7-phenylpyridol{3,4-d}pyridazine-1,4(2H,3H)dione (L-012). L-012 is a luminol derivative with a high sensitivity for ROS, which does not exert redox cycling by itself (Imada et al. 1999; Sohn et al. 1999). The external solution contained the following (mm): 140 NaCl, 4 KCl, 10 Hepes, 1 CaCl2 and 1 MgCl2 (pH 7.3). Cells in external solution were suspended in a glass tube at a density of 1 × 10⁶ ml−1 and incubated with 400 μm L-012 for 3 min at 37°C in the presence and absence of lidocaine or bupivacaine. Two hundred nanomolar phorbol 12-myristate 13-acetate (PMA) was added to the cells, and chemiluminescence was measured every 30 s for 15 min. Photon emission is expressed in relative light units per second (RLU s−1).
Chemicals
L-012 was purchased from Wako Pure Chemical Co. (Osaka, Japan), BAPTA and BCECF-AM from Dojindo Laboratories (Kumamoto, Japan), and all other chemicals were obtained from Sigma-Aldrich (St Louis, MO, USA). Lidocaine and bupivacaine were dissolved in the external solutions at appropriate concentrations immediately before the experiments, and then the pH of the solutions was readjusted. Concentrated stock solutions of DIDS and PMA were prepared in DMSO and that of nigericin in ethanol. The final concentrations of DMSO and ethanol were less than 0.1 and 1%, respectively, which affected neither the currents nor the cell shapes.
Results
Lidocaine and bupivacaine inhibit proton channel currents
The whole-cell proton currents in microglia (GMI-R1) were characterized as slowly activating outward currents evoked by depolarization when major ions were replaced by NMDG and aspartate and the external and internal pH were set to be 7.3 and 5.5, respectively (Morihata et al. 2000a; Fig. 1A, left panel, a). The currents were generated by depolarization pulses (0 mV, 3 s) applied from a holding potential (–80 mV) every 20 s. The steady-state amplitudes of the currents obtained by fit with a single-exponential function were decreased after application of 3 mm lidocaine into the extracellular solution, which perfused the bath for 4 min (Fig. 1A, right panel). The inhibition was maintained in the presence of lidocaine (Fig. 1Ab). The currents were recovered by the washout after a small overshoot (Fig. 1Ac and d). Both lidocaine and bupivacaine decreased the current amplitude and slowed the activation kinetics in a dose-dependent manner (Fig. 1B). In contrast, QX-314 (10 mm), a quaternary amine lidocaine derivative having a permanent positive charge, had no effect on the proton currents (Fig. 1C).
Figure 1. Effects of lidocaine and bupivacaine on proton currents in microglia.

A, representative changes in the proton currents (left panel) and the time course (right panel) by perfusing the bath with the 3 mm lidocaine-containing solution. The ordinate indicates the steady-state current amplitudes fitted with a single-exponential function (0 mV, 3 s) applied at −80 mV. B, lidocaine (left) and bupivacaine (right) decreased the proton currents in a dose-dependent manner. C, extracellular application of 10 mm QX-314 had no effect on the proton currents. pHo/pHi= 7.3/5.5.
Inhibitory effects of lidocaine at different potentials were examined on a family of currents evoked by depolarizing pulses and on the following tail currents recorded at 0 mV (Fig. 2A). Lidocaine inhibited the proton currents at all potentials tested. Semi-logarithmic dose–response curves for the steady-state currents at 0, 20 and 40 mV were fitted to the Hill equation (Fig. 2B, filled symbols). The effective concentrations to inhibit the currents to 50% of the control (IC50) were 1.24 mm at 0 mV for lidocaine (filled circles) and 0.50 mm for bupivacaine (Fig. 2B, open circles; pHo/pHi 7.3/5.5). The dose–response curves tended to shift to the right at larger potentials, but the difference was not significant. The activation time constant (τact) at 0 mV was increased in a dose-dependent manner (Fig. 2C); the increase was more marked for bupivacaine (open circles) than for lidocaine (filled circles).
Figure 2. Effects of lidocaine and bupivacaine on the proton currents at different potentials.
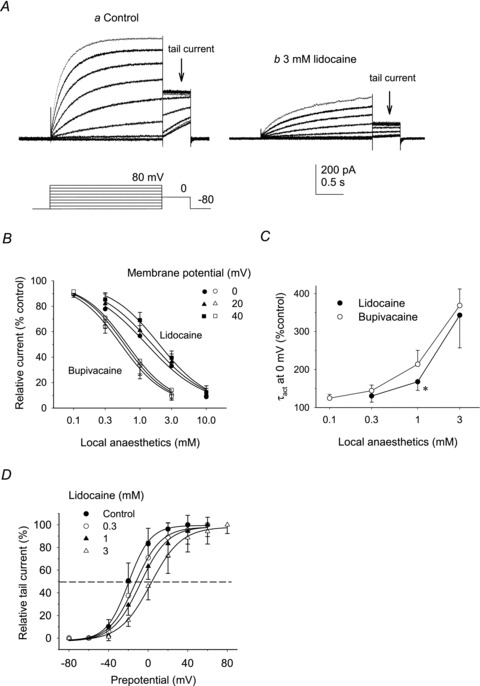
A, proton currents were evoked by depolarizing pulses in 20 mV increments applied at the holding potential of −80 mV in the absence (a) and presence of 3 mm lidocaine (b). Following the depolarizing potentials, tail currents were recorded at 0 mV. B, dose–response curves for lidocaine (filled symbols) and bupivacaine-induced changes (open symbols) of the amplitudes of steady-state currents measured at 0, 20 and 40 mV. The data are expressed as percentages of the control values (n = 4–8). Curves were fitted to the Hill equation. The IC50 values for lidocaine were 1.2 (0 mV), 1.5 (20 mV) and 1.9 mm (at 40 mV). The IC50 values for bupivacaine were 0.51 (0 mV), 0.58 (20 mV) and 0.63 mm (40 mV). pHo/pHi= 7.3/5.5. C, the averaged activation time constants (τact) at 0 mV, expressed as a percentage of the control value, were plotted against the concentrations: for lidocaine (filled circles), 130 ± 16 (0.3 mm), 170 ± 23 (1 mm) and 340 ± 86% (3 mm; n = 5); and for bupivacaine (open circles), 120 ± 10 (0.1 mm), 140 ± 15 (0.3 mm), 210 ± 37 (1 mm) and 370 ± 44% (3 mm; n = 5). Data are compared between lidocaine and bupivacaine at the same concentration. *P < 0.05. D, voltage dependence of the steady-state proton currents. Relative tail currents, normalized by the maximal values, were plotted against prepotentials (n = 5–7). Curves are fits by the Boltzmann equation. Lidocaine shifted the activation curve to more positive voltages in a dose-dependent manner. Half-activation voltages (V0.5) were −20.1 (control), −13.1 (0.3 mm), −8.1 (1 mm) and 2.5 mV (3 mm). Data are means ± SD.
Effects of lidocaine on the voltage dependence of activation were examined from tail currents recorded at 0 mV. Tail currents were normalized to the maximal value for each condition and averaged. The relative amplitudes of tail currents plotted as a function of prepotentials were fitted by the Boltzmann equation (Fig. 2D). Lidocaine shifted the activation curves of the steady-state proton currents in a positive direction in a dose-dependent manner. The half-activation voltage (V0.5) was shifted from −20 mV in control condition (filled circles) to 2.5 mV by 3 mm lidocaine (open triangles).
pH dependence of lidocaine-induced inhibition of proton channels
Extracellular acidification and alkalization alter the ratio of the charged and uncharged forms of lidocaine, which might modify its inhibitory actions. The effects of pHo on the lidocaine-induced inhibition of the proton currents were examined using the U-tube system because cells hardly survived in alkaline solutions (Fig. 3A). Solutions of different pH, with or without lidocaine (3 mm), were applied onto a cell for 5 s after the current reached the steady state. In the absence of lidocaine, the neutral solution (pHo 7.0) decreased the proton current and the alkaline solution (pHo 8.0) increased it (Fig. 3A, left and right, control). Addition of lidocaine (3 mm) decreased the current to 55% of the value right before lidocaine application at pHo 7.0 (Fig. 3A, left), to 45% of the value right before lidocaine application at pHo 7.3 (Fig. 3A, middle) and to 33% of the control value at pHo 8.0 (Fig. 3A, right). The inhibition was significantly greater at pHo 8.0 and smaller at pHo 7.0 than that observed in the same cell at pHo 7.3 (Fig. 3B). In contrast, elevated pHi would suppress protonation of lidocaine inside the cells. The driving force for H+ flux depends on the pH gradient and the membrane potential. The effects of lidocaine at higher pHi (6.5–7.3) were examined on the proton currents at 100 mV (Fig. 3C); at this potential, the driving force at pHi 7.3 was close to that for the currents at 0 mV at pHi 5.5. Lidocaine (10 mm) decreased the steady-state currents to 56 ± 15% of that of the control cells at pHi 6.5 (n = 4) and 71 ± 10% at pHi 7.3 (n = 3). The inhibition was decreased significantly by increases in pHi (Fig. 3D).
Figure 3. Effects of pHo and pHi on the lidocaine-induced inhibition of the proton currents.

A, effects of the neutral (pHo= 7.0, left) and alkaline external solutions (pHo= 8.0, right) on the 3 mm lidocaine-induced inhibition of proton currents activated by depolarization pulses (0 mV) applied at −80 mV. The external solutions with and without lidocaine were applied using the U-tube method. B, steady-state currents in the presence of lidocaine (3 mm) at pHo 7.0, 7.3 or 8.0 in the same cells are expressed as a percentage of the control values (n = 3). C, 10 mm lidocaine-induced inhibition of the proton currents at pHi 5.5, 6.5 and 7.3. The pHo was constant (7.3). The currents were evoked by depolarization pulses (0 mV for pHi 5.5 and 100 mV for pHi 6.5 and 7.3). The holding potentials were −80 mV for pHi 5.5 and −60 mV for pHi 6.5 and 7.3. D, steady-state currents in the presence of lidocaine (10 mm) at pHi 5.5 (9 ± 7%, n = 4), pHi 6.5 (56 ± 15%, n = 4) and pHi 7.3 (71 ± 10%, n = 3). Data are means ± SD. *P < 0.05. **P < 0.01. ***P < 0.001.
These pH dependences described above suggested that the weak base mechanism underlay the inhibitory effects of lidocaine on proton channels. Local anaesthetics permeate the membrane as the uncharged basic form, become protonated inside the cell and, consequently, increase pHi (Narahashi et al. 1970).
Lidocaine- and bupivacaine-induced changes in the intracellular pH monitored by the proton channel currents
Protonation of lidocaine inside the cells could elevate the pHi. We evaluated the changes in pHi in cells exposed to lidocaine. As the proton channels are highly selective for protons, we could monitor the change in the pH gradient across the membrane from its reversal potential (Vrev). The Vrev values were obtained from the I–V relationships employing the repolarization-pulse method (see Methods). The value of Vrev in control cells was linearly correlated with pHi when the pHo (7.3) was kept constant by the continuous perfusion of the extracellular solution (Fig. 4A, continuous line); the Vrev was shifted by 52.3 mV by elevating pHi by one unit, corresponding closely to the value estimated from the Nernst equation (58 mV (pH unit)-1; Fig. 4A, dashed line). The I–V relationships obtained before and after addition of 3 mm lidocaine showed that the reduction of the current amplitude by lidocaine was accompanied by the shift of Vrev to a more positive direction (Fig. 4B, arrows), indicating that pHi was elevated by lidocaine. The ΔVrev was dose dependent for both lidocaine and bupivacaine (Fig. 4C). The ΔVrev was significantly greater for bupivacaine (open columns) than for lidocaine (fille columns) when the values were compared at the same concentrations. In contrast, QX-314 (10 mm), having no effect on proton currents as shown in Fig. 1C, did not change Vrev (Fig. 4C, rightmost, arrowhead). The degree of inhibition of proton current was well correlated with ΔVrev for both lidocaine (filled circles) and bupivacaine (open circles; correlation coefficient, r2 > 0.95; Fig. 4D). The increase in pHi was calculated from the ΔVrev according to the Nernst equation (Fig. 4C, right ordinate); for example, pHi was elevated by ∼0.5 pH unit with 3 mm lidocaine and ∼0.7 pH unit with 3 mm bupivacaine.
Figure 4. The shifts of the reversal potentials (ΔVrev) induced by lidocaine.

A, the relationship between Vrev and pHi in the absence of local anaesthetics. The Vrev values were estimated from the I–V relationships obtained by the repolarization-pulse method. The continuous line shows the linear regression curve for the mean values (n = 7–26), with a slope of 52.3 mV (pH unit)-1, which was close to the Nernst equation (dashed line). The pHo was 7.3. B, the I–V relationships obtained from the repolarization ramp pulses applied at the end of depolarizations in a cell, in control conditions (filled symbols) and after addition of 3 mm lidocaine (open symbols). The values of Vrev are indicated by arrows. C, ΔVrev induced by lidocaine (filled columns), bupivacaine (open columns) and QX-314 (arrow). The right ordinate represents pHi increases estimated from ΔVrev (n = 4–7). D, the relationships between the inhibition (%) of proton currents and ΔVrev. The inhibition correlated well with the ΔVrev. The continuous line is the linear regression for the mean values (correlation coefficient, r2 > 0.95). E, lidocaine (1, 3 and 10 mm) was applied on the steady-state currents for 5 s using the U-tube system. The I–V curves were obtained immediately before (arrow 1, filled circles) and 4 s after the addition of lidocaine (arrow 2, open circles). F, ΔVrev, obtained from the difference between the Vrev at arrow 1 and arrow 2 (Vrev2–Vrev1) for control conditions (left column) and in the presence of 3 mm lidocaine (middle column; n = 7). The right column represents the data obtained using the bath application method where the proton currents were exposed to lidocaine for >3 min (n = 8). Data are means ± SD. *P < 0.05. pHo/pHi= 7.3/5.5.
The Vrev shift (ΔVrev) was also measured employing the U-tube method. Lidocaine (1, 3 or 10 mm) was applied from the U-tube. The current was decreased in a dose-dependent manner (Fig. 4E, inset). To evaluate Vrev, 20 ms repolarizing voltage ramps were applied immediately before (Fig. 4E, arrow 1, Vrev1) and at 4 s during the application (Fig. 4E, arrow 2, Vrev2). The I–V relationship shifted to more positive potentials in a dose-dependent manner during exposure to lidocaine (Fig. 4E). The ΔVrev (Vrev2–Vrev1) in control conditions and with 3 mm lidocaine are summarized in Fig. 4F. Even in the control conditions, there was a slight positive shift in Vrev (left column), probably due to a slowly developing depletion of intracellular protons produced by proton efflux through the channels (the phenomenon known as ‘droop’; DeCoursey, 2003). The ΔVrev due to droop might be decreased in the presence of lidocaine because of the reduced proton efflux. The ΔVrev values obtained by the U-tube method were not significantly different from those obtained by the bath perfusion method (Fig. 4F, right column), suggesting that the lidocaine-induced shift of Vrev was attained within a few seconds.
Weak acid eliminates lidocaine-induced inhibition of the proton channels
Increases in pHi that resulted from protonation of intracellular local anaesthetics were likely to mediate inhibition of the proton channels. To confirm this, we tested the effects of lidocaine on the proton channels in conditions where the lidocaine-induced pH changes were cancelled by a permeable weak acid, butyrate, which decreases pHi. On the basis of pKa (4.8), the concentration of butyrate required to cancel the pHi changes evoked by lidocaine was estimated. With pHo/pHi 6.8/6.0, the cytosolic concentration of the charged form of lidocaine (2–3 mm in the extracellular solution) was calculated to be 12–18 mm, and that of uncharged form of butyrate (110 mm in the extracellular solution) was 17 mm. In practice, the pHi change was abolished when 2 mm lidocaine and 110 mm butyrate were applied together at pHo/pHi of 6.8/6.0. Lidocaine alone decreased the proton current (Fig. 5Ac and B, top panel) and butyrate alone increased it (Fig. 5Ad and B, top panel). When they were applied together, the current remained unchanged (Fig. 5Ab and B, top panel). The value of Vrev was shifted in a positive direction by lidocaine, in a negative direction by butyrate, and remained unchanged by the co-application (Fig. 5B, bottom panel).
Figure 5. The effects of simultaneous application of lidocaine and butyrate.

A, compared with the control current in standard external solution (a), the external application of lidocaine (2 mm) decreased the proton current (c). The external solution containing butyrate (110 mm) as an alternative for aspartate increased the current (d). When butyrate and lidocaine were applied together, the current remained unchanged (b). B, current normalized to the value of control (top panel) and relevant Vrev in each condition (bottom panel) are plotted. Butyrate solution containing lidocaine affected neither Vrev nor proton currents. Data are means ± SD (n = 4 for each). *P < 0.05, **P < 0.01 compared with control; and #P < 0.05, ##P < 0.01 compared with lidocaine + butyrate. pHo/pHi= 6.8/6.0.
The standard pipette solution contained a high concentration of pH buffer (120 mm Mes), which might affect changes in pHi induced by local anaesthetics. We examined the lidocaine-induced inhibition of the proton current at a pipette concentration of 20 mm Mes. The ΔVrev and the inhibition in proton current increased significantly compared with those at a pipette concentration of 120 mm Mes (Fig. 6A and B).
Figure 6. The effects of intracellular buffer on the lidocaine-induced inhibition of the proton currents.
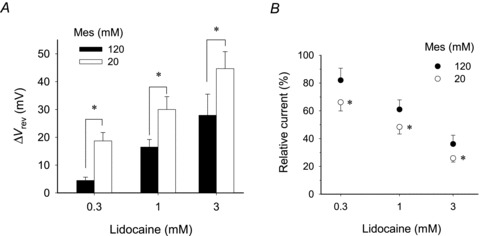
A, lidocaine-induced ΔVrev at 20 mm Mes, a pH buffer, in the pipette (open columns), was compared with that at 120 mm Mes (filled columns). At 20 mm, ΔVrev values were 19 ± 3 (0.3 mm), 30 ± 5 (1 mm) and 45 ± 6 mV (3 mm; n = 4), which were significantly larger than those at 120 mm. B, relative current amplitudes in the presence of lidocaine at 20 and 120 mm Mes. The steady-state current amplitudes at depolarization pulse (40 mV) were normalized by the value of each control. Relative current: at 120 mm, 82 ± 9 (0.3 mm), 61 ± 7 (1 mm) and 36 ± 6% (3 mm; n = 4–8); and at 20 mm 66 ± 6 (0.3 mm), 48 ± 5 (1 mm) and 26 ± 3% (3 mm; n = 4). Data are means ± SD. *P < 0.05 compared with 120 mm.
The increase in pHi by lidocaine and bupivacaine in non-voltage-clamped cells
We examined the effects of lidocaine and bupivacaine on the pHi in non-voltage clamped cells using a pH-sensitive fluorescence dye (BCECF; Fig. 7). The pHi of resting cells was 7.26 ± 0.11 (mean ± SEM, n = 28). To compare the results with those of the whole-cell recordings (pHi∼5.5), the cells were acidified by washout of preloaded NH4Cl (40 mm) with a Na+-free, K+-free, NMDG-containing solution. The extracellular solution eliminated the action of Na+–H+ exchangers and induced hyperpolarization to block activation of the proton channels, so that pHi change produced by intracellular protonation by local anaesthetics could be detected. Both lidocaine (3 mm) and bupivacaine (3 mm) increased pHi (Fig. 7A). There was no significant difference in the pHi change between the two anaesthetics; from 5.51 ± 0.07 to 5.96 ± 0.07 (n = 28) for lidocaine and from 5.52 ± 0.07 to 5.99 ± 0.08 for bupivacaine (n = 28). The pHi increase was more marked with 10 mm lidocaine (Fig. 7B).
Figure 7. Lidocaine- and bupivacaine-induced changes in pHi in non-clamped cells.

A, the averaged time courses of the changes in pHi measured using BCECF (n = 28). Cell acidosis was generated by washout of preloaded NH4Cl (40 mm) by the Na+-free, NMDG-containing solutions. B, the lidocaine- and bupivacaine-induced increases in pHi measured with BCECF. The increases in pHi in non-clamped cells: for lidocaine, 0.45 ± 0.07 (3 mm) and 1.23 ± 0.17 (10 mm, n = 25); and for bupivacaine, 0.47 ± 0.07 (3 mm). Data are means ± SEM.
Lidocaine and bupivacaine also increased pHi in the Na+-containing solution without forced acidification (Fig. 8D, open triangles, and E). The initial increase was followed by a gradual decay during the exposure. There was no significant difference in the pHi change between the two anaesthetics. The pHi increases were smaller than those at pHi∼5.5, but the dose dependences at different pHi levels were similar.
Figure 8. Effects of lidocaine and bupivacaine on production of reactive oxygen species (ROS).

A, representative time courses of ROS production measured by chemilluminescence in the absence and presence of lidocaine. Lidocaine suppressed the ROS production in a dose-dependent manner. B, the peak values of chemilluminescence in the absence and presence of lidocaine or bupivacaine were expressed as relative light units per second (RLU s−1) Data are means ± SD (n = 5 for each). *P < 0.05 comparing lidocaine with bupivacaine. C and D, 200 nm PMA-induced changes in the absence (C; n = 14–18) and presence of 10 mm lidocaine (D; n = 16–31). Open symbols represent data without PMA stimulation. The initial increase in pHi induced by lidocaine decayed slightly both in the absence and presence of PMA. E, the lidocaine- and bupivacaine-induced peak increases in pHi (n = 14–31). F, the effects of lidocaine on PMA-induced changes in pHi. The pHi was measured immediately before and 8 min after the addition of PMA in each cell. The pHi changes during 8 min were averaged (n = 14–31). In the presence of lidociane, PMA was added at the initial rise in pHi. Open symbols represent the data in the absence of PMA. Data are means ± SEM. *P < 0.05. In C–F, pHi was measured with BCECF in the same conditions as those in A and B.
Lidocaine and bupivacaine inhibit ROS production
Local anaesthetics have been reported to suppress phagocytosis and production of ROS in phagocytes, such as macrophages and neutrophils (Peck et al. 1985; Hattori et al. 1997; Mikawa et al. 1997; Hollmann & Durieux, 2000). However, the effects of local anaesthetics on microglial phagocytic function remain unknown. We examined the effects of lidocaine and bupivacaine on ROS production by chemiluminescence measurement. Addition of 200 nm PMA, a stimulator of superoxide formation (Ruuls et al. 1995), increased chemiluminescence markedly (Fig. 8A, control). Both lidocaine and bupivacaine suppressed chemiluminescence in a dose-dependent manner (Fig. 8B). Three and 10 mm lidocaine decreased the peak value of chemiluminescence to 43 and 7% of the control value, respectively. At 3 mm, bupivacaine was more potent than lidocaine in inhibiting ROS production.
The PMA-induced changes in pHi were measured with BCECF in the same conditions as used for the chemiluminescence measurement. The PMA (200 nm) increased pHi slightly (Fig. 8C), which is consistent with findings in neutrophils (El Chemaly et al. 2010) and microglia (Liu et al. 2010). In the presence of lidocaine, PMA did not affect the pHi responses (Fig. 8D). Changes in pHi measured 8 min after stimulation with PMA are summarized in Fig. 8F.
Discussion
Local anaesthetics are some of the most commonly used and clinically important drugs. The present study is the first to show that lidocaine and bupivacaine inhibit the voltage-gated proton channels in microglia. This is a novel mechanism underlying a variety of cellular responses observed upon application of local anaesthetics. The specific feature of proton channels, their extremely high selectivity for protons, enabled us to investigate the behaviours of local anaesthetics as weak bases inside and outside the cell membrane.
Weak base mechanisms underlying the inhibition of proton channels by local anaesthetics
The whole-cell recordings provide evidence that the inhibitory effects of lidocaine and bupivacaine on the proton channels can be explained mainly by the increase in pHi, which decreases the driving force for proton efflux and shifts the voltage dependence for activation to more positive potentials. Application of a weak acid, butyrate, in combination with lidocaine abolished the shift of Vrev and caused no change in proton currents (Fig. 5A and B). This result suggests strongly that the inhibitory effects of local anaesthetics on proton channels are due to increases in pHi. Lidocaine and bupivacaine are weak bases with similar pKa at room temperature (8.0 for lidocaine and 8.2 for bupivacaine; Sanchez et al. 1987; Strichartz et al. 1990). As with other weak bases, after permeation through the membrane, the uncharged base forms can be partly protonated to become the positively charged forms, which depletes protons in the microenvironment and hence increases the local pH (DeCoursey, 2003). Weak base mechanisms were also supported by several findings. First, the lidocaine-induced inhibition of the currents was potentiated by extracellular alkalinization, which increased the cell-permeable base forms, and it was reduced by increasing pHi, which might prevent protonation of lidocaine inside the cells. These results indicate that permeation through the plasma membrane and intracellular protonation are essential for the inhibitory effects of lidocaine. Second, QX-314, a permanently charged lidocaine derivative, had no effect on the proton currents and did not shift Vrev when it was applied extracellularly. The charged form could not pass the membranes easily.
Local anaesthetics inhibit several species of voltage-gated ion channels, among which voltage-gated sodium channels have been studied extensively. To block sodium channels, local anaesthetics have to permeate through the cellular membrane in the base form and then be protonated inside the cells. The positively charged molecules bind to the inside of the channel pore to block the sodium channels (Frazier et al. 1970; Narahashi et al. 1970; Hille, 1977; Ragsdale et al. 1994). Concentrations of lidocaine and bupivacaine to inhibit the proton channels were relatively high compared with those for blocking the sodium channels. There was no evidence for direct interactions between the proton channels and local anaesthetics, at least for their acute action. It is noted that molecular candidates for the voltage-gated proton channels lack the pore domain (Ramsey et al. 2006; Sasaki et al. 2006). This distinct feature of molecular structure might be related to the difference in the inhibitory mechanisms between sodium channels and proton channels.
Applications of lidocaine using the U-tube method revealed that the lidocaine-induced pHi increase was accomplished within a few seconds. As the base and the protonated forms of lidocaine equilibrate very rapidly (equilibration time constant = 300 μs at pH 7.0; Hille, 2001), lidocaine diffuses through an unstirred layer near the membrane and permeates through the membrane in seconds.
Can proton channels monitor protonation of local anaesthetics?
In the present study, we estimated the change in pHi from the Vrev of proton channels in voltage-clamped cells. We verified this method as follows. The local anaesthetics could be concentrated inside the cell according to the ambient pH and pKa (Narahashi et al. 1970). The ratio of the charged form to the uncharged form of a tertiary amine local anaesthetic is given by the following equation:
where {BH+} and {B} are the concentrations of charged and uncharged forms, respectively. The distribution of charged and uncharged forms of a tertiary amine local anaesthetic in external and internal phases of the cellular membrane can be calculated from this equation if one assumes that only the uncharged form is freely permeable through the cellular membrane. Figure 9A represents an example, when 3 mm lidoacine is applied to the bath solution at pHo 7.3; the uncharged form, which will reach a concentration of 0.5 mm due to its pKa (8.0), passes the membrane and equilibrates across it. As 3 mm lidocaine is estimated to increase pHi from 5.5 to 6.0 (see Fig. 4C), the intracellular charged form will become 50 mm. Then the total internal concentration will be 50.5 mm. We calculated the total intracellular concentrations of lidocaine at each equilibrated pHi estimated from the Vrev. Then, the increases of pHi were plotted against the estimated intacellular concentration (Fig. 9B, filled circles). For comparison, the pipette solution was titrated with lidocaine and NaOH in a test tube using the pH meter. Alkaline titration of the pipette solutions with bupivacaine could not be performed because of insolubility of the base form. The increases in pH were plotted against the concentrations of lidocaine or NaOH (Fig. 9C). Interestingly, the titration curves for lidocaine and NaOH were identical and almost overlapped with that estimated from the Vrev. This indicates that the increase of pHi by protonation of lidocaine inside the cells could be monitored by the Vrev accurately, which strengthens our hypothesis that the weak base mechanism underlies the lidocaine-induced inhibition of the proton channels.
Figure 9. Weak base mechanisms underlying pHi increases by local anaesthetics.

A, an example of the distribution of charged and uncharged base forms of lidocaine across the plasma membrane. Intracellular concentrations of each form are calculated according to the pKa and pHo/pHi. In the case where 3 mm lidocaine is applied extracellularly at pHo 7.3, the uncharged form of intracellular and extracellular lidocaine is equilibrated at 0.5 mm. If pHi increases by ∼0.5 (from 5.5 to 6.0), the total intracellular concentration of lidocaine is estimated to be ∼50.5 mm. B, the lidocaine (closed circles)- and bupivacaine (open circles)-induced increases in pHi obtained from patch-clamp recordings (pHo/pHi 7.3/5.5) are plotted against the intracellular concentrations estimated as shown in A (n = 4–7). The pHi was calculated from the Vrev values. *P < 0.05 compared between lidocaine and bupivacaine at the same extracellular concentration. C, titration curves of the pipette solution (pH 5.5) with lidocaine (filled sqaures) and NaOH (open squares; n = 3 for each). These titration curves almost overlapped with the plot estimated from the patch-clamp studies (filled circles; the same data as shown in B). Data are means ± SD.
The lidocaine-induced increases in pHi and the resultant decreases in proton currents were enhanced by lowering the concentration of Mes, a pH buffer in the pipette solution. Thus, the intracellular buffering action could modify the extent of the inhibition of lidocaine. The buffering capacity of the pipette solution (120 mm Mes, pH 5.5), estimated from titration with NaOH, was ∼80 mm (pH unit)-1 (Fig. 9C, open squares). The intrinsic buffering capacity of cytoplasm is reported to be 20–70 mm (pH unit)-1 (Roos & Boron, 1981), but is not known for microglia. The inhibitory effect of local anaesthetics on proton currents might be modified in intact cells and might increase if the cytosolic buffering capacity is lower than that of pipette solutions.
The effects of local anaesthetics on pHi in voltage-clamped and non-voltage-clamped cells
We examined the pHi change caused by local anaesthetics in intact cells using BCECF in conditions that eliminated proton efflux mediated by the Na+–H+ exchangers and the voltage-gated proton channels. There was no significant difference in the pHi increases induced by lidocaine (3 mm) measured by BCECF and the ΔVrev. Onizuka et al. (2008) reported that lidocaine and bupivacaine increased the pHi in intact snail neurons by measurement with BCECF (pHo 8.0); the increases in pHi are higher than those measured in the present study. However, as the extracellular medium contained Na+, the large pH increases might be mixed results of intracellular ion trapping (protonation of the base form of lidocaine) and proton extrusion through the Na+–H+ exchanger (Vinnikova et al. 2004; Onizuka et al. 2008). The present recording conditions seem to be suitable to evaluate pHi increase due to protonation by local anaesthetics.
There was no significant difference in the pHi increases measured by BCECF between lidocaine and bupivacaine (Fig. 7), as suspected from their similar pKa values. However, the pHi increase calculated from the Vrev was significantly larger for bupivacaine than for lidocaine (Figs 4C and 9B). The reason for the discrepancy between the fluorometric and electrophysiological measurements is not clear. It should be noted that bupivacaine inhibited the proton channels more potently than lidocaine; the amount of ΔVrev was well proportional to the inhibitory effect of local anaesthetics (Fig. 4D). As bupivacaine is highly lipophilic (Strichartz et al. 1990), it could be distributed more closely to the inner surface of the membrane or accumulated in the lipid bilayer. Changes in the local pH, which affect the proton channels, might not be detected fully by BCECF.
Pathophysiological implications
We have provided the first evidence that lidocaine and bupivacaine inhibited PMA-induced ROS production of microglia. Many studies have reported the inhibition of ROS production by local anaesthetics in neutrophils (Peck et al. 1985; Hattori et al. 1997; Mikawa et al. 1997; Arakawa et al. 2001; Hollmann et al. 2001). The effective concentrations vary greatly; 15 μm lidocaine suppresses the ROS production of neutrophils activated by opsonized zymosan to 40% of control values (Arakawa et al. 2001) and several millimolar lidocaine (a similar dose to that used in the present study), by 50%, in cells stimulated with PMA (Hattori et al. 1997). It seems that the mechanisms underlying the inhibitory effects of local anaesthetics on ROS production vary depending on cell conditions and the type of stimulation. Although NADPH oxidases themselves have a pHi dependence (Morgan et al. 2005), the effect of the pHi increase by ∼0.2 on the enzyme activity seems to be slight, if any. Thus, it is not likely that the weak base mechanism accounts for all of the inhibitory effects of local anaesthetics. Several mechanisms may be involved in inhibition of ROS production by local anaesthetics.
Proton channels are considered to compensate for the pH and voltage disturbances produced by the electron transfer via the activated NADPH oxidases (Henderson et al. 1988; Lukacs et al. 1993; Morgan et al. 2009; Ramsey et al. 2009; El Chemaly et al. 2010). Recently, El Chemaly et al. (2010) reported that Hv1 proton channels sustain ROS production and loss of them aborts ROS production due to an increased cell depolarization induced by the oxidase. In the present study, lidocaine inhibited both ROS production and pHi increases by PMA at a similar dose to that for inhibition of the proton channels. However, there was no evidence that the effects of local anaesthetics on proton channels are linked to the inhibition of ROS production.
The concentrations of local anaesthetics in clinical practice at the site of injection reach levels similar to or higher than those used in this study. For example, usually up to 2% lidocaine (74 mm) solutions are applied to wounds or in dental anaesthesia. In spinal anaesthesia, 37–185 mm lidocaine or 8–23 mm bupivacaine are injected into the subarachnoid space; the final concentrations in cerebrospinal fluid were reported to become >10 and 1 mm, respectively (van Zandert et al. 1996; Ruppen et al. 2009). The present study showed that lidocaine-induced inhibition of the proton channels was potentiated at low pHi. Pathological states might be accompanied by cell acidosis. Morgan et al. (2009) reported that, in neutrophils, pHi decreased to <pH 6.5 during phagocytosis if the pH recovery systems were not functional. Although local concentrations of local anaesthetics and ambient pH in the tissue are unknown in most cases, the conditions for the inhibition of the proton channels are not too far from clinical states we encounter.
In conclusion, the present study revealed that lidocaine or bupivacaine inhibited proton channels in microglia through the weak base mechanism. The extent of the inhibition depends on the conditions (the local concentrations and the ambient pH, that is, pHo and pHi). The results also indicate that proton channels could be a useful tool to quantify protonation of local anaesthetics inside cells.
Acknowledgments
We would like to thank Y. Kira and Y. Yabunaka (Central Laboratory of Osaka City Medical School) for technical assistance. This work was supported in part by a grant-in-aid for scientific research (21592022) from the Japan Society for the Promotion of Science, Tokyo, Japan.
Glossary
Abbreviations
- PMA
phorbol 12-myristate 13-acetate
- RLU
relative light unit
- ROS
reactive oxygen species
- τact
activation time constant
- V0.5
half-activation voltage
- Vrev
reversal potential
Author contributions
Conception and design of experiments: T.Mo., M.K., T.Ma. and A.A. Collection, analysis and interpretation of data: T.Ma., M.H., J.K., K.N. and T.N. Cell preparation and culture: J.K. and M.S. Drafting and revising of the manuscript: T.Ma., T.Mo. and M.K. All authors have read and approved the final of the version of the manuscript. This study was performed at the Department of Anaesthesiology, Osaka City University Graduate School of Medicine, Osaka, Japan.
References
- Arakawa K, Takahashi H, Nakagawa S, Ogawa S. The effects of lidocaine on superoxide production and p47 Phox translocation in opsonized zymosan-activated neutrophils. Anesth Analg. 2001;93:1501–1506. doi: 10.1097/00000539-200112000-00032. [DOI] [PubMed] [Google Scholar]
- Cullen BF, Haschke RH. Local anesthetic inhibition of phagocytosis and metabolism of human leukocytes. Anesthesiology. 1974;40:142–146. doi: 10.1097/00000542-197402000-00009. [DOI] [PubMed] [Google Scholar]
- DeCoursey TE. Voltage-gated proton channels and other proton transfer pathways. Physiol Rev. 2003;83:475–579. doi: 10.1152/physrev.00028.2002. [DOI] [PubMed] [Google Scholar]
- Eder C, DeCoursey TE. Voltage-gated proton channels in microglia. Prog Neurobiol. 2001;64:277–305. doi: 10.1016/s0301-0082(00)00062-9. [DOI] [PubMed] [Google Scholar]
- Eder C, Fischer HG, Hadding U, Heinemann U. Properties of voltage-gated currents of microglia developed using macrophage colony-stimulating factor. Pflugers Arch. 1995;430:526–533. doi: 10.1007/BF00373889. [DOI] [PubMed] [Google Scholar]
- El Chemaly A, Okochi Y, Sasaki M, Arnaudeau S, Okamura Y, Demaurex N. VSOP/Hv1 proton channels sustain calcium entry, neutrophil migration, and superoxide production by limiting cell depolarization and acidification. J Exp Med. 2010;207:129–139. doi: 10.1084/jem.20091837. [DOI] [PMC free article] [PubMed] [Google Scholar]
- Frazier DT, Narahashi T, Yamada M. The site of action and active form of local anesthetics. II. Experiments with quaternary compounds. J Pharmacol Exp Ther. 1970;171:45–51. [PubMed] [Google Scholar]
- Gordienko DV, Tare M, Parveen S, Fenech CJ, Robinson C, Bolton TB. Voltage-activated proton current in eosinophils from human blood. J Physiol. 1996;496:299–316. doi: 10.1113/jphysiol.1996.sp021686. [DOI] [PMC free article] [PubMed] [Google Scholar]
- Grinstein S, Furuya W. Assessment of Na+-H+ exchange activity in phagosomal membranes of human neutrophils. Am J Physiol Cell Physiol. 1988;254:C272–C285. doi: 10.1152/ajpcell.1988.254.2.C272. [DOI] [PubMed] [Google Scholar]
- Hattori M, Dohi S, Nozaki M, Niwa M, Shimonaka H. The inhibitory effects of local anesthetics on superoxide generation of neutrophils correlate with their partition coefficients. Anesth Analg. 1997;84:405–412. doi: 10.1097/00000539-199702000-00031. [DOI] [PubMed] [Google Scholar]
- Henderson LM, Chappell JB, Jones OT. Internal pH changes associated with the activity of NADPH oxidase of human neutrophils. Further evidence for the presence of an H+ conducting channel. Biochem J. 1988;251:563–567. doi: 10.1042/bj2510563. [DOI] [PMC free article] [PubMed] [Google Scholar]
- Hille B. Local anesthetics: hydrophilic and hydrophobic pathways for the drug-receptor reaction. J Gen Physiol. 1977;69:497–515. doi: 10.1085/jgp.69.4.497. [DOI] [PMC free article] [PubMed] [Google Scholar]
- Hille B. Ion Channels of Excitable Membranes. Sunderland, MA: Sinauer Associates, Inc; 2001. [Google Scholar]
- Hollmann MW, Durieux ME. Local anesthetics and the inflammatory response: a new therapeutic indication? Anesthesiology. 2000;93:858–875. doi: 10.1097/00000542-200009000-00038. [DOI] [PubMed] [Google Scholar]
- Hollmann MW, Gross A, Jelacin N, Durieux ME. Local anesthetic effects on priming and activation of human neutrophils. Anesthesiology. 2001;95:113–122. doi: 10.1097/00000542-200107000-00021. [DOI] [PubMed] [Google Scholar]
- Hu WS, Muscoplat CC. Lidocaine: effect on phagocytosis and purification of monocytes in bovine peripheral blood. Am J Vet Res. 1980;41:447–449. [PubMed] [Google Scholar]
- Imada I, Sato EF, Miyamoto M, Ichimori Y, Minamiyama Y, Konaka R, Inoue M. Analysis of reactive oxygen species generated by neutrophils using a chemiluminescence probe L-012. Anal Biochem. 1999;271:53–58. doi: 10.1006/abio.1999.4107. [DOI] [PubMed] [Google Scholar]
- Kuno M, Ando H, Morihata H, Sakai H, Mori H, Sawada M, Oiki S. Temperature dependence of proton permeation through a voltage-gated proton channel. J Gen Physiol. 2009;134:191–205. doi: 10.1085/jgp.200910213. [DOI] [PMC free article] [PubMed] [Google Scholar]
- Liu B, Hong JS. Role of microglia in inflammation-mediated neurodegenerative diseases: mechanisms and strategies for therapeutic intervention. J Pharmacol Exp Ther. 2003;304:1–7. doi: 10.1124/jpet.102.035048. [DOI] [PubMed] [Google Scholar]
- Liu Y, Kintner DB, Chanana V, Algharabli J, Chen X, Gao Y, Chen J, Ferrazzano P, Olson JK, Sun D. Activation of microglia depends on Na+/H+ exchange-mediated H+ homeostasis. J Neurosci. 2010;30:15210–15220. doi: 10.1523/JNEUROSCI.3950-10.2010. [DOI] [PMC free article] [PubMed] [Google Scholar]
- Lukacs GL, Kapus A, Nanda A, Romanek R, Grinstein S. Proton conductance of the plasma membrane: properties, regulation, and functional role. Am J Physiol Cell Physiol. 1993;265:C3–C14. doi: 10.1152/ajpcell.1993.265.1.C3. [DOI] [PubMed] [Google Scholar]
- Mikawa K, Akamatsu H, Nishina K, Shiga M, Maekawa N, Obara H, Niwa Y. Inhibitory effect of local anaesthetics on reactive oxygen species production by human neutrophils. Acta Anaesthesiol Scand. 1997;41:524–528. doi: 10.1111/j.1399-6576.1997.tb04735.x. [DOI] [PubMed] [Google Scholar]
- Morgan D, Capasso M, Musset B, Cherny VV, Rios E, Dyer MJ, DeCoursey TE. Voltage-gated proton channels maintain pH in human neutrophils during phagocytosis. Proc Natl Acad Sci U S A. 2009;106:18022–18027. doi: 10.1073/pnas.0905565106. [DOI] [PMC free article] [PubMed] [Google Scholar]
- Morgan D, Cherny VV, Murphy R, Katz BZ, DeCoursey TE. The pH dependence of NADPH oxidase in human eosinophils. J Physiol. 2005;569:419–431. doi: 10.1113/jphysiol.2005.094748. [DOI] [PMC free article] [PubMed] [Google Scholar]
- Mori T, Zhao X, Zuo Y, Aistrup GL, Nishikawa K, Marszalec W, Yeh JZ, Narahashi T. Modulation of neuronal nicotinic acetylcholine receptors by halothane in rat cortical neurons. Mol Pharmacol. 2001;59:732–743. doi: 10.1124/mol.59.4.732. [DOI] [PubMed] [Google Scholar]
- Morihata H, Kawawaki J, Okina M, Sakai H, Notomi T, Sawada M, Kuno M. Early and late activation of the voltage-gated proton channel during lactic acidosis through pH-dependent and -independent mechanisms. Pflugers Arch. 2008;455:829–838. doi: 10.1007/s00424-007-0339-7. [DOI] [PubMed] [Google Scholar]
- Morihata H, Kawawaki J, Sakai H, Sawada M, Tsutada T, Kuno M. Temporal fluctuations of voltage-gated proton currents in rat spinal microglia via pH-dependent and -independent mechanisms. Neurosci Res. 2000a;38:265–271. doi: 10.1016/s0168-0102(00)00170-x. [DOI] [PubMed] [Google Scholar]
- Morihata H, Nakamura F, Tsutada T, Kuno M. Potentiation of a voltage-gated proton current in acidosis-induced swelling of rat microglia. J Neurosci. 2000b;20:7220–7227. doi: 10.1523/JNEUROSCI.20-19-07220.2000. [DOI] [PMC free article] [PubMed] [Google Scholar]
- Nakajima K, Kohsaka S. Microglia: neuroprotective and neurotrophic cells in the central nervous system. Curr Drug Targets Cardiovasc Haematol Disord. 2004;4:65–84. doi: 10.2174/1568006043481284. [DOI] [PubMed] [Google Scholar]
- Nakanishi M, Mori T, Nishikawa K, Sawada M, Kuno M, Asada A. The effects of general anesthetics on P2X7 and P2Y receptors in a rat microglial cell line. Anesth Analg. 2007;104:1136–1144. doi: 10.1213/01.ane.0000260615.12553.4e. [DOI] [PubMed] [Google Scholar]
- Narahashi T, Frazier T, Yamada M. The site of action and active form of local anesthetics. I. Theory and pH experiments with tertiary compounds. J Pharmacol Exp Ther. 1970;171:32–44. [PubMed] [Google Scholar]
- Nauseef WM. How human neutrophils kill and degrade microbes: an integrated view. Immunol Rev. 2007;219:88–102. doi: 10.1111/j.1600-065X.2007.00550.x. [DOI] [PubMed] [Google Scholar]
- Ogata K, Shinohara M, Inoue H, Miyata T, Yoshioka M, Ohura K. Effects of local anesthetics on rat macrophage phagocytosis. {Article in Japanese.} Nippon Yakurigaku Zasshi. 1993;101:53–58. doi: 10.1254/fpj.101.1_53. [DOI] [PubMed] [Google Scholar]
- Onizuka S, Kasaba T, Tamura R, Takasaki M. Lidocaine increases intracellular sodium concentration through a Na+-H+ exchanger in an identified Lymnaea neuron. Anesth Analg. 2008;106:1465–1472. doi: 10.1213/ane.0b013e31816d1530. [DOI] [PubMed] [Google Scholar]
- Peck SL, Johnston RB, Jr, Horwitz LD. Reduced neutrophil superoxide anion release after prolonged infusions of lidocaine. J Pharmacol Exp Ther. 1985;235:418–422. [PubMed] [Google Scholar]
- Rada B, Hably C, Meczner A, Timar C, Lakatos G, Enyedi P, Ligeti E. Role of Nox2 in elimination of microorganisms. Semin Immunopathol. 2008;30:237–253. doi: 10.1007/s00281-008-0126-3. [DOI] [PubMed] [Google Scholar]
- Ragsdale DS, McPhee JC, Scheuer T, Catterall WA. Molecular determinants of state-dependent block of Na+ channels by local anesthetics. Science. 1994;265:1724–1728. doi: 10.1126/science.8085162. [DOI] [PubMed] [Google Scholar]
- Ramsey IS, Moran MM, Chong JA, Clapham DE. A voltage-gated proton-selective channel lacking the pore domain. Nature. 2006;440:1213–1216. doi: 10.1038/nature04700. [DOI] [PMC free article] [PubMed] [Google Scholar]
- Ramsey IS, Ruchti E, Kaczmarek JS, Clapham DE. Hv1 proton channels are required for high-level NADPH oxidase-dependent superoxide production during the phagocyte respiratory burst. Proc Natl Acad Sci U S A. 2009;106:7642–7647. doi: 10.1073/pnas.0902761106. [DOI] [PMC free article] [PubMed] [Google Scholar]
- Roos A, Boron WF. Intracellular pH. Physiol Rev. 1981;61:296–434. doi: 10.1152/physrev.1981.61.2.296. [DOI] [PubMed] [Google Scholar]
- Ruppen W, Steiner LA, Drewe J, Hauenstein L, Brugger S, Seeberger MD. Bupivacaine concentrations in the lumbar cerebrospinal fluid of patients during spinal anaesthesia. Br J Anaesth. 2009;102:832–838. doi: 10.1093/bja/aep049. [DOI] [PubMed] [Google Scholar]
- Ruuls SR, Bauer J, Sontrop K, Huitinga I, 't Hart BA, Dijkstra CD. Reactive oxygen species are involved in the pathogenesis of experimental allergic encephalomyelitis in Lewis rats. J Neuroimmunol. 1995;56:207–217. doi: 10.1016/0165-5728(94)00154-g. [DOI] [PubMed] [Google Scholar]
- Salimi K, Moser K, Zassler B, Reindl M, Embacher N, Schermer C, Weis C, Marksteiner J, Sawada M, Humpel C. Glial cell line-derived neurotrophic factor enhances survival of GM-CSF dependent rat GMIR1-microglial cells. Neurosci Res. 2002;43:221–229. doi: 10.1016/s0168-0102(02)00036-6. [DOI] [PubMed] [Google Scholar]
- Sanchez V, Arthur GR, Strichartz GR. Fundamental properties of local anesthetics. I. The dependence of lidocaine's ionization and octanol:buffer partitioning on solvent and temperature. Anesth Analg. 1987;66:159–165. [PubMed] [Google Scholar]
- Sasaki M, Takagi M, Okamura Y. A voltage sensor-domain protein is a voltage-gated proton channel. Science. 2006;312:589–592. doi: 10.1126/science.1122352. [DOI] [PubMed] [Google Scholar]
- Sawada M, Imai F, Suzuki H, Hayakawa M, Kanno T, Nagatsu T. Brain-specific gene expression by immortalized microglial cell-mediated gene transfer in the mammalian brain. FEBS Lett. 1998;433:37–40. doi: 10.1016/s0014-5793(98)00879-5. [DOI] [PubMed] [Google Scholar]
- Sohn HY, Gloe T, Keller M, Schoenafinger K, Pohl U. Sensitive superoxide detection in vascular cells by the new chemiluminescence dye L-012. J Vasc Res. 1999;36:456–464. doi: 10.1159/000025688. [DOI] [PubMed] [Google Scholar]
- Streit WJ. The role of microglia in brain injury. Neurotoxicology. 1996;17:671–678. [PubMed] [Google Scholar]
- Strichartz GR, Sanchez V, Arthur GR, Chafetz R, Martin D. Fundamental properties of local anesthetics. II. Measured octanol:buffer partition coefficients and pKa values of clinically used drugs. Anesth Analg. 1990;71:158–170. doi: 10.1213/00000539-199008000-00008. [DOI] [PubMed] [Google Scholar]
- Van Zundert AA, Grouls RJ, Korsten HH, Lambert DH. Spinal anesthesia. Volume or concentration–what matters? Reg Anesth. 1996;21:112–118. [PubMed] [Google Scholar]
- Vinnikova AK, Alam RI, Malik SA, Ereso GL, Feldman GM, McCarty JM, Knepper MA, Heck GL, DeSimone JA, Lyall V. Na+-H+ exchange activity in taste receptor cells. J Neurophysiol. 2004;91:1297–1313. doi: 10.1152/jn.00809.2003. [DOI] [PubMed] [Google Scholar]