

Abstract
Purpose
The purpose of this study was to determine the ability of a novel shoe-based sensor that uses accelerometers, pressure sensors, and pattern recognition with a support vector machine (SVM) to accurately identify sitting, standing, and walking postures in people with stroke.
Methods
Subjects with stroke wore the shoe-based sensor while randomly assuming 3 main postures: sitting, standing, and walking. A SVM classifier was used to train and validate the data to develop individual and group models, which were tested for accuracy, recall, and precision.
Results
Eight subjects participated. Both individual and group models were able to accurately identify the different postures (99.1% to 100% individual models and 76.9% to 100% group models). Recall and precision were also high for both individual (0.99 to 1.00) and group (0.82 to 0.99) models.
Conclusions
The unique combination of accelerometer and pressure sensors built into the shoe was able to accurately identify postures. This shoe sensor could be used to provide accurate information on community performance of activities in people with stroke as well as provide behavioral enhancing feedback as part of a telerehabilitation intervention.
Keywords: accelerometry, physical activity, stroke, wearable sensors
Stroke is the leading cause of disability in the United States.1 Thirty percent of individuals who experience a stroke require assistance to ambulate and 26% are dependent with activities of daily living (ADLs).2 Overall activity level and community mobility are also greatly reduced.3 Improving community mobility is a common goal for persons with stroke.4,5 However, patient capacity in the clinic or on outcome measures used in clinical practice and research may not truly reflect performance and the amount of activity people with stroke actually participate in outside of a clinical or research laboratory setting.6–9
Advances in sensor technology, signal processing, and pattern recognition techniques may provide the ability to accurately and precisely measure physical activity and functional postures in an unobtrusive manner while individuals with stroke go about their normal everyday activities in their homes and community. Accelerometers are relatively small, inexpensive sensors that can be worn on single or multiple body parts, which measure the amount, intensity, frequency, and duration of movement. Accelerometers can measure acceleration of the body part it is worn on in 1 (uni-axial), 2 (bi-axial), or 3 (tri-axial) planes. The data can be stored for prolonged periods of time and postprocessed to estimate physical activity.10
In the simplest way, accelerometer output can be quantified as counts. The voltage signal collected by the accelerometer is filtered, amplified, and then converted to a digital series of numbers. To determine the count, the digital signal is processed to determine the number of times the signal crossed a preset threshold during a certain period of time. The intensity, duration, frequency, and number of counts can then be used to estimate energy expenditure, physical activity, and other movements.10
Accelerometers are increasingly being used to measure activity in people with stroke. Uswatte and colleagues11,12 used an accelerometer that is worn on the wrist to monitor the amount of use of the affected upper extremity (UE) after stroke. The accelerometer was about the size of a wristwatch. These authors found that the ratio of most affected to least affected UE motion determined by the accelerometers is a valid and reliable measure of UE activity in people with stroke. There was a moderate relationship between this ratio and clinical measures of UE real-world use as measured by the Motor Activity Log and Actual Amount of Use Test. Additionally, there was good compliance with wearing the accelerometers over two, 3-day periods.12,13 Uswatte and colleagues13 also found that the accelerometer determined UE activity was responsive to change over the course of constraint-induced movement therapy.
The Stroke Upper Limb Activity Monitor (S-ULAM) combines accelerometers placed on the lower extremities (LE), trunk, and UE with electrogoniometers on both elbows.9,14 diNiet and colleagues9 found that the amount of UE use and the proportion of unimpaired to impaired UE activity as measured by the S-ULAM were able to distinguish among individuals with mild stroke, moderate stroke, and healthy controls. A potential limitation of the S-ULAM is the burden on the user, as there are multiple wires connecting the accelerometers and the electrogoniometers are strapped on the person’s arm. This may be uncomfortable and interfere with movement.
Accelerometers can also be used to determine ambulatory activity after stroke. In multiple studies, Macko and colleagues3,4,15,16 examined the psychometric properties of the StepWatch Activity Monitor (SAM; Orthocare Innovations, Oklahoma City, Oklahoma, USA). The SAM measures steps taken per day and is worn just above the lateral malleolus of the unaffected LE. It consists of an accelerometer and electronic filter that detects leg movements from which step counts are determined. The SAM is 75 × 50 × 20 mm and weighs approximately 38 g. It can be worn for up to 2 months, but is typically calibrated so that it collects data for 1 to 2 weeks. Data are downloaded via a docking station to a personal computer.
The SAM is more accurate and reliable than standard pedometers16 and a hip-worn accelerometer15 in people with stroke. Construct validity of the SAM has been established. Mean steps taken per day as measured by the SAM are moderately related to balance and gait speed,17 and the SAM was found to be more sensitive to change than the Stroke Impact Scale, gait speed, and the mobility subscale of the FIM* in people with stroke undergoing outpatient physical therapy.3
Other studies have examined the ability of accelerometers to quantify gait in people with stroke. Using a single, tri-axial accelerometer placed at the L3 spinous process, Mizuike and colleagues18 found that the accelerometer signals were able to distinguish between healthy controls and people with stroke and between different levels of severity of stroke. Using a combination of bi-axial accelerometers and gyroscopes attached to the tibial tuberosity and heel of each lower extremity, Lau and colleagues19 examined the ability of the sensors to distinguish between different walking conditions (level, up slope, down slope, ascend stairs, and descend stairs). Using a support vector machine (SVM) to classify the data, the authors found an overall accuracy of 97.5%.19
Saremi and colleagues20 examined the reliability and validity of the Intelligent Device for Energy Expenditure and Activity (IDEEA; MiniSun, Fresno, California, USA). The IDEEA uses 5, bi-axial accelerometers: 1 on the sternum, 1 on each femur between the knee and anterior superior iliac spine (ASIS), and 1 on each medial forefoot. A microprocessor worn on the belt stores and compresses the data. After processing the accelerometer data, temporal distance aspects of gait such as speed, single limb support time, swing duration, cadence, and step length can be determined. The authors found that the IDEEA was highly reproducible and that there was no significant difference in temporal distance measures of gait between the IDEEA and a footswitch system.20
Accelerometers have also been used to determine overall physical activity in people with stroke. Rand and colleagues21 measured physical activity and energy expenditure over a 3-day period using the Actical (BioLynx, Montreal, Quebec) tri-axial accelerometer placed on both ASISs of people with stroke. The accelerometer exhibited excellent reliability (ICCs3.1 ≥ 0.94) regardless of hip (paretic vs nonparetic). Physical activity and energy expenditure in the home and community were low, with only 42% of subjects meeting daily recommended physical activity levels.21
Accelerometer-based sensors provide a unique method of measuring physical activity,21 UE use,9,11–13 and gait3,15–20 in people with stroke. These sensors can be used to determine actual performance in a real-world environment. However, there is a need for further study and development of accelerometer-based sensors to fully realize their potential in people with stroke.22 Some of the sensors described above require multiple placement sites,9,11,19,20 have not been tested in a free-living environment,18–20 or provide measures that are not readily understandable to patients.18,19,21
As described previously, the use of sensors in people with stroke has mainly focused on monitoring walking activity and affected UE use. However, many people with stroke have limited walking ability15,23 and do not sufficiently recover use of their affected UE.24 To effectively monitor what people with stroke are actually doing in their home and community, a wider range of activities need to be monitored.
We have developed a novel shoe-based sensor that combines a tri-axial accelerometer that is mounted on the heel of a shoe and force sensitive resistors embedded in a flexible insole.25,26 In a healthy individual, this sensor was able to accurately (100% accuracy) detect what postures the subject was in (sitting, standing, or walking) while in a laboratory environment.27 Most activities that people perform throughout the day are likely done in one of these 3 main postures (sitting, standing, or walking). There is growing evidence that healthy adults spend too much time in sitting and other sedentary behaviors.28 This is likely true to an even greater degree in people with stroke. It is necessary to be able to monitor activities other than just walking and affected UE use to gain an accurate picture of what activities people with stroke are engaging in throughout the day. The purpose of this study was to determine the ability of this shoe-based sensor to accurately identify 3 postures (sitting, standing, and walking) in people with stroke.
Methods
Subjects with stroke who had completed their rehabilitation were recruited from a local outpatient physical therapy clinic. Inclusion criteria were as follows: at least 3 months poststroke, able to walk in their home and/or community without physical assistance, able to stand without physical assistance for more than 60 seconds, able to transition from sitting to standing from a standard height chair without physical assistance, and Mini-Mental State Exam score ≥24. Subjects were excluded if they had some other health condition that affected their ability to stand or walk independently. All subjects provided informed consent, and the Clarkson University Institutional Review Board approved the data collection procedure.
Instrument
Our unique sensor system collected plantar pressure and heel acceleration data through a wearable sensor system embedded into a pair of shoes (Figure 1A). Each shoe had a flexible insole, which incorporated 5 force-sensitive resistors (Interlink Inc, Camarillo, California, USA) positioned under the heel; heads of 1st, 3rd, and 5th metatarsal; and the great toe (Figure 1B). This positioning allowed for the potential to differentiate aspects of the gait cycle such as initial contact, mid stance, and terminal stance as well as to account for differences in loading of anterior and posterior areas of the foot during different activities. A 3-dimensional accelerometer positioned on the back of the shoe detected orientation of the shoe (and foot) with respect to gravity and characterized the motion trajectory. A battery, power switch, and wireless board were installed on a rigid circuit board glued to the back of the shoe as shown in Figure 1A. The tail of the flexible insole was fed through a narrow cut in the shoe and connected to the same circuit board. The sensor system was very lightweight and created no observable interference with subjects’ movement patterns.
Figure 1.

(A) Pair of shoes equipped with sensors, wireless transmitter, and batteries. (B) A pressure-sensitive insole with force sensitive resistors.
Pressure and acceleration data were sampled at 25 Hz by a 12-bit analog-to-digital converter and sent over a wireless link to a base computer. A lower than typical sampling rate is possible due to the use of a combination of pressure and acceleration, which produces excellent recognition accuracy even at lower sampling frequencies.29 The wireless system used for data acquisition was based on Wireless Intelligent Sensor and Actuator Network (WISAN) developed specifically for time-synchronous data acquisition. Application of WISAN allowed for data sampling at exactly the same time (with a difference of no more than 10 μs) from both shoes. The sensor data were streamed to a portable computer with a Labview front end and stored on the hard drive for further processing.
Procedure
Subjects were fitted with a pair of shoes that had the sensor incorporated into them. While the subjects were wearing the shoe-based sensors, pressure and acceleration data were collected in 3 main postures: sitting, standing, and walking. Within the sitting posture there were 4 positions that the subjects assumed: self-selected comfortable position, sitting with both feet on the floor, sitting with legs crossed so that one foot was on the floor and one foot off the floor, and reaching forward while sitting. In standing there were also 4 positions: static standing in a comfortable position, standing while reaching toward the unaffected side, standing while reaching toward the affected side, and standing while reaching forward. Data were collected in 4 positions when sitting and standing to better mimic real-life conditions.
Subjects walked under 2 conditions: self-selected comfortable pace and fastest safe pace. Subjects walked continuously over a level surface for 1 minute. Additionally, subjects walked at their self-selected and fastest paces over a GAITRite mat (CIR Systems, Havertown, Pennsylvania). Each position and walking condition was performed 4 times. During the data collection process, all subjects were supervised by a physical therapist for safety. The order in which each position trial was performed was randomized. Each data collection session lasted approximately 60 minutes.
The following data were collected to describe the degree of motor and mobility function of the subjects: Berg Balance Scale (BBS),30 lower extremity motor section of the Fugl-Meyer (FM- LE),31,32 and Stroke Impact Scale 16 (SIS-16).33–35
Data processing and analysis
The pressure and acceleration data were manually reviewed for integrity through a software package written in Labview. After the manual review, sensor data were processed to form feature vectors for the classifier, which was used to categorize data into one of the 3 main postures (sitting, standing, or walking). Each 800-element lagged feature vector represents pressure and acceleration histories from both shoes for the past 2 seconds (2 shoes × 8 sensors × 25 samples per second × 2 seconds = 800 samples). Thus, all predictions are made for nonoverlapping 2-second epochs. Each posture creates distinct features that can be used by the classifier. Each feature was normalized on the scale of [0,1].
A SVM classifier was used to train and validate the data to develop individual and group models. SVM is a robust method of supervised machine learning that can use training examples to learn the dependencies in the data (in our case, the computer learns how the signals from the shoe sensors can predict postures and activities) and apply the learned model to recognition of previously unseen data. Training is performed only once; when completed, the trained classifier can be used for posture and activity recognition without a need for retraining. For individual models, a classifier is trained for each individual subject. Although the individual classification models typically have higher accuracy, the obvious disadvantage is the need to have a separate classifier for each subject. A group classification model is trained on the data pooled from several subjects and ideally is applicable to any individual, but potentially at a cost of lower accuracy. The following training process is not specific to SVM, but can be applied to any supervised method of machine learning.36 In our case, the training data consist of pairs of feature vectors (preprocessed acceleration and pressure signals) and desired outputs (posture or activity labels such as sit = 1, stand = 2, walk = 3). Kernel functions may be used to perform nonlinear mapping of the input space to a higher dimensional feature space. During the learning phase (training), the SVM classifier constructs a hyperplane such that the distance between the hyperplane and the closest training instances of any class is maximized. Thus, SVM is minimizing the generalization error of the classifier, which typically results in higher classification accuracy. A set of classifier parameters such as the cost of misclassification (C) is typically found in a grid-search procedure. After training, the SVM is ready to perform the classification by applying the learned hyperplane to the observations of interest. By definition, SVM is a binary (2-class) classifier, so the multiclass recognition problems (such as the one in this study) are typically reduced to several binary classification problems. More information on SVM can be found in Cristianini and Shawe-Taylor.37
A 4-fold holdout cross-validation procedure was used to develop individual models, where a classification model is trained for one subject only.38 In this procedure, three-quarters of the data from each posture for an individual subject was used to train the SVM classifier. The remaining one-quarter of the data was tested against the SVM classifier to determine accuracy.25 The accuracy is the total number of true positive (TP) identifications by the SVM divided by the sum of the TP, false positives (FP), and false negatives (FN): accuracy = TP/(TP + FN + FP). Postures predicted by the individual SVM classifier were compared against actual postures and precision, and recall of the SVM classifier for each of the 3 postures (sitting, standing, and walking) was determined for each individual. Class-specific precision and recall are objective measures of a classifier’s ability to recognize specific postures and activities. Recall is defined as the number of true positive (TP) divided by the sum of the true positives and the false negatives (FN): recall = TP/(TP + FN). Precision is defined as the number of true positives divided by the sum of the true positive and false positives (FP): precision = TP/(TP + FP). A cumulative confusion matrix (Tables 1 and 2) illustrates the classification accuracy by combining classification results from all subjects by summation. The rows of the table correspond to actual postures/activities assumed by subjects, and columns correspond to predicted postures/activities made by the classifier from the sensor data. Results from 4 folds were averaged for reporting.
Table 1.
Cumulative confusion matrix for individual models
| Predicted posture |
||||
|---|---|---|---|---|
| Sit | Stand | Walk | Posture recall | |
| Actual posture | ||||
| Sit | 3622 | 0 | 0 | 1.00 |
| Stand | 0 | 3704 | 2 | 1.00 |
| Walk | 0 | 2 | 1568 | 0.99 |
| Posture precision | 1.00 | 0.99 | 0.99 | 0.99 = combined accuracy |
Note: A confusion matrix is used in the field of artificial intelligence for assessment of accuracy in supervised learning. In this case, the Support Vector Machine (SVM) classifier is learning to identify the pressure and acceleration data from the shoe sensor to identify sitting, standing, and walking postures. The sum of each row equals to the true number of 2-second time intervals (epochs) of a given class presented to the classifier. Each intersecting column shows how many of these epochs were recognized as members of this or other classes (ie, how many times the classifier “confused” one class for another). The counts are accumulated across the subject population, hence, the cumulative confusion matrix.
accuracy = true positive/(true positive + false positive + false negative)
precision = true positive/(true positive +false positive)
recall = true positive/(true positive + false negative)
Table 2.
Cumulative confusion matrix for the group models
| Predicted posture |
||||
|---|---|---|---|---|
| Sit | Stand | Walk | Posture recall | |
| Actual posture | ||||
| Sit | 3515 | 21 | 86 | 0.97 |
| Stand | 7 | 3409 | 290 | 0.91 |
| Walk | 0 | 22 | 1548 | 0.99 |
| Posture precision | 0.99 | 0.98 | 0.82 | 0.95 = combined accuracy |
Note: A confusion matrix is used in the field of artificial intelligence for assessment of accuracy in supervised learning. In this case, the Support Vector Machine (SVM) classifier is learning to identify the pressure and acceleration data from the shoe sensor to identify sitting, standing, and walking postures. The sum of each row equals to the true number of 2-second time intervals (epochs) of a given class presented to the classifier. Each intersecting column shows how many of these epochs were recognized as members of this or other classes (ie, how many times the classifier “confused” one class for another). The counts are accumulated across the subject population, hence, the cumulative confusion matrix.
accuracy = true positive/(true positive + false positive + false negative)
precision = true positive/(true positive + false positive)
recall = true positive/(true positive + false negative)
Group models were developed using Leave-One-Out holdout cross-validation procedure.38 Group models are trained on a dataset pooled from multiple subjects and thus enable subject-independent classification. All the data in one posture for all the subjects except one were used to train the group SVM classifier. The data from the one subject that was not used to create the SVM classifier were validated for accuracy using the group SVM classifier created by the data from the other subjects. This process was repeated such that the acceleration and pressure data from each subject were validated for accuracy against the group SVM classifiers created from all the other subjects combined. Predicted postures based on the group SVM classification were compared against actual postures to determine the precision and recall of the group SVM classifier for each of the 3 postures (sitting, standing, and walking).
Results
Eight subjects participated in the study (6 women and 2 men). Four subjects had a left cortical cerebrovascular accident (CVA) with right hemiparesis, 2 had a right cortical CVA with left hemiparesis, 1 had a brainstem CVA that resulted in right hemiparesis, and 1 had a cerebellar CVA. Five subjects ambulated without an assistive device, 1 subject used a cane, 1 used a hemiwalker, and 1 subject used a 2-wheeled walker. Table 3 provides further demographic information.
Table 3.
Subject demographic data
| Demographics | M (SD) |
|---|---|
| Age, years | 60.1 (9.9) |
| Time since stroke, months | 51.7 (45.1) |
| Berg Balance Scale | 44.3 (11.7) |
| Fugl-Meyer LE motor score | 25.8 (5.9) |
| Self-selected gait speed, m/s | 0.69 (0.35) |
| Stroke Impact Scale 16 | 65.4 (22.0) |
| Mini-Mental State Exam | 28.7 (2.1) |
| Ankle-foot orthotic use (yes/no) | 2/6 |
Note: LE = lower extremity.
The shoe-based pressure and accelerometer sensors were able to accurately identify the different postures. Figures 2 and 3 illustrate the pressure and acceleration data from the shoes in standing (Figures 2A and B) and walking (Figures 3A and B). The accuracy for correctly identifying sitting, standing, and walking from the acceleration and pressure data in individual subjects using the individual models ranged from 99.91% to 100% (Table 4). Using the individual models and combining the subjects together in the cumulative confusion matrix (Table 1), the recall and precision ranged from 0.99 to 1.00, and the accuracy was 0.99. On 2 occasions, standing was identified from the acceleration and pressure data when the actual posture was walking; and on 2 occasions, acceleration and pressure data identified the posture as walking when it was standing.
Figure 2.

(A) Pressure data and (B) acceleration data from a shoe-based sensor in one subject while standing.
Figure 3.

(A) Pressure data and (B) acceleration data from a shoe-based sensor in one subject while walking.
Table 4.
Accuracy of individual and group models for individual subjects
| Model | Subject 1 | Subject 2 | Subject 3 | Subject 4 | Subject 5 | Subject 6 | Subject 7 | Subject 8 |
|---|---|---|---|---|---|---|---|---|
| Individual model | 100.0% | 100.0% | 99.91% | 99.91% | 100.0% | 100.0% | 99.92% | 99.92% |
| Group model | 76.9% | 100.0% | 96.5% | 91.5% | 99.6% | 100.0% | 96.7% | 97.5% |
The accuracy for correctly identifying sitting, standing, and walking from the acceleration and pressure data in individual subjects using the group model ranged from 76.9% to 100% (Table 4). Using the group model and combining the subjects together in the cumulative confusion matrix (Table 2), the posture recall and precision ranged from 0.82 to 0.99, and the accuracy was 0.95.
Discussion
Our novel shoe-based sensor that combines pressure and acceleration data demonstrated excellent recognition rates for identifying basic postures (sitting, standing, and walking) in people with stroke. Using individual models based on each subject’s motion patterns, the accuracy was nearly 100% for all subjects. Using a group model developed from all the subjects, the accuracy was still very high, with accuracy in all subjects except one above 91%. These rates are higher than other researchers have found using accelerometers in multiple locations in healthy individuals.39–41
The precision and recall of the acceleration and pressure data using individual models to identify the 3 postures were excellent. Using group models, the precision and recall were also strong. There were very few false positives or false negatives when identifying sitting and standing. The recall for walking was also strong (91%), whereas the precision was not quite as strong (82%). Standing was incorrectly identified as walking in some trials. We anticipate that increasing the duration of recognition epoch will improve the precision by accounting for slow ambulation speed of some subjects.
The shoe-based sensor’s strong accuracy, precision, and recall using the group model indicate that individual calibration may not be necessary. There was one subject with the low accuracy using the group model. This subject had an accuracy of only 76.9% for identifying the different postures using the group model, but a 100% accuracy using the individual model. On closer inspection of the data, this finding is not surprising. This subject was the only subject who did not have hemiparesis but had a cerebellar stroke and demonstrated mild ataxia. The group model that was used to identify the different postures based on the acceleration and pressure data from this subject was developed from the other 7 subjects, all of whom had moderate hemiparesis. Because this subject’s movement patterns (mild ataxia) were likely different from the other 7 subjects (moderate hemiparesis), the group model was not as accurate in identifying the different postures. The shoe-based sensor may also be capable of distinguishing between individuals with different types and severities of stroke. Further study is necessary to confirm this unexpected finding.
This shoe-based sensor is unique compared to other accelerometer-based sensors that have been studied in people with stroke to detect movement. Previous studies used systems that require multiple sensor placements that may not be comfortable or convenient for patients to wear.9,19,20 This shoe-based sensor is worn unobtrusively on and within an individual’s shoe. During our testing, it did not interfere with any movement by the subjects.
There are limitations in our findings. All of our subjects were able to ambulate short distances independently. Further testing is needed to confirm these results with individuals with lower functional abilities. We did not examine the ability of the sensors to detect transitions such as sit to/from stand position or ascend/ descend stairs, 2 commonly performed activities. We believe that in a real-world environment the shoe-based sensors will be able to detect sit to/ from stand transitions. Based on the pressure and acceleration data over the 2-s epoch, the SVM classifier outputs an activity/posture label: sit = 1, stand = 2, walk = 3. A change from one activity/posture label to another would indicate a transition from sitting to/from standing or walking had occurred. Also, further testing is needed in an open environment to validate the shoe-based sensors’ ability to identify activities performed in the real world.
Activity monitoring sensors tested in people with stroke have primarily been designed and used to measure performance, such as UE use,9,11–13 walking activity,3,15,16 gait parameters,18–20 and physical activity/energy expenditure.21 With further development and testing, we believe this shoe-based sensor has the capability of measuring many of these same parameters.
Providing accurate feedback is an important behavioral enhancing strategy that can be used to improve health, increase physical activity, and increase UE use.42–44 In addition to accurately measuring performance in the real world, this shoe-based sensor could provide behavior-enhancing feedback as part of a comprehensive telerehabilitation intervention. We are in the process of improving the sensor so that the data are wirelessly transmitted for preliminary processing and storage to a mobile phone that is worn by the user. The user could then view and receive feedback by looking at the mobile phone on time spent in different postures, steps taken, and overall physical activity level. At the end of the day, these data could be wirelessly downloaded to a computer for further analysis and used for feedback. The data could be viewed simultaneously by the user and rehabilitation professional via the Internet. These data could be used to set goals to increase physical activity, which is an important component of the use of pedometers,42 and monitor compliance with home exercise programs. Based on shoe-sensor data, user feedback, and progress toward these goals, the rehabilitation professional could remotely problem solve with the user on ways to remove barriers to increase physical activity and enhance social participation (Figure 4).
Figure 4.
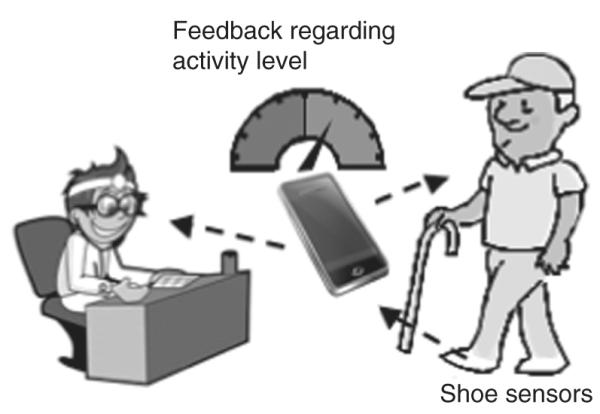
Using the shoe-based sensors to provide behavioral enhancing feedback as part of a telerehabilitation intervention.
Advances in sensor technology, signal processing, and pattern recognition techniques provide a unique method of measuring real-world performance in people with stroke. Accelerometers may be a valid and reliable outcome measure for clinical and research purposes. The data presented here from a novel shoe-based sensor demonstrate its ability to accurately identify common postures assumed throughout the day in people with stroke. Although further development and study are needed, we believe that this innovative sensor can be used as a part of a comprehensive telerehabilitation intervention to increase physical activity in people with stroke as well as an outcome measure of performance of activities in the community.
Acknowledgments
This research was supported by award number R15HD061006 from the Eunice Kennedy Shriver National Institute of Child Health & Human Development and the New York Physical Therapy Association.
Footnotes
FIM™ is a trademark of Uniform Data System for Medical Rehabilitation, a division of UB Foundation Activities, Inc.
REFERENCES
- 1.Lloyd-Jones D, Adams RJ, Brown TM, et al. Heart disease and stroke statistics—2010 update. A report from the American Heart Association. Circulation. 2010;121:e46–e215. doi: 10.1161/CIRCULATIONAHA.109.192667. [DOI] [PubMed] [Google Scholar]
- 2.Kelly-Hayes M, Beiser A, Kase CS, Scaramucci A, D’Agostino RB, Wolf PA. The influence of gender and age on disability following ischemic stroke: the Framingham study. J Stroke Cerebrovasc Dis. 2003;12:119–126. doi: 10.1016/S1052-3057(03)00042-9. [DOI] [PubMed] [Google Scholar]
- 3.Shaughnessy M, Michael KM, Sorkin JD, Macko RF. Steps after stroke: capturing ambulatory recovery. Stroke. 2005;36:1305–1307. doi: 10.1161/01.STR.0000166202.00669.d2. [DOI] [PubMed] [Google Scholar]
- 4.Ivey FM, Macko RF, Ryan AS, Hafer-Macko CE. Cardiovascular health and fitness after stroke. Top Stroke Rehabil. 2005;12:1–16. doi: 10.1310/GEEU-YRUY-VJ72-LEAR. [DOI] [PubMed] [Google Scholar]
- 5.Lord SE, McPherson K, McNaughton HK, Rochester L, Weatherall M. Community ambulation after stroke: How important and obtainable is it and what measures appear predictive? Arch Phys Med Rehabil. 2004;85:234–239. doi: 10.1016/j.apmr.2003.05.002. [DOI] [PubMed] [Google Scholar]
- 6.Andrews K, Stewart J. Stroke recovery: He can but does he? Rheumatol Rehabil. 1979;18:43–48. doi: 10.1093/rheumatology/18.1.43. [DOI] [PubMed] [Google Scholar]
- 7.Lord S, Rochester L. Gait velocity and community ambulation: the limits of assessment. Stroke. 2008;39 doi: 10.1161/STROKEAHA.107.502203. reply e76. [DOI] [PubMed] [Google Scholar]
- 8.Lord SE, Rochester L. Measurement of community ambulation after stroke: current status and future developments. Stroke. 2005;36:1457–1461. doi: 10.1161/01.STR.0000170698.20376.2e. [DOI] [PubMed] [Google Scholar]
- 9.de Niet M, Bussmann JB, Ribbers GM, Stam HJ. The stroke upper-limb activity monitor: its sensitivity to measure hemiplegic upper-limb activity during daily life. Arch Phys Med Rehabil. 2007;88:1121–1126. doi: 10.1016/j.apmr.2007.06.005. [DOI] [PubMed] [Google Scholar]
- 10.Chen KY, Bassett DR., Jr The technology of accelerometry-based activity monitors: current and future. Med Sci Sports Exerc. 2005;37:S490–500. doi: 10.1249/01.mss.0000185571.49104.82. [DOI] [PubMed] [Google Scholar]
- 11.Uswatte G, Miltner WH, Foo B, Varma M, Moran S, Taub E. Objective measurement of functional upper-extremity movement using accelerometer recordings transformed with a threshold filter. Stroke. 2000;31:662–667. doi: 10.1161/01.str.31.3.662. [DOI] [PubMed] [Google Scholar]
- 12.Uswatte G, Giuliani C, Winstein C, Zeringue A, Hobbs L, Wolf SL. Validity of accelerometry for monitoring real-world arm activity in patients with subacute stroke: evidence from the extremity constraint-induced therapy evaluation trial. Arch Phys Med Rehabil. 2006;87:1340–1345. doi: 10.1016/j.apmr.2006.06.006. [DOI] [PubMed] [Google Scholar]
- 13.Uswatte G, Foo WL, Olmstead H, Lopez K, Holand A, Simms LB. Ambulatory monitoring of arm movement using accelerometry: an objective measure of upper-extremity rehabilitation in persons with chronic stroke. Arch Phys Med Rehabil. 2005;86:1498–1501. doi: 10.1016/j.apmr.2005.01.010. [DOI] [PubMed] [Google Scholar]
- 14.Schasfoort FC, Bussmann JB, Martens WL, Stam HJ. Objective measurement of upper limb activity and mobility during everyday behavior using ambulatory accelerometry: the upper limb activity monitor. Behav Res Methods. 2006;38:439–446. doi: 10.3758/bf03192798. [DOI] [PubMed] [Google Scholar]
- 15.Haeuber E, Shaughnessy M, Forrester LW, Coleman KL, Macko RF. Accelerometer monitoring of home- and community-based ambulatory activity after stroke. Arch Phys Med Rehabil. 2004;85:1997–2001. doi: 10.1016/j.apmr.2003.11.035. [DOI] [PubMed] [Google Scholar]
- 16.Macko RF, Haeuber E, Shaughnessy M, et al. Microprocessor-based ambulatory activity monitoring in stroke patients. Med Sci Sports Exerc. 2002;34:394–399. doi: 10.1097/00005768-200203000-00002. [DOI] [PubMed] [Google Scholar]
- 17.Michael KM, Allen JK, Macko RF. Reduced ambulatory activity after stroke: the role of balance, gait, and cardiovascular fitness. Arch Phys Med Rehabil. 2005;86:1552–1556. doi: 10.1016/j.apmr.2004.12.026. [DOI] [PubMed] [Google Scholar]
- 18.Mizuike C, Ohgi S, Morita S. Analysis of stroke patient walking dynamics using a tri-axial accelerometer. Gait Posture. 2009;30:60–64. doi: 10.1016/j.gaitpost.2009.02.017. [DOI] [PubMed] [Google Scholar]
- 19.Lau H-y, Tong K-y, Zhu H. Support vector machine for classification of walking conditions of persons after stroke with dropped foot. Hum Movement Sci. 2009;28:504–514. doi: 10.1016/j.humov.2008.12.003. [DOI] [PubMed] [Google Scholar]
- 20.Saremi K, Marehbian J, Yan X, et al. Reliability and validity of bilateral thigh and foot accelerometry measures of walking in healthy and hemiparetic subjects. Neurorehabil Neural Rep. 2006;20:297–305. doi: 10.1177/1545968306287171. [DOI] [PubMed] [Google Scholar]
- 21.Rand D, Eng JJ, Tang P-F, Jeng J-S, Hung C. How active are people with stroke?: Use of accelerometers to assess physical activity. Stroke. 2009;40:163–168. doi: 10.1161/STROKEAHA.108.523621. [DOI] [PubMed] [Google Scholar]
- 22.Gebruers N, Vanroy C, Truijen S, Engelborghs S, De Deyn PP. Monitoring of physical activity after stroke: a systematic review of accelerometry-based measures. Arch Phys Med Rehabil. 2010;91:288–297. doi: 10.1016/j.apmr.2009.10.025. [DOI] [PubMed] [Google Scholar]
- 23.Jorgensen HS, Nakayama H, Raaschou HO, Olsen TS. Recovery of walking function in stroke patients: the Copenhagen Stroke Study. Arch Phys Med Rehabil. 1995;76:27–32. doi: 10.1016/s0003-9993(95)80038-7. [DOI] [PubMed] [Google Scholar]
- 24.Lucca LF, Castelli E, Sannita WG. An estimated 30–60% of adult patients after stroke do not achieve satisfactory motor recovery of the upper limb despite intensive rehabilitation. J Rehabil Med. 2009;41:953–953. doi: 10.2340/16501977-0433. [DOI] [PubMed] [Google Scholar]
- 25.Sazonov ES, Fulk G, Sazonova N, Schuckers S. Automatic recognition of postures and activities in stroke patients. Conf Proc IEEE Eng Med Biol Soc. 2009;1:2200–2203. doi: 10.1109/IEMBS.2009.5334908. [DOI] [PubMed] [Google Scholar]
- 26.Sazonov E, Bumpus T, Zeigler S, Marocco S. Identification of gait types from plantar pressure and heel acceleration data. Proceedings of the International Joint Conference on Neural Networks; Montreal. 2005. [Google Scholar]
- 27.Sazonov E, Krishnamurthy V, Makeyev O, Ray B, Hill J, Schutz Y. Int Conf IEEE Eng Med Biol Soc. Lyon, France: 2007. Automatic recognition of postural allocations; pp. 4993–4996. [DOI] [PubMed] [Google Scholar]
- 28.Hamilton MT, Healy GN, Dunstan DW, Zderic TW, Owen N. Too little exercise and too much sitting: inactivity physiology and the need for new recommendations on sedentary behavior. Curr Cardiovac Risk Rep. 2008;2:292–298. doi: 10.1007/s12170-008-0054-8. [DOI] [PMC free article] [PubMed] [Google Scholar]
- 29.Sazonov ES, Fulk G, Hill J, Schutz Y, Browning R. Monitoring of posture allocations and activities by a shoe-based wearable sensor. IEEE Trans Biomed Eng. 2011;58:983–990. doi: 10.1109/TBME.2010.2046738. [DOI] [PubMed] [Google Scholar]
- 30.Blum L, Korner-Bitensky N. Usefulness of the Berg Balance Scale in stroke rehabilitation: a systematic review. Phys Ther. 2008;88:559–566. doi: 10.2522/ptj.20070205. [DOI] [PubMed] [Google Scholar]
- 31.Sanford J, Moreland J, Swanson LR, Stratford PW, Gowland C. Reliability of the Fugl-Meyer assessment for testing motor performance in patients following stroke. Phys Ther. 1993;73:447–454. doi: 10.1093/ptj/73.7.447. [DOI] [PubMed] [Google Scholar]
- 32.Fugl-Meyer AR, Jaasko L, Leyman I, Olsson S, Steglind S. The post-stroke hemiplegic patient. 1. A method for evaluation of physical performance. Scand J Rehabil Med. 1975;7:13–31. [PubMed] [Google Scholar]
- 33.Duncan PW, Bode RK, Min Lai S, Perera S. Rasch analysis of a new stroke-specific outcome scale: the Stroke Impact Scale. Arch Phys Med Rehabil. 2003;84:950–963. doi: 10.1016/s0003-9993(03)00035-2. [DOI] [PubMed] [Google Scholar]
- 34.Duncan PW, Wallace D, Lai SM, Johnson D, Embretson S, Laster LJ. The Stroke Impact Scale version 2.0. Evaluation of reliability, validity, and sensitivity to change. Stroke. 1999;30:2131–2140. doi: 10.1161/01.str.30.10.2131. [DOI] [PubMed] [Google Scholar]
- 35.Duncan PW, Lai SM, Bode RK, Perera S, DeRosa J. Stroke Impact Scale-16: a brief assessment of physical function. Neurology. 2003;60:291–296. doi: 10.1212/01.wnl.0000041493.65665.d6. [DOI] [PubMed] [Google Scholar]
- 36.Alpaydin E. Introduction to Machine Learning. MIT Press; Cambridge, MA: 2004. [Google Scholar]
- 37.Cristianini N, Shawe-Taylor J. An Introduction to Support Vector Machines and Other Kernel-based Learning Methods. 1st ed Cambridge University Press; New York: 2000. [Google Scholar]
- 38.Devijver PA, Kittler J. Pattern Recognition: A Statistical Approach. Prentice-Hall; London: 1982. [Google Scholar]
- 39.Aminian K, Robert P, Buchser EE, Rutschmann B, Hayoz D, Depairon M. Physical activity monitoring based on accelerometry: validation and comparison with video observation. Med Biol Eng Comput. 1999;37:304–308. doi: 10.1007/BF02513304. [DOI] [PubMed] [Google Scholar]
- 40.Foerster F, Smeja M, Fahrenberg J. Detection of posture and motion by accelerometry: a validation in ambulatory monitoring. Comput Human Behav. 1999;15:571–583. [Google Scholar]
- 41.Mantyjarvi J, Himberg J, Seppanen T. Recognizing human motion with multiple acceleration sensors. Conf Proc IEEE Int Conf Syst Man Cybern. 2001;2:747–752. [Google Scholar]
- 42.Bravata DM, Smith-Spangler C, Sundaram V, et al. Using pedometers to increase physical activity and improve health: a systematic review. JAMA. 2007;298:2296–2304. doi: 10.1001/jama.298.19.2296. [DOI] [PubMed] [Google Scholar]
- 43.Morris DM, Taub E, Mark VW. Constraint-induced movement therapy: characterizing the intervention protocol. Europa Medicophysica. 2006;42:257–268. [PubMed] [Google Scholar]
- 44.Taub E, Uswatte G, Pidikiti R. Constraint-Induced Movement Therapy: a new family of techniques with broad application to physical rehabilitation—a clinical review. J Rehabil Res Dev. 1999;36:237–251. [PubMed] [Google Scholar]