Letter to the editor
Psoriasis vulgaris is a chronic disease that affects 1–3% of the population (Chandran and Raychaudhuri, 2010). In addition to skin and possible joint involvement, recent evidence suggests associations between psoriasis and other systemic diseases (Gelfand et al., 2006). The molecular characterization of psoriatic skin samples has lead to a greater understanding of disease pathogenesis and has been useful in identifying therapeutic targets (Jabbari et al., 2011). Much of our knowledge of the molecular contributors of this disease has come from data generated by microarray experiments, which rely on the hybridization of labeled RNA/cDNA to arrays of single stranded DNA sequence that correspond to genes to estimate relative expression levels. However, microarray studies harbor limitations including a high background, the need for known template sequences, and a relatively limited dynamic range. It is possible that important genes in psoriasis are expressed at levels below the level of reliable detection by microarrays (Suarez-Farinas et al., 2010). In contrast, deep RNA sequencing (RNA-seq) is a methodology in which the RNA/cDNA species within a sample are sequenced. The obtained sequences can be aligned to a reference genome, and a count number for each gene can be generated. RNA-seq may be used for transcriptomic profiling that does not suffer from the shortcomings mentioned for microarrays.
In this study, RNA-seq was used to identify differentially expressed genes (DEGs) in lesional (LS) and nonlesional (NL) psoriatic skin samples. To our knowledge, this is the first description of use of this technology in primary human tissue to describe an inflammatory dermatologic disease. These data were compared to published psoriasis transcriptomic studies, which, up to this point, exclusively used microarray technologies. RNA-seq identified a substantial number of previously unrecognized DEGs in psoriatic skin. Uniquely identified DEGs were compared to a list of genes known to be synergistically upregulated in keratinocytes by the combined action of interleukin-17 (IL-17) and tumor necrosis factor-α (TNF-α), and our data further supports the significance of this molecular interaction in the pathogenesis of psoriasis.
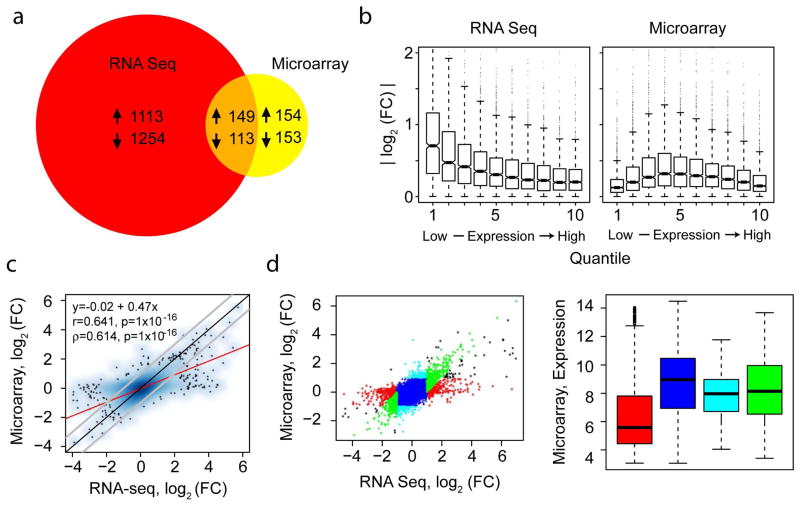
In order to define the transcriptomic profile of psoriatic skin, three pairs of LS and NL skin biopsies were taken from patients with untreated moderate-to-severe plaque psoriasis. Total RNA was extracted, processed as described (Supplemental Materials, Materials and Methods), and sequenced on an Illumina GA-IIx platform. In parallel, the same RNA samples were similarly processed and hybridized to Affymetrix Human Genome U133A 2.0 arrays. The RNA-seq method identified 2,629 DEGs (Figure 1A), using cut-offs of fold change (FC) >1.5 and a false discovery rate (FDR) of <0.1. These cut-off values were used because of the small sample size (see Supplemental Figure 1 for Venn diagrams with other cut-off values). In contrast to the RNA-seq analysis, 569 DEGs were identified by microarray analysis using the same criteria, of which 46% were identified by RNA-seq. We were interested in identifying what may account for the difference between the two data sets. We assessed estimated FC by the level of expression of the genes (Figure 1B). Although the microarray analysis yielded an expected pattern of higher FC values at intermediate expression levels, the RNA-seq analysis exhibited higher FC values at lower expression levels. Comparison of the estimated FC by RNA-seq and microarray analysis yielded a correlation coefficient of 0.641 (Figure 1C), with RNA-seq data exhibiting overall larger FC values. Further examination revealed a population of genes that exhibited FC values at or near zero by microarray analysis but exhibiting a wide range of FC values by RNA-seq. Analysis of the subset of this population of genes with absolute FC >2 by RNA-seq (Figure 1D, right panel, red) exhibited relatively low overall expression (Figure 1D, left panel, red). These data indicate that those genes in which the absolute FC was >2 by RNA-seq, but not by microarray, were mostly low abundance transcripts that occupy a range of concentrations in which microarray technology is known to underestimate FC. In total, these analyses show that RNA-seq has the capability of identifying higher FC values at lower mRNA expression levels and identifies a larger set of DEGs when compared with microarrays.
Figure 1. Identification of a large set of differentially expressed genes in psoriatic skin.
(a) Venn diagram comparing DEGs between lesional and non-lesional skin of psoriatic patients as assessed by RNA-seq and microarray analysis using the samples from the same set of patients. Indicated in the diagram are the numbers of upregulated and downregulated DEGs. (b) Boxplots (means, boxes 25–75%, +/− whiskers 95%) of the absolute values of the log2 fold change among ten quantiles of concentrations for RNA-seq (left panel) and microarray analyses (right panel). (c) Scatterplot of the FC values for all genes as estimated by RNA-seq and microarray analyses. (d) Genes were grouped based on dot plot location (left panel) and assessed for mean expression as determined by microarray analysis (right panel).
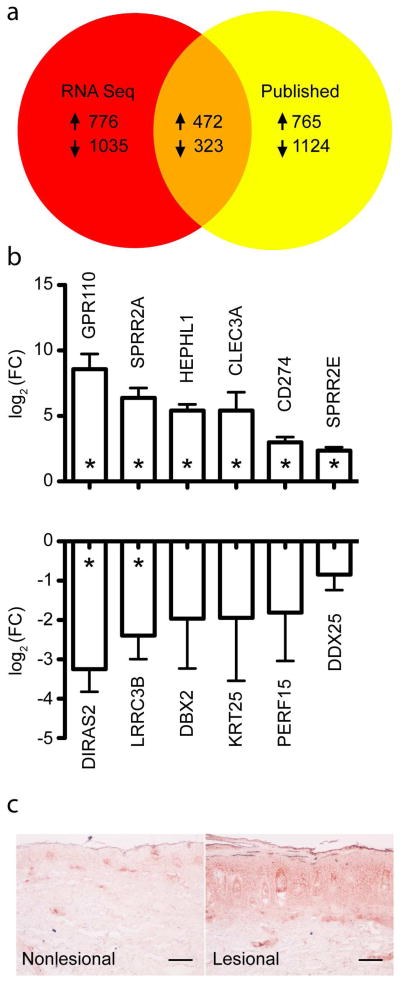
We then compared the RNA-seq data to the data from four published transcriptomic analyses, all of which used Affymetrix microarrays (Bowcock et al., 2001; Gudjonsson et al., 2009; Suarez-Farinas et al., 2010; Zhou et al., 2003). These published studies identified 2,684 DEGs from 116 patients. In contrast, our RNA-seq study, based on only three patients, yielded a similar number of DEGs, albeit with less stringent cutoff criteria given the considerably smaller sample size (see Supplementary Figure 1 for Venn diagrams with other cut-off values). We sought to confirm the differential gene expression among a set of twelve genes selected in an unbiased manner that were detected by RNA-seq but not by the published microarray analyses by real time RT-PCR (Figure 2B). Using a different set of samples from fifteen untreated, moderate-to-severe psoriasis patients, we examined the expression of the six upregulated genes GPR110, SPRR2A, HEPHL1, CLEC3A, CD274, SPRR2E, and found all to be significantly upregulated by RT-PCR (p-values of 5.62 × 10⁻⁶, 1.17 × 10⁻⁶, 3.24 × 10⁻⁸, 2.08 × 10⁻³, 6.54 × 10⁻⁶, and 6.25 × 10⁻⁷, respectively). We examined the expression of six downregulated genes and found DIRAS2 and LRRC3B to be statistically significant (p-values of 8.25 × 10⁻⁵, 1.57 × 10⁻³, 0.14, 0.25, 0.16, and 0.05 for DIRAS2, LRRC3B, DBX2, KRT25, PERF15, and DDX25, respectively). Spearman’s rank correlation coefficient for RT-PCR and RNA-seq data of the twelve genes selected was 0.88 (p=0.00060) (Supplementary Figure 2). These data supported that the results of the RNA-seq analysis were largely externally valid.
Figure 2. RNA-seq identifies a novel set of DEGs in psoriasis skin lesions not otherwise identified in prior published studies.
(a) Venn diagram comparing DEGs identified by RNA-seq and those identified by published microarray studies. (b) Real time RT-PCR confirmation of six upregulated (upper panel) and six downregulated (lower panel) DEGs identified by RNA-seq. Displayed are mean log2 fold change +/− SEM, 15 paired lesional and control nonlesional samples for each gene. (c) SPRR2B protein expression was detected in psoriatic nonlesional (left) and lesional (right) skin sections by immunohistochemistry (100x magnification, three sets of paired samples assessed, scale bar is equal to 200 micrometers).
Chiricozzi et al. recently reported a set of genes in keratinocytes that exhibited synergistic upregulation when stimulated with IL-17 and TNF-α (Chiricozzi et al., 2011). Fifty-three of the 160 “synergistic” genes were identified in at least one of the aforementioned published studies; our RNA-seq analysis identified 14 additional upregulated DEGs (Supplementary Table 2), further emphasizing the contribution of this immunological circuit in the pathogenesis of psoriasis. One of these genes was SPRR2B; staining for the protein product of this gene confirmed increased expression in psoriatic lesional skin (Figure 2C), corroborating differences at the protein level of a gene identified uniquely by RNA-seq that is potentially informative with regards to active molecular pathways in psoriasis.
The transcriptomic profiling of psoriasis has led to an increased understanding of disease pathogenesis. While microarray technologies have been instrumental in this regard, it is clear that these tools detect an incomplete set of DEGs. RNA-seq can be used to supplement these prior technologies. Here, the use of RNA-seq methods substantially increased the number of psoriasis-related DEGs. Furthermore, DEGs that were uniquely identified by RNA-seq, but not in other published microarray studies, further supported the role of IL-17 and TNF-α synergy in psoriasis. Examination of one of these factors at the protein level confirmed that RNA-seq is a powerful tool that can be used to identify molecular factors present in psoriasis lesions, and may be useful in the identification of novel therapeutic targets. Further studies are ongoing to determine the biologic significance of DEGs uniquely discovered by RNA-seq.
Supplementary Material
Acknowledgments
We are grateful to Michelle Lowes for critiquing the manuscript. This publication was made possible by a Clinical and Translational Science Award grant number 5UL1RR024143 from the National Center for Research Resources (NCRR), a component of the National Institutes of Health (NIH), and NIH Roadmap for Medical Research.
Abbreviations
- DEG
differentially expressed gene
- FC
fold change
- TNF-α
tumor necrosis factor-α
- IL-17
interleukin-17
Footnotes
Conflict of Interest
James G. Krueger has received honoraria and served as a consultant for Amgen, Centocor, Janssen, Ortho Biotech, Merck, Pfizer, Biogen Idec, and GlaxoSmithKline.
References
- Bowcock AM, Shannon W, Du F, et al. Insights into psoriasis and other inflammatory diseases from large-scale gene expression studies. Hum Mol Genet. 2001;10:1793–1805. doi: 10.1093/hmg/10.17.1793. [DOI] [PubMed] [Google Scholar]
- Chandran V, Raychaudhuri SP. Geoepidemiology and environmental factors of psoriasis and psoriatic arthritis. J Autoimmun. 2010;34:J314–321. doi: 10.1016/j.jaut.2009.12.001. [DOI] [PubMed] [Google Scholar]
- Chiricozzi A, Guttman-Yassky E, Suarez-Farinas M, et al. Integrative responses to IL-17 and TNF-alpha in human keratinocytes account for key inflammatory pathogenic circuits in psoriasis. J Invest Dermatol. 2011;131:677–687. doi: 10.1038/jid.2010.340. [DOI] [PubMed] [Google Scholar]
- Gelfand JM, Neimann AL, Shin DB, et al. Risk of myocardial infarction in patients with psoriasis. JAMA. 2006;296:1735–1741. doi: 10.1001/jama.296.14.1735. [DOI] [PubMed] [Google Scholar]
- Gudjonsson JE, Ding J, Li X, et al. Global gene expression analysis reveals evidence for decreased lipid biosynthesis and increased innate immunity in uninvolved psoriatic skin. J Invest Dermatol. 2009;129:2795–2804. doi: 10.1038/jid.2009.173. [DOI] [PMC free article] [PubMed] [Google Scholar]
- Jabbari A, Johnson-Huang LM, Krueger JG. Role of the immune system and immunological circuits in psoriasis. G Ital Dermatol Venereol. 2011;146:17–30. [PubMed] [Google Scholar]
- Suarez-Farinas M, Lowes MA, Zaba LC, et al. Evaluation of the psoriasis transcriptome across different studies by gene set enrichment analysis (GSEA) PLoS One. 2010;5:e10247. doi: 10.1371/journal.pone.0010247. [DOI] [PMC free article] [PubMed] [Google Scholar]
- Zhou X, Krueger JG, Kao MC, et al. Novel mechanisms of T-cell and dendritic cell activation revealed by profiling of psoriasis on the 63,100-element oligonucleotide array. Physiol Genomics. 2003;13:69–78. doi: 10.1152/physiolgenomics.00157.2002. [DOI] [PubMed] [Google Scholar]
Associated Data
This section collects any data citations, data availability statements, or supplementary materials included in this article.


