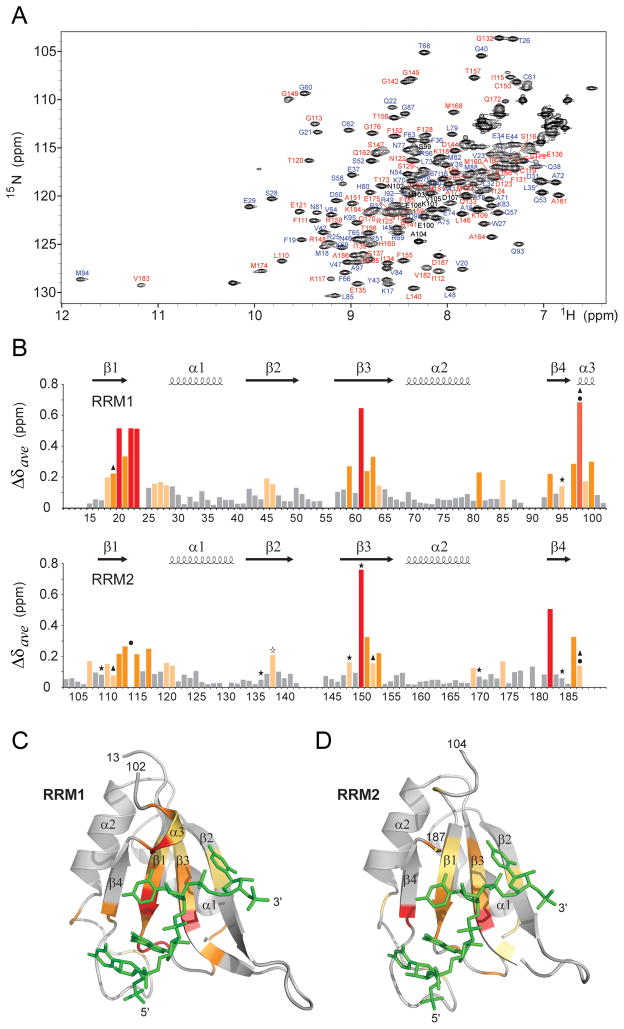
Figure 6. Resonance Assignments and Chemical Shift Changes in NMR Spectra of CUGBP1 RRM1/2-RNA Complex upon Binding of GUUGUUUUUGUU RNA (complex 2).
(A) 1H-15N HSQC spectrum of RRM1/2 bound to GUUGUUUUUGUU RNA (sequence 2) in 20 mM Na-Hepes, pH 7.0, 100 mM NaCl, 1mM DTT at 25 °C. Amino acid assignments are listed adjacent to the resolved cross peaks, with those from RRM1 in blue, from RRM2 in red and from the interdomain linker in black.
(B) Histogram outlining the magnitude of the average chemical shift perturbation of the 15N and 1H backbone amide resonances of the CUGBP1 RRM1/2 on complex formation with RNA. The average chemical shift difference Δδave between the free and RNA-bound forms of RRM1/2 was calculated using a correlation: , where ΔδH is the chemical shift of amide proton and ΔδN is the chemical shift of amide nitrogen. Protein secondary structure elements are indicated on the top. Asterisks denote residues that form hydrogen bonds with RNA bases via their side chains; triangles indicate aromatic and aspartate residues involved in base-stacking with RNA bases; and circles mark residues interacting with RNA via their backbone functional groups in the crystal structure of the complex.
(C) The average amide chemical shift perturbations mapped onto the backbone trace of the RRM1 domain bound to UGUU motif (stick representation in green) in the crystal structure of the RRM1-RNA complex (complex 4).
(D) The average amide chemical shift perturbations mapped onto the backbone trace of the RRM2 domain bound to UGUU motif (stick representation in green) in the crystal structure of the RRM1/2-RNA complex (complex 1).
Residues that undergo changes in average amide chemical shift are color-coded as follows: red (>5-fold above average), orange (>2-fold above average) and yellow (between 1.2 to 2-fold above average) in panels B, C and D.
See also Figure S4.

