

Abstract
Dictyostelium discoideum is an excellent model organism for the study of directed cell migration since Dictyostelium cells show robust chemotactic responses to the chemoattractant cAMP. Many powerful experimental tools are applicable, including forward and reverse genetics, biochemistry, microscopy, and proteomics. Recent studies have demonstrated that many components involved in chemotaxis are functionally conserved between human neutrophils and Dictyostelium amoebae. In this section, we will describe how to define the functions of proteins that mediate and regulate cell motility, cell polarity, and directional sensing during chemotaxis in Dictyostelium.
1. Introduction
Chemotaxis is a dynamic process that involves directional sensing, cell polarity, and cell motility. Cells continuously rearrange their cytoskeleton and plasma membrane, resulting in an asymmetric cell shape, and periodically extend pseudopods. Actin polymerization in pseudopods at the leading edge of the cell is synchronized with contractile forces generated by myosin motor proteins at the rear. A directional sensing system biases pseudopodia formation towards the source of the chemoattractant and thus orients cell movement along the extracellular chemical gradient. To understand the molecular mechanisms of chemotaxis, a variety of assays have been used to dissect the individual sub-reactions involved in Dictyostelium.
This model organism is an excellent system for the study of cell migration. The molecular mechanisms underlying chemotaxis, such as actin polymerization, intracellular signaling, and cell migration, are highly conserved among eukaryotes. Therefore many powerful experimental tools used to dissect these processes in other organisms are applicable to Dictyostelium. When there are sufficient nutrients Dictyostelium cells proliferate as haploid single amoebae; however, when nutrients are depleted starvation immediately triggers the developmental program for surviving harsh conditions through spore formation. Chemotaxis plays an essential role in Dictyostelium development. During differentiation, ~100,000 cells migrate toward aggregation centers that release the chemoattractant cAMP and form multicellular structures. Differentiating cells secrete cAMP every 6 min and waves of extracellular cAMP reinforce the expression of the cAMP receptors and other signaling molecules that are required to respond to cAMP.
Differentiation normally takes several hours and the chemotactic ability peaks at 5–6 hrs after starvation. Around this time, cells establish an increased cell polarity due to down-regulation of basal cytoskeletal activity and become highly sensitive to chemoattractant stimulation. Thus, the developing amoebae display robust and rapid chemotactic responses.
In this chapter, we will describe how Dictyostelium mutants can be analyzed to determine whether and how they are defective in chemotaxis. Cell movement toward chemoattractants can be examined by direct observation using time-lapse microscopy. Quantification of cell movement and shape provides information on cell polarity, directionality, and rate of cell migration. In addition, the many biochemical reactions involved in chemotaxis can be examined in mutant and wildtype cells. Assays for chemoattractant-receptor interactions, G-protein activation, phosphatidylinositol (3,4,5)-triphosphate (PIP3) production and activation of Tor complex 2 (TorC2) and Ras signaling are described in this chapter. It should be noted that these biochemical reactions are often localized and therefore it is critical to determine where the reactions occur using microscopic approaches in addition to biochemical measurements. These assays will reveal the molecular mechanisms underlying chemotaxis and the function of proteins involved in this process. Identification of genes that are mutated in chemotaxis-defective mutants will help us understand the function of proteins involved in chemotaxis.
2. Materials
2.1 Cell culture and Development
HL5 medium, pH 6.5: 10 g/L Dextrose, 10 g/L Proteose pepton, 5 g/L Yeast extract, 0.67 g/L Na2HPO47H2O, 0.34 g/L KH2PO4. Autoclave and store at room temperature. 10 mg/mL Streptomycin sulfate.
DB (Development Buffer), pH 6.5: 5 mM Na2HPO4, 5 mM KH2PO4, 2 mM MgSO4, 0.2 mM CaCl2.
DB agar: 1% agar in DB.
PM (Phosphate magnesium buffer), pH 6.5: 5 mM Na2HPO4, 5 mM KH2PO4, 2 mM MgSO4.
cAMP: 10 mM stock solution. Store at −20°C.
Caffeine: 100 mM stock solution. Store at −20°C.
Hydrophobic agar: 1% agar in dH2O.
2.2 Time-Lapse Imaging
Inverted fluorescence microscope.
Lab-Tek II chambered coverglasses (Nalge Nunc).
FemtoJet Microinjector (Eppendorf).
Femtotips microcapillary pipettes (Eppendorf)
Micromanipulator (Eppendorf, Narushige).
The image processing software NIH ImageJ
2.3 G Protein Activation
Latrunculin A: 1 mM stock solution in DMSO. Stored at −20°C.
Alexa Fluor 594 (Molecular Probe): 10 mM stock solution. Stored at −20°C.
Inverted fluorescence microscope capable of: (1) excitation at 457 nm and simultaneous recording for emissions at 480 nm and 535 nm (for FRET). For example, we use an Olympus IX 71 inverted microscope with a 60X, 1.45 NA objective, a Kr/Ar laser line, and the Dual-View system (Optical Insights, LLC) mounted to a Photometrics Cascade 512B CCD for simultaneous image acquisition. (2) excitation at 550–600 nm and emission around 600–650 nm (for Alexa 594). A DsRed fluorescence filter set is used for Alexa 594 fluorescence.
2.4 PIP3 Production
DB-MES, pH 6.5: 20 mM MES, 2 mM MgSO4, 0.2 mM CaCl2.
[32P]Phosphorus (5 mCi/mL, NEX).
TLC plate (EM Science).
Nucleopore filter membrane (Whatman)
Plastic cup (VWR)
2.5 TorC2-PKB Activity
Mouse anti-phospho PDK docking motif monoclonal antibody (Cell Signaling). Use 1:2,000 dilution in TBST containing 5% (w/v) BSA; detect with anti-mouse IgG-HRP.
Rabbit anti-phospho PKC (pan) monoclonal antibody (Cell Signaling). Use 1:2,500 dilution in TBST containing 5% (w/v) BSA; detect with anti-rabbit IgG-HRP.
Rabbit anti-phospho PKB substrate monoclonal antibody (Cell Signaling). Use 1:2,500 dilution in TBST containing 5% (w/v) BSA; detect with anti-rabbit IgG-HRP.
2.6 GST-RBD-Byr2 Pull Down Assay
GST-RBD-Byr2 expression construct(1).
BL21 (DE3) Escherichia coli competent cells. Store at −80°C.
LB (Luria broth): 10 g/L NaCl, 10 g/L tryptone, 5 g/L yeast extract. Adjust pH to 7.0 with NaOH. Autoclave and store at room temperature.
Ampicillin. 100 mg/mL, filter-sterilize. Store at −20°C.
IPTG (isopropyl-β-D-thiogalactoside). 1 M stock solution. Store at −20°C.
DTT (dithiothreitol). 1 M stock solution. Store at −20°C.
PMSF (phenylmethylsulphonyl fluoride). 100 mM stock solution. Dissolve in isopropanol. Store at −20°C.
Lysozyme. 10 mg/mL. Store at −20°C.
Glutathione sepharose 4B. Store at 4°C.
10 × PBS (Phosphate-buffered saline), pH 7.5: 1.37 M NaCl, 27 mM KCl, 18 mM KH2PO4, 100 mM Na2HPO4. Store at 4°C.
Suspension buffer: 1 × PBS, 1 mM DTT, 1 mM PMSF. Add DTT and PMSF before use.
2 × Lysis buffer: 20 mM sodium phosphate (pH 7.2), 300 mM NaCl, 1% NP-40, 20% glycerol, 1 mg/mL BSA, 20 mM MgCl2, 2 mM EDTA, 2 mM Na3VO4, 10 mM NaF, with one tablet of protease inhibitor (Roche complete) per 25 mL.
Wash buffer: 10 mM sodium phosphate (pH 7.2), 150 mM NaCl, 0.5% NP-40, 10% glycerol, 10 mM MgCl2, 1 mM EDTA.
Antibodies: Mouse monoclonal anti-pan Ras antibody Ras10 (Calbiochem), and anti-mouse IgG-conjugated HRP. Store at 4°C.
3. Methods
3.1 Assays for Chemotactic Responses
Upon starvation, Dictyostelium cells initiate development into fruiting bodies. During development, Dictyostelium cells obtain the ability to chemotax toward cAMP, in order to form multilcellular structures. Therefore, it is important to develop Dictyostelium cells to make them competent for robust chemotaxis by depleting nutrients. Methods to induce development and prepare chemotaxis-competent cells are described below. When mutant cells are isolated, it is also important to analyze their developmental phenotypes as chemotaxis-defective mutants often fail to normally develop. To examine chemotaxis, two methods have been extensively used. The first assay observes chemotaxing cells toward cAMP released from a micropipette under a light microscope. The other assay analyzes cells moving toward cAMP on agar plates.
3.1.1 Developing Cells on Agar Plates
Grow cells to a density of 2–5 × 10⁶ cells/mL in HL5 medium at 22°C, shaking at 180 rpm.
Centrifuge 5 × 10⁶ cells at 500g for 5 min. Remove the supernatant and wash twice with 1 mL DB.
Resuspend cells in DB at 5 × 10⁶ cells/mL and spread 200 μL of cell suspension onto a 3.5 cm dish containing 1 mL of 1% DB agar. Remove the DB after cells attach.
Incubate cells at 22°C. Cells start aggregating around 6 hrs after plating. Wildtype cells form mature fruiting bodies within 24 hrs (Fig 1a).
Fig. 1.
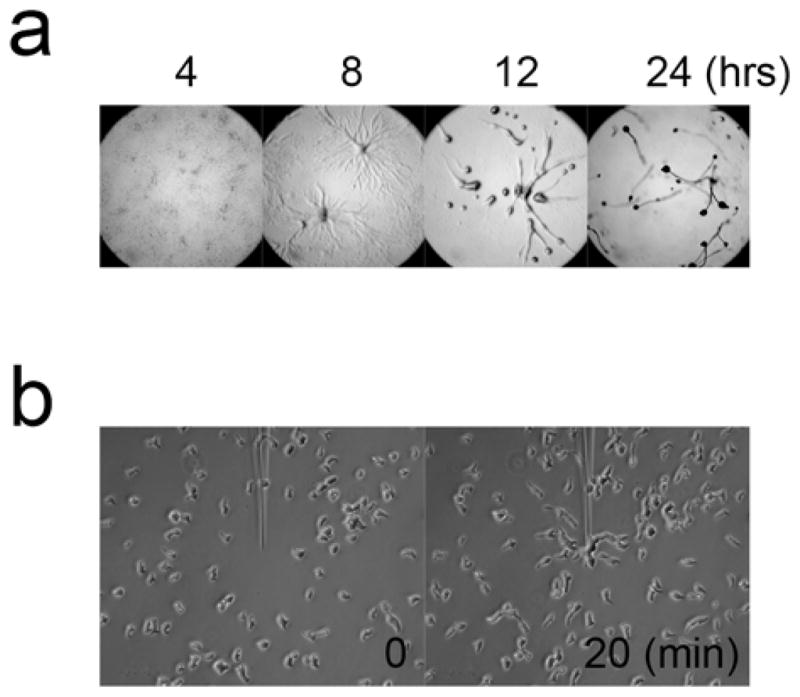
(a) Development of cells on non-nutrient agar plates. (b) Chemotaxis to a pipette filled with 1 μM cAMP
3.1.2 Prepare Chemotaxis-competent Cells
Centrifuge 2 × 10⁸ cells at 500g for 5 min. Remove the supernatant and wash twice with 40 mL DB.
Resuspend cells at 2 × 10⁷ cells/mL in 10 mL DB, transfer cells into a 125 mL flask, and shake for 1 hr at 100 rpm.
Pulse cells with cAMP at a final concentration of 50–100 nM every 6 min for 4–5 hrs using a timer-controlled-peristaltic pump. For example, set a pump to drop 50 μL of 20 μM cAMP every 6 min. Chemotaxis-competent cells start aggregating within 1 hour after cells are plated on DB agar as described in the section 3.1.1. (Developing Cells on Agar Plates).
To monitor the expression of developmentally regulated genes, take 100 μL of samples every hour and analyze using immunoblotting with antibodies against cAMP receptor 1 (cAR1) and adenylyl cyclase (ACA) (2)(see Note 1).
3.1.3. Needle Assay
Dilute developed cells by ~50 fold in DB and disrupt aggregates by pipetting gently. Transfer cells (~3 mL) to a one-well Lab-Tek II chambered coverglass, allow them to adhere to the coverglass for 10 min, and ensure that cells are individually separated under a light microscope.
Fill a micropipette with 15 μL of 1 μM cAMP. Attach the micropipette to a micromanipulator which is connected to a microinjector. Use a continuous injection mode with a compensation pressure (Pc) of 100 hPa. Place the micropipette in the middle of the field. Lower the micropipette till it just touches the chambered coverglasss.
Observe cells using light microscopy with 10 to 40x objectives and take pictures every 10–30 sec for 30 min (Fig. 1b).
3.1.4. Two-drop Assay
Dilute developed cells by ~5 fold in DB. Spot 5 μL of cell suspension and 5 μL of different concentrations of cAMP (0.1, 1, and 10 μM) onto a 1% hydrophobic agar. The distance between spots is 5 mm.
Capture images of cells using a 20x objective every 30 sec for 1 hr.
3.2 Assays for Chemotactic Signalings
3.2.1 Visualization of G Protein Activation by FRET
During development, Dictyostelium cells aggregate by migrating towards high concentrations of cAMP, which binds to the G protein-coupled receptor cAR1. Upon ligand binding, cAR1 activates the heterotrimeric G protein composed of Gα2, Gβ, and Gδ, causing Gα2 to dissociate from the Gβ-Gδ complex. This dissociation event can be monitored by the decrease of fluorescence resonance energy transfer (FRET) between Gα2 and Gβ tagged with CFP and YFP, respectively (3). The measurement can be done either at the population level using a fluorometer, or at the single-cell level using fluorescence microscopy (4). By recording the entire spectrum of emission averaged over a large number of cells, the population approach allows more accurate estimation of the absolute FRET change. However, in most instances the kinetics of FRET change is more important than its absolute magnitude, and single-cell measurement with fluorescent microcopy is advantageous due to its ease of applying complex spatial or temporal patterns of stimulation. The following protocol describes the procedure for monitoring G protein FRET at the single-cell level in real time by fluorescent microscopy, with the use of a micropipette that allows rapid introduction and removal of stimulation.
A. Preparation of Cells
Dictyostelium cells (Gα2-null or Gβ-null) overexpressing both Gα2-CFP and Gβ-YFP are developed by cAMP pulsing as described in 3.1.2 (Prepare Chemotaxis-competent Cells). Instead of the typical 4–5 hrs pulsing used for wildtype cells, a longer duration of pulsing (6–7 hrs) is recommended based on the observation that knock-out cells rescued with G proteins tagged with fluorescent proteins have delayed development.
Place cells on a one-well chambered coverglass as descried in 3.1.3. (A Needle Assay).
Cells are immobilized by the addition of Latrunculin A to a final concentration of 5 μM. Typically cells lose their polarized morphology within 10 min of Latrunculin A treatment and round up. This step is to minimize the effect of changes in cell morphology on the analysis of fluorescent signal.
B. Setting up Micropipettes
Fill a Femtotips micropipette with 5 μL of 10 μM cAMP solution containing 50 nM Alexa Fluor 594. Attach the micropipette to a microinjector and micromanipulator. Set a microinjector to continuously inject cAMP with a compensation pressure (Pc) of 100 hPa.
Under low magnification, use the micromanipulator to position the micropipette tip at the center of the viewing field. Save the position by holding the “position 1” button till a beeping sound is heard. Lift the micropipette (~0.5 cm) and save the position by holding the “position 2” button till a beeping sound is heard.
To obtain the spatial and temporal characteristics of the applied cAMP stimulation, fill a clean Tab-TekII chamber with DB and mount over a 60x objective. Using a dsRed fluorescence filter set, acquire time-lapse movies with a frame rate of one per second while bringing the micropipette tip in (position 1) and out (position 2) of the center of the field. Typically a stable gradient is established within 10 seconds of introducing the micropipette.
C. Microscopy and cAMP Stimulation
Mount the Lab-Tek II chamber loaded with cells (step 3) over a 60x objective. Cells are excited with a 457-nm laser line, and the image of emission at 480 nm (CFP channel) and 535 nm (YFP channel) are acquired simultaneously using the Dual-View system attached to the CCD camera.
Look for cells with bright emissions in both channels. Adjust the position of the selected cell(s) to a suitable distance from where the tip of the micropipette will be located when introduced.
Take time-lapse movies with a rate of two seconds per frame. Acquire at least ten frames before introducing the micropipette.
Use the “position 1” and “position 2” buttons on the micromanipulator to introduce and remove the micropipette while acquiring video.
D. Analysis of G Protein FRET Response
Open the saved video files in ImageJ.
For each frame, measure the mean pixel values for cells in both CFP and YFP channels. In ImageJ, the mean pixel value of a selected region of interest can be calculated using the “Measure” function under “Analyze” (see Note 2). Similarly, choose a background region to measure the mean value in both channels. Subtract the background values to obtain the corrected CFP and YFP emissions for cells.
Plot the corrected CFP and YFP emissions as well as the YFP/CFP ratio over time. Upon cAMP stimulation, CFP emissions should increase and YFP decrease. The YFP/CFP ratio should decrease and is usually more robust than either CFP or YFP emission because it is corrected for the frame-to-frame noise in excitation intensity (see Note 3). A typical result is shown in Fig. 2.
Fig. 2.
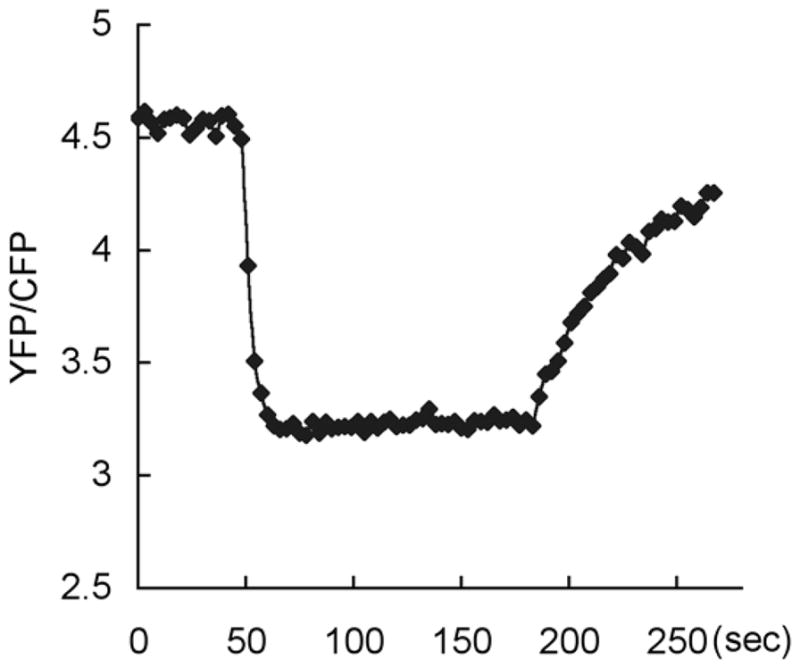
G protein activation upon cAMP stimulation monitored by FRET between Gα2-CFP and Gβ-YFP. Loss of FRET (decreased YFP:CFP ratio) was induced when a micropipette containing 10 μM cAMP was introduced at 45 sec and persisted until the micropipette was removed at 180 sec.
3.2.2 Detection of PIP3 Production
In chemotaxing cells, PIP3 is locally produced and activates signaling events that lead to actin polymerization at the leading edge. Pleckstrin homology (PH)-domain-containing proteins that bind to PIP3 are highly localized at the front of chemotaxing cells and mediate downstream events. The PH-domain-containing proteins include CRAC (5), PKB (6) and PhdA (7). The production of PIP3 is regulated by PI3-kinase (PI3K) and PI3-phosphatase (PTEN). PI3K phosphorylates PI(4,5)P2 to produce PIP3. On the other hand, PTEN converts PIP3 to PI(4,5)P2. Both PI3K and PTEN are required for PIP3 production and chemotaxis toward cAMP in Dictyostelium (8–10). Here, we describe methods to measure PIP3 production and localization upon cAMP stimulation. For in vivo analysis, GFP fused the PH domain of CRAC is used to visualize PIP3 by fluorescence microscopy (5–11). Amounts of PIP3 can be quantitatively analyzed by extracting lipids from cells.
A. Time-lapse Imaging of PIP3 Production in Response to Chemoattractant Stimulation
Prepare chemotaxis-competent cells expressing GFP-PHcrac as described in the section 3.1.2 (Prepare Chemotaxis-comptent Cells).
Resuspend the cells in DB at ~5 × 10⁵ cells/mL. Place 360 μL (~2 × 10⁵ cells) in a well of 8-well chambered coverglasss. Allow the cells to adhere for 10 min.
Place the chamber on an inverted fluorescence microscope.
Stimulate cells by adding 40 μL of 10 μM cAMP to the chamber. Carefully squirt cAMP solution to avoid disturbing the cells.
Capture images of cells using a 40x objective every 3 seconds for 1 min. PIP3 production peaks in the plasma membrane at 5–10 sec after stimulation (Fig. 3a).
Fig. 3.
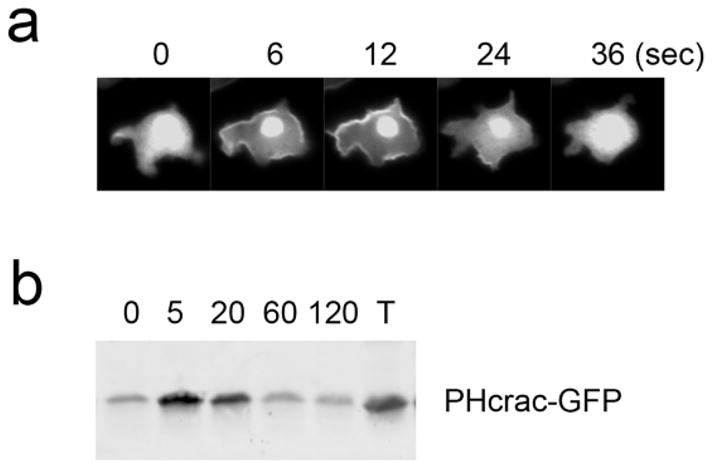
Visualization of transient PIP3 production upon uniform cAMP stimulation. Cells expressing PHcrac-GFP were examined by fluorescence microscopy (a) and immunoblotting using anti-GFP antibodies (b) after addition of 1 μM cAMP. T, 20% of input.
B. In Vivo Translocation of PHcrac
Prepare chemotaxis-competent cells expressing GFP-PHcrac.
Basalate cells by adding caffeine at a final concentration of 2–5 mM and shake for 20 min at 200 rpm.
Centrifuge cells at 500g for 5 min at 4°C. Remove the supernatant. Wash cells twice with 40 mL ice-cold PM.
Resuspend cells in 2.5 mL PM at 8 × 10⁷ cells/mL and keep them on ice until used in the assay.
Aliquot cells into small plastic cup and shake at 200 rpm.
Add cAMP at a final concentration of 1 μM (e.g. 15 μL of 100 mM cAMP into 1.5 mL of cells).
-
Take samples at 0, 5, 20, 60, 120 and 180 sec as described below.
Lyse 200 μL cells through 5 μm nucleopore filter into 1 mL ice-cold PM.
Spin at maximum speed for 1 min at RT in microcentrifuge.
Remove the supernatant.
Resuspend the pellet with 50 μL of 1x Sample Buffer.
Analyze 5 μL samples using SDS-PAGE and immunoblotting with anti-GFP antibodies (Fig. 3b).
C. Detection of PIP3 by Lipid Extractions and TLC
Prepare chemotaxis-competent cells in DB-MES.
Wash twice with 40 mL ice-cold DB-MES. Resuspend cells at 8 × 10⁷ cells/mL in DB-MES.
Aliquot 1.5 mL cells into a small plastic cup and shake at 200 rpm
Add 150 μL of 5 mCi/mL32Pi (5 mCi Phosphorus P32 radio neucleotide: NEX) at a final concentration of 500 μCi/mL and incubate cells for 40 min.
Basalate cells by adding 50 μL of 0.1 M caffeine, and shake at 200 rpm for 20 min.
Wash cells twice and resuspend in 1.5 mL ice-cold DB-MES.
Shake cells in a small plastic cup at 200 rpm and stimulate with 1 μM cAMP.
Take 150 μL of samples at 0, 5, 20, 60, 120 and 180 sec into a glass tube containing 1 mL ice-cold 1N HCl and mix well by vortexing for 5 min.
Add 2 mL MeOH/CHCl3 (1:1) and mix well.
Spin samples at 1000 rpm at 4°C for 5min.
Take 1 mL of a lower phase and mix well with 2 mL MeOH/1N HCl (1:1).
Spin samples at 1000 rpm at 4°C for 5 min.
Take 800 μL of a lower phase and dry samples in a glass tube under N2 gas.
Pre-run TLC plate in 2% potassium oxalate/dH2O:MeOH (3:2) over night and dry plates in a chemical hood for 30 min.
Activate the TLC plate at 100 °C for 3 min.
Resuspend dried samples in 30 μL CHCl3:MeOH (2:1).
Spot 10 μL of samples on the heat-activated TLC plate.
Run the TLC plate with CHCl3:acetone:MeOH:acetic acid:H2O (30:12:10:9:6) for 200 min at RT.
Detect signals by autoradiography or phosphoimaging.
3.2.3 TorC2-PKB Activity
Dictyostelium expresses two Protein Kinase B (PKB) homologs, PKBA and PKBR1. PKBA is recruited to the plasma membrane through a PIP3-specific Pleckstrin Homology (PH) domain at the N-terminus, whereas PKBR1 is tethered to the plasma membrane via N-terminal myristoylation (6, 12). cAMP activates the two PKBs through phosphorylation within their hydrophobic motifs (HMs) and activation loops (ALs) via Tor complex 2 (TorC2) (13) and Phosphoinositide-Dependent Kinase (PDKs) (14), respectively. Pianissimo A (PiaA), originally isolated in a forward genetic screen for chemotaxis defective mutants, is now recognized as a subunit of TorC2 (15). PKB phosphorylation is significantly reduced in cells lacking PiaA (13). Together, the two PKBs mediate the phosphorylation of severeal substrates, including Talin B, PI4P 5-kinase, two RasGefs, and a RhoGap (13). PKB phosphorylation occurs at the leading edge of migrating cells and plays important roles in chemotaxis. This section describes methods to assess PKB activity using phospho-specific antibodies.
A. cAMP Stimulation and Sample Preparation
Prepare chemotaxis-competent cells and basalate them as described in 3.2.2.B (see Note 4).
Resuspend cells in 5 mL PM at 2 × 10⁷ cells/mL and keep on ice until used in the assay (see Note 5).
Transfer ice-cold chemotaxis-comptent cells to a 5 mL disposable plastic cup. Immediately add 100 μM of cAMP at a final concentration of 1 μM and start shaking at 200 rpm (see Note 6).
At time points of 0, 10, 20, 30, 60, 90, 120, 180 sec, transfer 100 μL cells into a microcentrifuge tube containing 50 μL 3 × SDS sample buffer, and boil the sample at 95°C for 5 min.
Analyze samples using SDS-PAGE and immunoblotting with antibodies against phospho PDK docking motif, pan phosphor PKC, and phospho PKB substrate (see Notes 7–9) (Fig. 4).
Fig. 4.

PKB activation in response to chemoattractant stimulation. (a) Schematic representation of the activation of PKBR1 and PKBA. The N-ternimus of PKBR1 is myristoylated while the N-terminus of PKBA has a PIP3-specific PH domain. Upon cAMP stimulation, the two PKBs are activated through phosphorylation of their HMs by TorC2 and ALs by PDK. The phosphorylation sites (P) can be detected by phospho-specific antibodies. (b) Wildtype cells were stimulated with cAMP, lysed at the indicated time points, and subjected immunoblotting using antibodies against phospho HM (top panel), phospho-AL (middle panel), and phospho-substrate (bottom panel).
3.2.4 Ras Activity
Dictyostelium Ras proteins are important regulators of chemotaxis. Several Ras proteins, including RasB, RasC, RasD, and RasG, are activated upon cAMP stimulation (1, 16, 17). Activated Ras can be detected at the leading edge of cells undergoing chemotaxis (1). Two proteins, PI3K and TorC2, have been suggested to function downstream of Ras in regulating chemotaxis (8,13,18). Ras binding domain (RBD) from yeast Byr2 or human Raf-1, which specifically interacts with the GTP-bound form of Ras, has been used to monitor Ras activation in Dictyostelium. The RBD of Byr2 is capable of binding to all four Ras GTPases that are activated by cAMP, whereas the RBD of Raf1 is capable of binding to RasB, RasD, and RasG, but not to RasC (1, 17). This section describes biochemical and real-time imaging methods to assess Ras activation. In the biochemical assay, activated Ras proteins in cell lysates are pulled down by GST fused to RBD of Byr2 and glutathione-sepharose beads. In the cell imaging assay, GFP-fused RBD from Raf1 is used to detect activated Ras in vivo.
A. Preparation of GST-RBD-Byr2 Attached Beads
Transform E. coli with GST-RBD-Byr2 expression construct according to the manufacturer’s instruction (see Note 10).
Pick up a single colony, inoculate into 50 mL LB with 50 μg/mL ampicillin, and grow overnight at 37°C with shaking at 250 rpm.
Measure OD600 of the overnight culture. Transfer into 1L LB containing 50 μg/mL ampicillin at an OD600 of 0.05. Grow cells at 37°C with shaking at 250 rpm until OD600 reaches 0.4–0.6 (see Note 11).
Turn the temperature of the air shaker down to 20°C (see Note 12).
Add IPTG at a final concentration of 0.5 mM to induce protein expression. Shake the culture at 20°C for 18–20 hrs (see Note 13).
Harvest the cells by centrifugation at 4,000g for 10 min at 4°C (see Note 14.
Remove the supernatant. Resuspend cells in 50 mL suspension buffer (see Note 15).
Add 100 μg/mL lysozyme to cell suspension and incubate on ice for 20 min.
Sonicate cells. (see Note 16).
Add Triton X-100 at a final concentration of 2% and incubate on ice for 10 min.
Centrifuge at 10,000g for 15 min at 4°C (see Note 17).
Transfer the supernatant to a 50-mL tube and add 1 mL glutathione-sepharose 4B (see Note 18).
Rotate at 4°C for 1 hr.
Spin down the sepharose by centrifuging at 500g for 2 min at 4°C.
Remove the supernatant and wash five times with 40 mL ice-cold 1 × PBS.
Remove the supernatant after the final wash and add equal volume of ice-cold PBS to make a 50% slurry. Store at 4°C (see Note 19).
Check GST-RBD-Byr2 production by SDS-PAGE and Coomassie Brilliant Blue staining (see Note 20).
B. GST-RBD-Byr2 Pull Down
Prepare chemotaxis-competent cells and basalate them as described in 3.2.2.B.
Wash glutathione-sepharose beads carrying GST-RBD-Byr2 three times with lysis buffer. Aliquot the beads carrying 30 μg GST-RBD-Byr2 into microcentrifuge tubes. Keep on ice until used in the assay (see Note 21).
Resuspend basalated cells at 4 × 10⁷ cells/mL and keep on ice.
Transfer 3 mL cells to a 10 mL disposable plastic cup. Immediately add 100 μM of cAMP to a final concentration of 1 μM and shake at 200 rpm.
At time points of 10, 20, 40, 60 sec, transfer 350 μL cells into a microcentrifuge tube containing 350 μL ice-cold 2 × lysis buffer. Quickly mix by inverting the tube a few times and put the tube back on ice.
For the time point of 0 sec, mix 350 μL unstimulated cells with 350 μL 2 × lysis buffer.
Clarify the lysate by centrifugation at 15,000g for 10 min at 4°C.
As a total cell lysate control, take 50 μL of the supernatant and mix with 25 μL 3 × SDS sample buffer. Heat the sample at 95°C for 5 min.
Transfer the remaining supernatant (~600 μL) to the microcentrifuge tube containing GST-RBD-Byr2 beads.
Rotate for 45 min at 4°C.
Centrifuge at 2,000g for 30 sec at 4°C.
Remove the supernatant carefully. Wash beads four times with 1 mL wash buffer.
After the final wash, carefully aspirate the supernatant and add 3 × SDS sample buffer. Quickly move the tubes to a heat-block that is set to 95°C, and boil the sample for 5 min.
Analyze the pull-down product by immunoblootting with anti-pan-Ras antibodies (see Note 22) (Fig. 5a).
Fig. 5.

Ras activation in response to chemoattractant. (a) cAMP stimulation triggers rapid and transient activation of endogenous Ras proteins, which can be pulled down by GST-RBD-Byr2. (b) Fluorescent images of GFP-RBD-Raf1 in wildtype cells before and after cAMP stimulation.
C. Time-lapse Imaging of Ras Activation in Response to Global Chemoattractant Stimulation
Prepare chemotaxis-competent cells expressing GFP-RBD-Raf1 (see Note 23).
Resuspend cells with DB at 1 × 10⁷ cells/mL. Place 360 μL (~4 × 10⁶ cells) into one well of a 8-well chambered coverglass. Allow the cells to adhere for 10 min.
Place the chamber on a fluorescnce microscope.
Capture images using a 40 × objectives every 1 sec (see Note 24).
Stimulate Ras activation with 40 μL 10 μM cAMP (see Note 25) (Fig. 5b).
Footnotes
A potential complication which one might encounter during analysis of chemotaxis mutants is that mutant cells show defects in differentiation. Failure in formation of multi-cellular structure is an indication for chemotaxis defects since chemotaxis is required for aggregation. However, this phenotype may simply result from defects in differentiation itself. One way to test if differentiation is affected is to examine the expression of developmentally regulated genes including cAMP receptors (cAR1) and adenylyl cyclase (ACA). If differentiation is impaired, their expression will be delayed or inhibited. If differentiation is found to be affected, one could take alternative approaches to bypass this defect and study chemotaxis. For example, mutants defective in producing cAMP, including aca-, crac- and piaA- cells, are unable to relay cAMP and therefore show developmental as well as chemotactic phenotypes. Artificial cAMP pulse mimicking the cAMP wave can help these cells to undergo differentiation and bypass the defects, allowing one to specifically examine chemotaxis in these mutants. It is also possible to analyze chemotaxis toward folate in vegetative cells since folic acid activates essentially the same downstream reactions as cAMP. Although receptors for folic acid have not yet identified and chemotactic responses to folate are relatively weaker compared to cAMP, this experiment will enable one to study chemotaxis independent of differentiation.
Instead of measuring a selected region frame by frame manually, the process can be performed with a macro. Under Plugins, click New to open a Macro editing window and type in the following script: for (i=1; i<1000; i++) {setSlice(i);run(“Measure”);} Click Ctrl+R to run the Macro.
Since YFP can be directly excited to a smaller extent by 457 nm, YFP emission is not entirely the result of FRET. Due to variations in expression levels of Gα2-CFP and Gβ-YFP from cell to cell, however, it is not possible to determine the absolute magnitude of FRET at the single cell level only from emissions at 480 nm and 535 nm. Instead, the changes in the intensity of CFP and YFP emissions as well as the YFP/CFP ratio are used as surrogates for FRET changes.
Caffeine inhibits the TOR kinase activity and therefore needs to be removed for measuring PKB activation.
If cells are not maintained on ice, they will spontaneously secrete cAMP and respond in ~7 min.
A styrofoam rack for 50-mL conical tubes makes a convenient holder for multiple beakers.
The primary antibody can be kept at 4°C in TBST containing 5% (w/v) BSA and reused for additional one to two times.
To compare sample loading, stain the membrane with Coomassie Brilliant Blue solution for a few minutes, destain for suitable amounts of time, and finally rinse with H2O briefly. Let the membrane dry at room temperature.
As shown in Figure 4, the addition of cAMP triggers rapid phosphorylations of the HM of PKBR1 and the ALs of PKBR1 and PKBA, which peak at 30–60 sec and decline to pre-stimulus level by 2–3 min. The anti-phospho PKB substrate antibody detects a few bands before stimulation. Following cAMP stimulation, about ten new bands appear and display similar kinetics as that of PKB phosphorylation. The signals from phospho-proteins (pp)-350, 280, 200, 180, 140, 110, 90, and 65/67, are significantly reduced in cells lacking PKB activity, such as pkbR1- and piaA-, and are therefore considered as PKB substrates. Five of the putative PKB substrates (TalinB, GefN, GefS, PI5K, GacQ) have been identified by immunoprecipitation followed by mass spectrometry. A few of these bands (pp250, pp30, and pp23) are not PKB substrates as their phosphorylations are independent of PKB activity. They presumably contain the consensus motif RXRXXS/T that is recognized by other kinases.
It is important to use E. coli strains that have low protease activity, such as BL21 or BL21 (DE3).
It is important to use exponentially growing cells for protein induction.
It usually takes 20–30 min for the air shaker to cool down. The cells continue growing during this period of time to an OD600 of 0.6–0.8.
GST-RBD-Byr2 has low solubility when expressed in E. coli. Inducing protein production at 20°C increases the solubility.
Protein induction can be checked by SDS-PAGE and Coomassie Brilliant Blue staining. Mix cells (0.5 of OD600 unit) before and after IPTG induction with 50 μL 1 × SDS sample buffer. Load 10 μL on SDS polyacrylamide gel.
Cell suspension can be frozen at −80°C at this stage. When used later, thaw the cell suspension and add fresh 1 mM PMSF.
Place the tube containing the cell suspension in an ice-filled plastic cup to keep the sample cool. Sonicate for 30 sec 6–8 times with 30-sec intervals until cells are completely lysed.
It is optional to filtrate the supernatant with 0.45 μm filter attached to a 60 mL syringe. Two or three filters may be required because the filters tend to get clogged.
Glutathione-sepharose 4B is stored in 20% ethanol. Before use, wash three times with 10 mL PBS.
GST-RBD-Byr2 sepharose beads can also be stored in PBS/50% glycerol at −20°C and are usually stable for a few months.
Use BSA or any quantified protein as a control.
The volume of the beads containing 30 μg GST-Byr2-RBD should be between 10–20 μL.
12–15% SDS polyacrylamide gel is ideal for separating Ras proteins. The Ras10 antibody detects several Dictyostelium Ras isoforms.
For stable expression of GFP-RBD-Raf1, 20 μg/mL G418 is used.
Adjust exposure time and frequency to minimize photobleaching.
Add cAMP carefully into the chamber to avoid disturbing the attached cells. Ras activation peaks at about 5 sec after stimulation.
References
- 1.Kae H, Lim CJ, Spiegelman GB, Weeks G. Chemoattractant-induced Ras activation during Dictyostelium aggregation. EMBO Rep. 2004;5:602–606. doi: 10.1038/sj.embor.7400151. [DOI] [PMC free article] [PubMed] [Google Scholar]
- 2.Parent CA, Devreotes PN. Molecular genetics of signal transduction in Dictyostelium. Annu Rev Biochem. 1996;65:411–440. doi: 10.1146/annurev.bi.65.070196.002211. [DOI] [PubMed] [Google Scholar]
- 3.Janetopoulos C, Jin T, Devreotes P. Receptor-mediated activation of heterotrimeric G-proteins in living cells. Science. 2001;291:2408–2411. doi: 10.1126/science.1055835. [DOI] [PubMed] [Google Scholar]
- 4.Xu X, Meier-Schellersheim M, Jiao X, Nelson LE, Jin T. Quantitative imaging of single live cells reveals spatiotemporal dynamics of multistep signaling events of chemoattractant gradient sensing in Dictyostelium. Mol Biol Cell. 2005;16:676–688. doi: 10.1091/mbc.E04-07-0544. [DOI] [PMC free article] [PubMed] [Google Scholar]
- 5.Parent CA, Blacklock BJ, Froehlich WM, Murphy DB, Devreotes PN. G protein signaling events are activated at the leading edge of chemotactic cells. Cell. 1998;95:81–91. doi: 10.1016/s0092-8674(00)81784-5. [DOI] [PubMed] [Google Scholar]
- 6.Meili R, Ellsworth C, Lee S, Reddy TB, Ma H, Firtel RA. Chemoattractant-mediated transient activation and membrane localization of Akt/PKB is required for efficient chemotaxis to cAMP in Dictyostelium. Embo J. 1999;18:2092–2105. doi: 10.1093/emboj/18.8.2092. [DOI] [PMC free article] [PubMed] [Google Scholar]
- 7.Funamoto S, Milan K, Meili R, Firtel RA. Role of phosphatidylinositol 3′ kinase and a downstream pleckstrin homology domain-containing protein in controlling chemotaxis in dictyostelium. J Cell Biol. 2001;153:795–810. doi: 10.1083/jcb.153.4.795. [DOI] [PMC free article] [PubMed] [Google Scholar]
- 8.Funamoto S, Meili R, Lee S, Parry L, Firtel RA. Spatial and temporal regulation of 3-phosphoinositides by PI 3-kinase and PTEN mediates chemotaxis. Cell. 2002;109:611–623. doi: 10.1016/s0092-8674(02)00755-9. [DOI] [PubMed] [Google Scholar]
- 9.Iijima M, Devreotes P. Tumor suppressor PTEN mediates sensing of chemoattractant gradients. Cell. 2002;109:599–610. doi: 10.1016/s0092-8674(02)00745-6. [DOI] [PubMed] [Google Scholar]
- 10.Iijima M, Huang YE, Luo HR, Vazquez F, Devreotes PN. Novel mechanism of PTEN regulation by its phosphatidylinositol 4,5-bisphosphate binding motif is critical for chemotaxis. J Biol Chem. 2004;279:16606–16613. doi: 10.1074/jbc.M312098200. [DOI] [PubMed] [Google Scholar]
- 11.Huang YE, Iijima M, Parent CA, Funamoto S, Firtel RA, Devreotes P. Receptor-mediated regulation of PI3Ks confines PI(3,4,5)P3 to the leading edge of chemotaxing cells. Mol Biol Cell. 2003;14:1913–1922. doi: 10.1091/mbc.E02-10-0703. [DOI] [PMC free article] [PubMed] [Google Scholar]
- 12.Meili R, Ellsworth C, Firtel RA. A novel Akt/PKB-related kinase is essential for morphogenesis in Dictyostelium. Curr Biol. 2000;10:708–717. doi: 10.1016/s0960-9822(00)00536-4. [DOI] [PubMed] [Google Scholar]
- 13.Kamimura Y, Xiong Y, Iglesias PA, Hoeller O, Bolourani P, Devreotes PN. PIP3-independent activation of TorC2 and PKB at the cell’s leading edge mediates chemotaxis. Curr Biol. 2008;18:1034–1043. doi: 10.1016/j.cub.2008.06.068. [DOI] [PMC free article] [PubMed] [Google Scholar]
- 14.Kamimura Y, Devreotes PN. Phosphoinositide dependent protein kinase (PDK) activity regulates PIP3-dependent and -independent protein kinase B activation and chemotaxis. J Biol Chem. 2010 doi: 10.1074/jbc.M109.089235. in press. [DOI] [PMC free article] [PubMed] [Google Scholar]
- 15.Chen MY, Long Y, Devreotes PN. A novel cytosolic regulator, Pianissimo, is required for chemoattractant receptor and G protein-mediated activation of the 12 transmembrane domain adenylyl cyclase in Dictyostelium. Genes Dev. 1997;11:3218–3231. doi: 10.1101/gad.11.23.3218. [DOI] [PMC free article] [PubMed] [Google Scholar]
- 16.Mondal S, Bakthavatsalam D, Steimle P, Gassen B, Rivero F, Noegel AA. Linking Ras to myosin function: RasGEF Q, a Dictyostelium exchange factor for RasB, affects myosin II functions. J Cell Biol. 2008;181:747–760. [Google Scholar]
- 17.Zhang S, Charest PG, Firtel RA. Spatiotemporal regulation of Ras activity provides directional sensing. Curr Biol. 2008;18(20):1587–93. doi: 10.1016/j.cub.2008.08.069. [DOI] [PMC free article] [PubMed] [Google Scholar]
- 18.Lee S, Comer FI, Sasaki A, et al. TOR complex 2 integrates cell movement during chemotaxis and signal relay in Dictyostelium. Mol Biol Cell. 2005;16(10):4572–83. doi: 10.1091/mbc.E05-04-0342. [DOI] [PMC free article] [PubMed] [Google Scholar]