Abstract
The fluorescent quantum dots (QDs) delivered small interfering RNAs (siRNAs) targeting β-secretase (BACE1) to achieve high transfection efficiency of siRNAs and reduction of β-amyloid (Aβ) in nerve cells. The CdSe/ZnS QDs with the conjugation of amino-polyethylene glycol (PEG) were synthesized. Negatively charged siRNAs were electrostatically adsorbed to the surface of QDs to develop QD-PEG/siRNA nanoplexes. The QD-PEG/siRNAs nanoplexes significantly promote the transfection efficiency of siRNA, and the siRNAs from non-packaged nanoplexes were widely distributed in cell bodies and processes and efficiently silenced BACE1 gene, leading to the reduction of Aβ. The biodegradable PEG polymer coating could protect QDs from being exposed to the intracellular environment and restrained the release of toxic Cd2+. Therefore, the QD-PEG/siRNA nanoplexes reported here might serve as ideal carriers for siRNAs. We developed a novel method of siRNA delivery into nerve cells. We first reported that the QD-PEG/siRNA nanoplexes were generated by the electrostatic interaction and inhibited the Alzheimer's disease (AD)-associated BACE1 gene. We also first revealed the dynamics of QD-PEG/siRNAs within nerve cells via confocal microscopy and the ultrastructural evidences under transmission electron microscopy (TEM). This technology might hold promise for the treatment of neurodegenerative diseases such as AD.
Keywords: Alzheimer's disease, BACE1, quantum dot, siRNA, SK-N-SH cells
Introduction
The accumulation of β-amyloid (Aβ) is the main contributor to the pathogenesis of Alzheimer's disease (AD).1,2 Currently, the reduction of Aβ production by RNA interference has attracted a great deal of attention. Several studies including our previous study, revealed that small interfering RNA (siRNA) targeting β-secretase (BACE1) could significantly inhibit the expression of sequence-specific BACE1 messenger RNA and reduce the generation and accumulation of Aβ.1,3,4,5 However, the cell membranes of nerve cells can prevent the penetration of siRNAs, and the blood-brain barrier can also restrict siRNAs from entering the central nervous system. Thus, the use of RNA interference approaches for the treatment of central nervous system diseases is limited.6,7,8
Quantum dots (QDs) are semiconductor inorganic nanoparticles. They can freely cross cell membranes and the blood-brain barrier.9,10 Modified QDs may become siRNA carriers. The unique spectroscopic properties of QDs are superior to organic fluorophores. The peak fluorescence of QDs can range from the visible to near infrared (>700 nm) by controlling the physical size and chemical composition of QDs. Therefore, QDs enable live-cell imaging and even deep tissue imaging in vivo. With QDs as siRNA carriers, we can trace events such as siRNA transport, membrane transfer, and escape from endosomes, allowing siRNA metabolism to be entirely visible. The broad excitation spectra and narrow emission spectra also make it easier to excite QDs compared to organic fluorophores. The resistance of QDs to photobleaching facilitates the elimination of autofluorescence interference from biological samples.11,12,13,14,15 Studies related to QDs as siRNA carriers have only just begun to emerge. Most of them were associated with tumor cell. Little is reported about QD–siRNA complexes used in nerve cells, particularly siRNA targeting BACE1 gene which is directly related to the treatment of AD. However, the siRNA transfection is much more difficult in the nerve cells than the tumor cells.16,17,18,19 The goals of this study were to estimate whether QD carriers could promote entry of siRNAs into nerve cells, and observe whether siRNA-coated QDs could escape from endosomes, and determine whether the siRNAs from non-packaged complexes could be widely distributed in cell bodies and nerve cell processes, and retain the gene silencing efficiency for the BACE1 gene.20,21
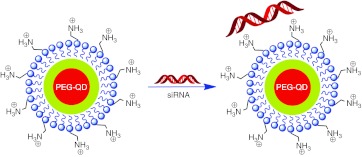
We developed CdSe/ZnS QDs by modification of the amphoteric polymer polyethylene glycol (PEG). In present study, PEG-QDs were for the first time bound to siRNAs to generate QD-PEG/siRNA complexes by electrostatic interaction (Figure 1), instead of covalent coupling, which has been used in several studies from other groups. We found that QD-PEG/siRNAs with a weak positive charge could significantly promote the transfection efficiency of siRNA. Furthermore, the positive charge of the “proton sponge” around PEG-QDs not only allowed QD-PEG/siRNAs to conveniently escape from the endosomes, but also easily released the siRNAs from the surface of PEG-QDs and sufficiently silenced the BACE1 gene, leading to the inhibition of Aβ synthesis. Our results showed several outstanding advantages as compared with other studies. For example, the QD–siRNA transfection efficiency had made significant breakthroughs in nerve cells, and RNA interference technology had made important progress in the treatment of AD. In addition, QD- and siRNA-binding mode, the relationship between QD–siRNA complexes and organelles, and “proton sponge effect” under transmission electron microscopy (TEM) were first reported. Therefore, the present study has important value in exploring the treatment of nervous disease. Detail understanding of QD carrier that influences the transfection efficiency of siRNA in nerve cells will open up novel therapeutic avenues for AD.
Figure 1.
Schematic illustration of the formation of QD-PEG/siRNAs complexes. QD-PEG, quantum dots-polyethylene glycol; siRNA, small interfering RNA.
Results
Characterization of QDs and PEG-QDs
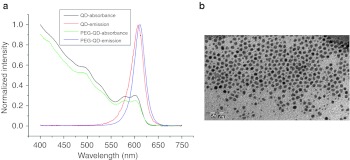
The method described here produced highly luminescent semiconductor QD (CdSe/ZnS)QDs with a CdSe-core and a ZnS shell, an emission wavelength of ~605 nm and a half-peak width just under 30 nm. The surface of the (CdSe/ZnS)QDs were then modified by DSPE-PEG2000 amine. The PEG not only provided free amine groups as a site for siRNA binding, but the outer hydrophilic groups enabled oil-soluble QDs into the water-soluble PEG-QDs, making it possible for water-soluble negatively charged siRNAs to bind positively charged PEG-QDs through electrostatic interaction. The potential of the water-soluble PEG-QD was +17.4 mV and the diameter was 84.2 nm. The PEG-QD showed a slight red shift in the emission wavelength of 610 nm, compared with oil-soluble QD at 605 nm (Figure 2a). TEM revealed that the PEG-QDs were ~5 nm in diameter, and well-distributed (Figure 2b).
Figure 2.
Characterization of QD and QD-PEG. (a) The optical absorption and emission spectra of QD and QD-PEG show that QD-PEG had a distinct red shift in an emission wavelength of 610 nm, compared with oil-soluble QD (605 nm). (b) The TEM image shows that QDs were monodisperse and 5 ± 2 nm in diameter (Bar = 50 nm). No aggregation was observed. QD-PEG, quantum dots-polyethylene glycol; TEM, transmission electron microscopy.
Assessment of QD-loads of siRNAs
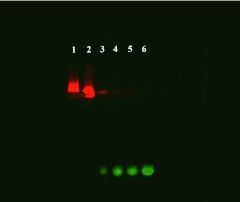
To determine the appropriate QD-loads of siRNAs, siRNAs were mixed with several concentrations of PEG-QDs at siRNA/PEG-QD ratios of 1:1, 1:10, 1:20 or 1:30. The dilutions of the QD/siRNA mixtures were then loaded from well 2 to well 5. The electrophoresis revealed that the green fluorescence (siRNAs) gradually increased from well 3 to well 6 (Figure 3), but the red fluorescence (PEG-QDs) was gradually attenuated from well 1 to well 5, suggesting that progressively decreasing QD concentrations resulted in an increase in free siRNAs among the mixtures, which tended to migrate to the anode. Importantly, the mixtures in well 2 migrated closer to the cathode than the pure PEG-QDs with a strong positive charge in well 1, suggesting that, at a 1:1 ratio, PEG-QDs and siRNAs were held together by an electrostatic interaction to form a complex structure. In addition, the excess weak positive charge of PEG-QDs, in addition to the positive charge for siRNA binding, also made them migrate slightly toward the cathode.
Figure 3.
Effective loading of siRNA with QD as determined by agarose gel electrophoresis. Lanes 2 to 5 correspond to a siRNA/PEG-QD ratios of 1:1, 1:10, 1:20, and 1:30. Lanes 1 and 6 correspond to QDs and a siRNA control, respectively. The green fluorescence intensities (siRNA) gradually increased from lanes 3 to lanes 6. In contrast, the red fluorescence intensities (PEG-QD) gradually attenuated from the lanes 1 to lanes 5, suggesting that a 1:1 ratio of PEG-QD and siRNA was the optimal proportion that provided a positive charge for cell binding and endosome escape. PEG, polyethylene glycol; QD, quantum dots; siRNA, small interfering RNA.
Quantification of the transfection efficiency of QD-PEG/siRNAs into cells
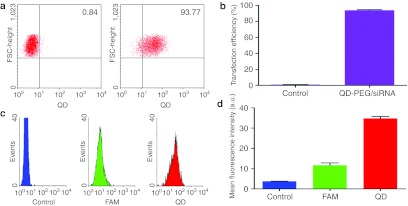
After a 1 hour transfection, 10,000 events for each sample were estimated using flow cytometry analysis to quantitatively evaluate the transfection efficiency of QD-PEG/siRNAs into SK-N-SH cells (Figure 4a,b). The number of transfected cells, 93.77 ± 1.18%, indicated that PEG-QDs carriers had greatly improved the transfection of siRNAs into nerve cells, compared with the control group (0.84 ± 0.19%, P < 0.05). Fluorescence-activated cell sorting analysis also showed that the fluorescence intensity of QD was threefold greater than carboxyfluorescein (FAM) at the same 20 pmol concentrations (Figure 4c,d).
Figure 4.
Quantification of the transfection efficiency of QD-PEG/siRNAs by FACS. After a 1 hour transfection, 10,000 events for each sample were estimated by flow cytometric analysis. (a) The non-transfected cells (left: control group) and transfected cells (right: transfection group of QD-PEG/siRNAs) were collected from dot plots defining a region around the main fluorescing population of QDs. A significant increase in transfected cells (93.77 ± 1.18%) indicated the novel improvement of transfection efficiency, compared with the control group (0.84 ± 0.19%). (b) The transfected and non-transfected cells were plotted on a histogram. (c,d) The histograms of the fluorescence intensity for QD-labeled cells (red line), siRNA-labeled cells (green line), and unlabeled cells (blue line) were generated; the histograms show that the fluorescence intensity of QD was threefold greater than that of siRNA at the same concentrations. a.u., arbitrary unit; FACS, fluorescence-activated cell sorting; FSC, forward scatter; PEG, polyethylene glycol; QD, quantum dots; siRNA, small interfering RNA.
Dynamics associated with QD-PEG/siRNAs
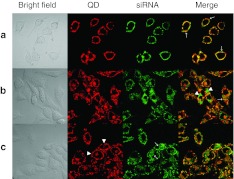
In the early stage after QD-PEG/siRNA transfection into SK-N-SH cells, confocal images revealed that both red labels (PEG-QD) and green labels (siRNAFAM) rapidly aggregated onto the cell membrane and migrated into the cells. At this instance, labels became scattered green-fluorescent and red-fluorescent spots. Forty-five minutes after transfection, two color labels gradually merged with each other into an intact fluorescence ring corresponding to cell morphology in orange color and located at the inner surface of the cell membrane (Figure 5a). To test whether the transport of siRNAs into cells was mediated by PEG-QDs, free siRNAs were incubated with SK-N-SH cells alone. Fluorescence was not observed within the cells, suggesting that siRNA migration into the cells had to be mediated by PEG-QDs in the form of QD-PEG/siRNAs complexes (data not shown). After 1.5 hours incubation, red and green labels were colocalized and retained the cytoplasmic distribution of well-spread shapes, which might be considered to be QD-PEG/siRNAs packed into different stages of endosomes (Figure 5b). Approximately 5 hours after incubation, red and green fluorescence changes were accompanied by two main characteristics: green labels separated from red ones, but only in bright single fluorescence, and red labels migrated to the cell membrane in the opposite direction, which might be responsible for the electrolytic dissociation of siRNAs and PEG-QDs. When visualizing fluorescent images at later stages, 7 hours after exposure to QD-PEG/siRNAs, SK-N-SH cells showed clear fluorescence alterations. Green and red fluorescence were almost completely isolated; while green fluorescence became more and more widely dispersed in the entire cytoplasm, red fluorescence was isolated to the beginning stages of transfection, i.e., they were located under the cell membrane again (Figure 5c). In SK-N-SH cells cultured for 10 days, the laser scanning confocal microscope (LSM) images showed that cells extended many neurites that contained a number of QDs under the axomembrane and siRNAs within the axoplasm after QD-PEG/siRNAs transfection (Figure 6). However, it was unclear where these QDs and siRNAs originated, whether from the direct internalization of the axomembrane or by transportation from soma to neurites. In the neurites, however, QDs were also isolated from siRNAs, and QDs were reverted to the axomembrane, similar to the soma.
Figure 5.
LSM images of cell transfection and dynamics. To estimate the spatiotemporal distribution of QD-PEG/siRNAs, real-time images of confocal microscopy were obtained. siRNAs (green fluorescence) from the QD-PEG/siRNAs complex were detected at 488 nm, while QDs (red fluorescence) from QD-PEG/siRNA was recorded at a 605 nm. (a) Forty-five minutes after transfection, QD-PEG/siRNAs were transported into SK-N-SH cells and generated fluorescence rings on the inner surface of the cell membrane, shown in orange in the merged picture (arrow). (b) After 1.5 hours, red and green labels were colocalized (shown in orange) and retained the cytoplasmic distribution in the merged picture (arrowhead), i.e., they were still QD-PEG/siRNA complexes. However, some complexes did separate into QDs and siRNAs, meaning that the green label (arrow) separated from the red one. (c) After 7 hours, green and red labels were almost completely isolated from one another. Green labels were widely dispersed in almost entire cytoplasm (arrow), but red labels were located under the cell membrane (arrowhead). Bar = 10 µm. PEG, polyethylene glycol; QD, quantum dots; siRNA, small interfering RNA.
Figure 6.
LSM images of SK-N-SH cells cultured for 10 days. (a) siRNAs were released from QDs and retained their cytoplasmic distribution (arrow). (b,c) The cells sent out many neurites which contained a number of QDs under the axomembrane (arrow) and siRNAs within the axoplasm (arrowhead) after QD-PEG/siRNAs transfection. PEG, polyethylene glycol; QD, quantum dots; siRNA, small interfering RNA.
Cellular ultrastructural response to QD-PEG/siRNAs
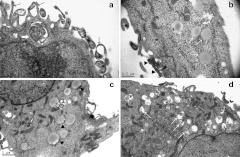
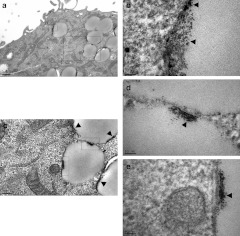
To study the cellular ultrastructural response to QD-PEG/siRNAs, cells were fixed at different time-points during the LSM procedure and were evaluated with TEM. Shortly after QD-PEG/siRNAs were transfected into SK-N-SH cells, the high density QDs aggregated onto the surface of the cells. Soon afterwards, SK-N-SH cells extended many cell filopodia toward a cluster of QDs and enveloped them (Figure 7a). Forty-five minutes after transfection, SK-N-SH cells simultaneously phagocytized a large number of QDs and gradually moved away from the cell membrane to become endosomes wrapped by bilayer lipid membranes (Figure 7c). At ~1.5 hours, a wide cytoplasmic distribution of endosomes was observed. There were two typical types of endosomes in the cytoplasm. The first, lipid droplets, were early endosomes containing clusters of QDs, and no other cell component at the edge of lipid droplets. The second, transparent droplets were late endosomes that included a large number of QDs that were randomly dispersed in droplets (Figure 7b,d). In addition to QDs, there was also cell debris in transparent droplets (Figure 8). Five hours after transfection, for the first time, we accurately recorded the intracellular processes of “proton sponge effect” and “endosome escape” with TEM at the ultrastructural level (Figure 9). The bilayer plasma membranes of many endosomes happened to rupture in several parts and resulted in a stream-like outflow of QDs, which spilled along the ruptures and remained as a clear lane of QDs at a final magnification of ×230,000. From this point onwards, a large number of QDs were widely distributed throughout the cytoplasm, suggesting that QDs, due to the proton sponge effect, had successfully escaped from the endosomes. Seven hours after transfection, the QDs returned and were located below the cell membrane.
Figure 7.
Detection of cell ultrastructure with TEM after transfection. (a) SK-N-SH cells extended many cell filopodia toward a cluster of QDs (arrow) and simultaneously enveloped and phagocytized them (empty arrow). (b) The early endosomes (white arrow) are characterized as lipid droplets in the cytoplasm. The clusters of QDs were being phagocytized (arrowhead). (c) The early endosomes contained clusters of QDs at their edge (arrowhead). (d) The late endosomes resemble transparent droplets that include QDs and cell debris dispersed in the cytoplasm (white arrow). QD, quantum dots; TEM, transmission electron microscopy.
Figure 8.
Observation of QDs within endosomes by TEM at high magnification. (a) There were several early endosomes that contained clusters of QDs at their edge. Rectangle B and C are magnifications into b and c, respectively. (b) QDs within endosomes were recorded at a final magnification of ×230,000 (arrowhead). (c):This figure originates from rectangle C in a, rectangle D and E in c are further magnified. (d,e) Both the figures from c show that a spatial resolution of 0.1 nm is achieved via TEM on the clusters of QDs inside the endosomes (arrowhead). QD, quantum dots; TEM, transmission electron microscopy.
Figure 9.
Ultrastructural images of the “proton sponge effect” and “endosome escape”. (a) The endosomes in the cytoplasm contained QDs and cell debris. Rectangle B in a is magnified in b. (b) The bilayer plasma membrane of endosomes was ruptured in several parts (arrow), the outflow of QDs spilled along the ruptures and remained as a lane of QDs (left, white arrowhead). Subsequently, particles with a high density of QDs were homogeneously distributed in the cytoplasm (black arrowhead). Large and small endosomes joined together and a channel observed between them at a high density of QDs (right, white arrowhead). (c): The upper half of a large endosome is shown in b. The nano-sized spots indicated the locations of single QDs and/or larger clusters of QDs (black arrowhead) from an endosome rupture in the cytoplasm (arrow). QD, quantum dots.
Gene silencing efficiency of QD-PEG/siRNAs complexes
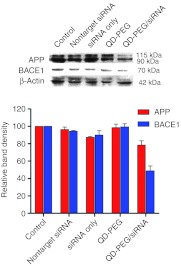
The expression levels of BACE1 and APP were examined by western blot. The level of BACE1 expression was reduced to 49.0 ± 8% by the QD-PEG/siRNAs complex, 94.3 ± 1% by nontarget siRNA, 89.9 ± 7% by siRNA only, and 99.4 ± 5% by QD-PEG only. Using QD-PEG/siRNA complexes in which the siRNA against BACE1, we achieved gene silencing efficiency of almost 51% in SK-N-SH cells. There was a statistically significant difference (P < 0.05) between QD-PEG/siRNA transfected and siRNA-transfected and -untransfected cells (Figure 10), indicating that QD-PEG/siRNA complexes via electrostatic interaction did not affect the activities of gene silencing of siRNAs, in other words, siRNAs among QD-PEG/siRNA complexes could significantly reduce BACE1 expression. After transfection of the QD-PEG/siRNAs complex, the expression of APP proteins was reduced to 78.4 ± 6% by QD-PEG/siRNAs complex, 96.3 ± 4% by nontarget siRNA, 87.3 ± 1% by siRNA only, and 98.7 ± 6% by QD-PEG only.
Figure 10.
Gene silencing efficiency of the QD-PEG/siRNAs complex. Suppression of BACE1 protein expression evaluated by western blot analysis. The level of BACE1 expression was reduced to 49.0 ± 8% by the QD-PEG/siRNA complex, 94.3 ± 1% by nontarget siRNA, 89.9 ± 7% by siRNA only, and 99.4 ± 5% by QD-PEG only. The expression of BACE1 protein was significantly downregulated compared with control, siRNA only, and QD-PEG only (P < 0.001). After transfection the QD-PEG/siRNAs complex, the expression of APP proteins was reduced to 78.4 ± 6% by QD-PEG/siRNAs complex, 96.3 ± 4% by nontarget siRNA, 87.3 ± 1% by siRNA only, and 98.7 ± 6% by QD-PEG only. PEG, polyethylene glycol; QD, quantum dots; siRNA, small interfering RNA.
Cell viability
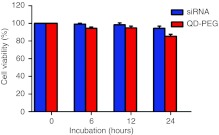
Cell viability was evaluated by the 3-(4,5-dimethylthiazol-2-yl)-2,5-diphenyltetrazolium bromide (MTT) assay in human SK-N-SH cells. PEG-QDs did not result in a statistically significant change (Figure 11), as cell viability was 94.4 ± 1.5% 6 hours after transfection by PEG-QDs, compared to 99.2 ± 1.0% in siRNA incubation conditions. PEG-QDs exhibited the same trend of siRNAs after 12 hours, for instance, the MTT assay showed a slight reduction in cell number, i.e., 98.4 ± 2.1% in siRNAs and 94.8 ± 2.0% in PEG-QD incubation. Although PEG-QDs caused the time-dependent changes in cell number 24 hours after transfection, cell viability was still higher than 85% (85.4 ± 2.3%), compared to siRNA incubation (94.4 ± 2.5%), indicating that PEG-QDs demonstrate excellent biocompatibility.
Figure 11.
Cytotoxicity of QD-PEG at their optimal transfection concentration after incubation for 24 hours for the MTT assay. The values represent percentages of cell survival (means ± SD, n = 3). PEG, polyethylene glycol; QD, quantum dots; siRNA, small interfering RNA.
Discussion
Recently, the unique optical properties of QDs and the characteristics of siRNA carriers have attracted a great deal of attention. Several studies have shown the application prospect of QDs as siRNA carriers in the treatment of diseases.14,22,23 Owing to the poor efficacy of siRNA transfection into nerve cells, we expected that PEG-modified QDs might serve as ideal siRNA carriers for promoting and improving siRNA transfection into nerve cells. Due to the small in size of QD's ranging between 2 and 10 nm in diameter, they are capable of penetrating the nerve cell membrane. In addition, QDs possess unique optical properties, such as near infrared spectrum (>700 nm) and good photostability or high resistance to photobleaching. Thus, QDs are good biological markers inside living organisms. Furthermore, unlike organic fluorophores, the narrow emission spectra of QDs are independent of the wavelength of the excitation light, which makes it easier to excite QDs to luminescence and obtain much brighter fluorescence than that produced by traditional organic fluorophores that require a specific excitation wavelength. Subsequently, the wavelength of the emitted photons of QDs can be controlled by the QD's particle size and composition, resulting in tunable fluorescence signatures and multiplexing capabilities along with large Stokes shifts. More importantly, due to a high surface to volume ratio, the surface of the QDs can easily be made functional by binding biological macromolecules such as siRNAs, monoclonal antibodies, and peptides to develop multifunctional QD. Multifunctional QDs may have the potential to meet the requirements of targeting and specificity for brain delivery.
In present study, we have developed CdSe/ZnS QDs. It is generally recognized that QD are more prone to aggregation due to their smaller particle, higher surface to volume ratio, and stronger surface activity. However, TEM image shows the QD are well-dispersed, almost no aggregation. However, in order to better disperse particles in specified solvent, we had used the inorganic nucleation/organic inclusion, i.e., semiconductor particles (CdS/ZnS) as major functional components and amphoteric polymer polyethylene (PEG) as organic parcels which forms coordination bonds with the cation at its end to prevent particle aggregation, and at other end, PEG with specific groups (NH4) make it easy to disperse particles into the water solvent. At present, several coupling approaches have commonly been used for QDs and siRNAs, such as covalent coupling, thiol exchange and nonspecific adsorption. Although these approaches can generate QD–siRNA complexes, sometimes their combinations are highly unstable or it is difficult to dissociate QDs from siRNAs. The QDs in this study are modified with amino-PEG, which is a linear polymer with hydrophilic and hydrophobic side chains. The inner hydrophobic domains bind to TOPO on the surface of QD via multivalent hydrophobization, and the outer hydrophilic groups enable oil-soluble QD into water-soluble QD, leading to the formation of biocompatible inorganic nano-polymers (PEG-QDs). The positive charge of amino groups on the surface of PEG is bound to negatively charged siRNA by electrostatic adsorption to generate QD-PEG/siRNA complexes with the optimal ratio of approximately one PEG-QD to one siRNA. The zeta potential measurements show that PEG-QD has a zeta potential of 17.4 mV before siRNA binding, and it reduces to 14.2 mV after siRNA binding to PEG-QD at a 1:1 ratio because negatively charged siRNA partially neutralizes the positive charge on the PEG-QD surface. The excess positive charge of amino groups may also integrate with the negative charge on the surface of SK-N-SH cells for promoting QD-PEG/siRNA complexes into cells. Compared with covalent coupling between QD-PEG and siRNA, as reported by others,24,25 the electrostatic adsorption facilitates cellular entry. In present study, SK-N-SH cells are a neuroblastoma cell line. They not only have a variety of neuronal markers and characteristics of neurons, but they have some cell properties associated with AD, e.g., the expression of BACE1 gene, etc. On the other hand, SK-N-SH cells can also make up for the shortcomings of neurons that are the finally differentiated cells, shorter survival in vitro and without proliferate. Therefore, SK-N-SH cell line becomes an ideal target cells in the study of neurodegenerative diseases such as AD.26,27 We quantitatively evaluated the transfection efficiency of QD-PEG/siRNA complexes via flow cytometry and discovered that the transfection efficiency was significantly increased by 93.77 ± 1.18%, and QD-PEG/siRNA complexes were widely distributed in cell bodies and their processes. Considering that a large number of siRNAs were observed within SK-N-SH cells, we believe that the QD-PEG/siRNA complexes reported here might serve as ideal carriers for the delivery of siRNAs into nerve cells, compared with previous reports from our laboratory and other in which siRNAs were transfected with Lipofectamine 2000 or viral vectors. Although the mechanism by which QD-PEG/siRNA complexes so dramatically increased transfection efficiency is unknown, several lines of evidence attribute it to the nanoparticle's small diameter and unique binding to siRNAs via electrostatic interaction. CdSe/ZnS QDs are ~5 nm in diameter. After the QDs are modified by PEG, their diameter is only 84.5 nm, they still possess a strong potential for penetrating cell membranes. Furthermore, the positively charged proton sponge around each QD-PEG/siRNA could improve the transfection efficiency through nonspecific adsorption on the cell surface. In our previously published studies, a variety of transfection methods including cationic lipid, viral vectors, electroporation, etc. had been used in the experiments to improve siRNA transfection for nerve cells, but the results left much to be desired. A generally accepted reason is that nerve cells prevent siRNAs through the cell membrane. Since the use of QD carrier, the transfection efficiency of siRNA was significantly improved by 93%. Therefore, we considered that QD–siRNA complexes have an important role in the improvement of siRNA transfection, and our study would be beneficial for overcoming major obstacles to siRNA transfection into nerve cells. Our findings were consistent with those of Li's studies using QD–siRNA complexes.28 Li et al. modified the surface of QDs with L-arginine or β-CD-L-arginine. The positively charged surface of L-Arg-QD or β-CD-L-Arg-QD electrostatically adsorbed negatively charged siRNAs. They found that L-Arg-QD-siRNA or β-CD-L-Arg-QD-siRNA could efficiently delivered siRNA into cells, and obtained high gene silencing efficiency for HPV18 E6 gene. However, their experiments were completed in tumor cells such as HeLa cells, unlike our studies in nerve cells. Therefore, we thought that our study would be beneficial for overcomeing major obstacles to siRNA transfection into nerve cells.
After QD-PEG/siRNAs were endocytosed into SK-N-SH cells, the clustered tertiary amines grafted on a polymer backbone are protonated within acidic endosomes (pH 5–6), whereas they are deprotonated in the alkaline cytoplasm (pH 7.35–7.45). The protonated tertiary amines in the endosomes can cause a net influx of chloride ions, resulting from their strong proton absorbing capabilities, leading to rapid osmotic swelling and rupture of the endosomes, a phenomenon known as the “proton sponge effect”. At this time, the QD-PEG/siRNA complexes can escape from the endosomes into the cytoplasm, followed by siRNA release from the PEG-QD surface and unpacking of the QD-PEG/siRNA complexes in the cytoplasm. Subsequently, free siRNAs accumulate in the cytoplasm, and efficient gene silencing is achieved by combining with BACE1 messenger RNA and forming the RNA-induced silencing complex. Because of the short half-life of BACE1 protein, it is rapidly degraded after synthesized. Its change in RNA level will be quickly seen as change in protein level. Western blot revealed that the expression of the BACE1 gene was reduced by 49.0 ± 8% in the group transfected with QD-PEG/siRNAs, 94.3 ± 1% with nontarget siRNA, 89.9 ± 7% with targeting siRNA alone, and 99.4 ± 5% with QD-PEG alone, demonstrating that BACE1 proteins were significantly downregulated. Although the inhibition rate of QD-PEG/siRNAs seems to be not high enough as compared with other studies involved in cancer cells, this may be attributed to the following reasons. In present study, SK-N-SH cells did not overexpress APP protein, unlike cancer cells that overexpress some particular proteins. In normal condition, BACE1 is widely distributed in a variety of cells in the body, and it has other substrates except APP protein. If BACE1 expression would be completely inhibited, the secondary damage may occur. AD needs long-term treatment in the clinical, so it will result in more severe side effects. Furthermore, some studies had shown that, as long as part of the BACE1 gene was inhibited, Aβ levels could be decreased by 30–50%, and when the amount of Aβ generation is decreased by 20–30%, enough to slow down the pathological process and delay the onset of symptomatic AD. Therefore, there is no need to completely inhibit Aβ generation for the treatment of AD. In the present study, PEG-modified QDs not only retained the inhibitory activity of siRNAs upon the expression of BACE1 gene, but PEG-modified QDs had another advantage over other modifications, namely amino groups on the surface of PEG could provide sufficient binding sites for biological macromolecules such as siRNAs, monoclonal antibodies, peptides, oligonucleotides, etc, which would facilitate the production of multifunctional nanoparticles for the treatment of central nervous diseases in the future.29,30
At present, little is known about the intracellular events of QDs as carriers of siRNA at the ultrastructural level. However, the TEM images presented in this study showed the intracellular localization of QDs and the migration of single QD. We detected a phagotrophic mechanism in SK-N-SH cells: SK-N-SH cells first extended many cell filopodia, packed up QD-PEG/siRNAs and phagocytized them, and gradually moved away from the cell membrane to become endosomes. These findings were not in agreement with observations from other investigators (e.g., plasma membrane invagination).31,32 We also found that the bilayer plasma membrane of endosomes was ruptured, a large number of QDs overflowed along the ruptures, and subsequently, QDs were homogeneously distributed in the cytoplasm. This is the first evidence of the “proton sponge effect” at the ultrastructural level. Some researchers have suggested that QDs may eventually be precipitated within the cells, which would result in cytotoxicity because of their nonspecific absorption of biological molecules and catalysis of peroxidation reactions.33,34 However, our study showed that QDs were aggregated and located near the cell membrane after separation from siRNAs in the cytoplasm, suggesting that they were not widely involved in cell metabolism. To accurately evaluate the cytotoxicity of PEG-QDs, cell viability was assessed using the MTT colorimetric assay. The ability of cells to reduce MTT provides an indication of the mitochondrial integrity and activity. PEG-QDs in the present study did not cause statistically significant changes at different incubation conditions. Although PEG-QDs caused a time-dependent decrease in cell number, the cell viability was still higher than 85% after 24 hours transfection, suggesting that the biodegradable PEG polymer coating layer may protect QDs from being exposed to the intracellular environment and restraint the release of toxic Cd2+ ions from QDs, This indicates that the PEG-QDs developed in this study demonstrate excellent biocompatibility.
Conclusions
We have developed CdSe/ZnS QDs with an amino-PEG modification (PEG-QDs). PEG-QDs have shown excellent biocompatibility. We first reported that the QD–siRNA nanoplexes targeting the AD-associated BACE1 gene were generated by the electrostatic interaction between PEG-QDs and siRNAs. QD-PEG/siRNA complexes dramatically increased the transfection efficiency of siRNAs. The positively charged proton sponge around each QD-PEG/siRNA was not only conducive to QD-PEG/siRNA escape from the endosome, but siRNAs could timely dissociate from PEG-QD and retain the gene silencing efficiency for the BACE1 gene in the cytoplasm, leading to the inhibition of Aβ synthesis. We revealed the dynamics and mechanisms of cellular uptake of QD-PEG/siRNAs and obtained the cell ultrastructural evidence of a QD delivery system as a carrier of siRNAs. Here, we have developed a novel method of siRNA delivery into nerve cells, which plays an important role in monitoring siRNA delivery and may hold promise for the treatment of neurodegenerative diseases such as AD.
Materials and Methods
Materials. QD with emission maxima of 605 nm and modified with DSPE-PEG2000 amine were obtained through a collaboration with Wuhan Jiayuan Quantum Dots (Wuhan, China). The FAM fluorescence-labeled siRNAs targeting the BACE1 gene and mismatched siRNA control were purchased from GenePharma (Shanghai, China). Dulbecco's modified Eagle's medium (DMEM) and fetal bovine serum were obtained from Gibco (Grand Island, NY). SK-N-SH cells (human neuroblastoma cell line) were obtained from the Center for Experimental Animals of Sun Yat-sen University (China). The transfection efficiency of QD-PEG/siRNAs was detected with flow cytometry (BD, Franklin Lakes, NJ). The fluorescence images were obtained with a laser confocal scanning microscope (Zeiss LSM 710; Carl Zeiss, Jena, Germany). A transmission electron microscope (FEI Tecnai 12; FEI, Eindhoven, The Netherlands) was used to obtain cell ultrastructural images. Unless specified, all of the commercial products were used without further purification.
Production and surface modification of QDs. The core/shell of (CdSe/ZnS)QDs were prepared as described previously.35,36 Briefly, CdO (0.2 mmol) and stearic acid (0.8 mmol) were mixed and heated to 150 °C under Ar flow. After CdO was completely dissolved, TOPO (3.88 g) and hexadecylamine (3.88 g) were added to the mixture above and then heated to 320 °C until a clear solution was formed. An equimolar amount of Se was injected into the clear solution, and the temperature was immediately adjusted to 290 °C to generate the QDs. Dimethlyzinc and hexamethyldisilathiane was slowly added to the dots to form a ZnS shell covering the CdSe-core to finally obtain (CdSe/ZnS)QDs. According to the reference 37, 50 mg DSPE-PEG2000 amine, dissolved in 2 ml chloroform, and 2.5 mg (CdSe/ZnS)QDs, purified by centrifugation, were added into the solution. PEG-QD complexes were dried, and the organic solvent was removed. Two milliliters of 0.05 mol/l borate buffer solution (pH 8.4) was added and dissolved by ultrasonic methods. Shimadzu 1601 (Shimadzu, Kyoto, Japan) and Hitachi F-4500 (Hitachi, Tokyo, Japan) spectrophotometers were used to identify the optical properties of QDs and PEG-QDs, a TEM was used to determine particle size.
Sequences of siRNAs against the human BACE1 messenger RNA. According to the effective sequence in our previous study, the siRNA sequences against the human BACE1 messenger RNA and mismatched siRNA control, including sense and antisense strands, were as follows: siRNA-1359, 5′-CACUUAUGACCAUAGCCUATT-3′ (sense) and 5′-UAGGCUAUGGUCAUAAGUGTT-3′ (antisense); mismatched siRNA, 5′-UUCUCCGAACGUGUCACGUTT-3′ (sense) and 5′-ACGUGACACGUUCGGAGAATT-3′ (antisense). The siRNAs were labeled by FAM green fluorescence at the 5′ end of the sense strand (siRNAFAM).
Gel motility assay to measure siRNA loading capacity. To determine the best concentration of QD for siRNAs loadings, siRNA (10 pmol) and PEG-QDs (10, 1, 0.5 or 0.33 pmol), diluted in borate buffer to a molar ratios of 1:1, 10:1, 20:1 or 30:1, respectively, were incubated for 20 minutes at room temperature to produce QD-PEG/siRNA complexes. All samples were tested by 0.5% agarose gel electrophoresis. Multicolor gel images were used to quantify the appropriate proportion of PEG-QD and siRNA using the AlphaImage 2000 Documentation and Analysis System (Alpha Innotech, San Leandro, CA).
Cell culture and transfection with QD-PEG/siRNAs. SK-N-SH cells were cultured in DMEM containing 10% fetal bovine serum, 100 U/ml penicillin, and 100 µg/ml streptomycin. Cells were incubated at 37 °C in a 5% CO2 incubator at 95% humidity. Cells (1 × 10⁵) were plated into 35 mm glass bottom dishes (MatTek, Ashland, MA) and grown to 60–80% confluence for transfection experiments. On the day of transfection, cultured cells were washed with phosphate-buffered saline (PBS) and preincubated with fresh serum-free DMEM media for 30 minutes. The QD-PEG/siRNAs complexes were prepared by mixing PEG-QDs and siRNAs in serum-free media to achieve a siRNA/QD molar ratio of 1:1, incubated for 20 minutes at room temperature and added into each well at a final concentration of 40 nmol/l.
Flow cytometry analysis. To quantitatively examine the transfection efficiency of QD-PEG/siRNAs complexes, flow cytometric analysis was conducted. After SK-N-SH cells were transfected with QD-PEG/siRNAs and incubated for 1 hour at 37 °C, the cells were washed with PBS, trypsinized, and centrifuged at 1,000 rpm for 5 minutes. Ten thousand cells were suspended in 500 µl PBS for flow cytometry (fluorescence-activated cell sorting) analysis. The transfection efficiency of QD-PEG/siRNAs was monitored by fluorescence-activated cell sorting and performed in triplicate. The data were analyzed using the flow cytometry software WinMDI 2.9. (TSRI Flow Cytometry Core Facility, La Jolla, CA)
Detection of cell dynamics through LSM. To acquire a fluorescence signal for PEG-QD (emission: 610 nm), each sample was excited by ultraviolet light. A fluorescence signal of FAM-siRNA was detected at 520 nm after excitation at 488 nm. After cells were transfected with 40 nmol/l QD-PEG/siRNAs, cell dynamics were detected by laser confocal scanning microscopy in real-time for 7 hours. The same microscope settings (laser power, filters, detector gain, and amplification gain) were used for treated and control samples.
Observation of cell ultrastructure with TEM. After the QD-PEG/siRNAs were added into the cell culture to a final concentration of 40 nmol/l, the transfection experiments were stopped at the expected time point for corresponding LSM images. The cells were washed three times with PBS and centrifuged at 1,000 rpm for 5 minutes. The cells were fixed with 1 mol/l glutaraldehyde, diluted in 0.1 mol/l Na-cacodylate buffer at pH 7.3 for 3 hours at 4 °C, and postfixed in 1% osmium tetroxide diluted in 0.1 mol/l Na-cacodylate buffer for 45 minutes. After washing with 0.1 mol/l Na-cacodylate buffer, the cells were dehydrated in gradual concentrations of acetone and embedded in Araldite resin. The samples were cut into 60 nm ultrathin sections, mounted onto square 400 mesh copper grids, and finally, stained with uranyl acetate and lead citrate. The changes of the cell ultrastructure were observed under TEM.
Western blotting. The protein levels of BACE1 and APP were evaluated by western blot analysis. Proteins were extracted from transfected cells and controls and quantitated by the BCA protein assay reagent (Pierce, Rockford, IL). Equal amounts of total protein (30 µg) were loaded per lane and separated by an 8% SDS-Tris glycine polyacrylamide gel. Proteins were transferred to polyvinylidene fluoride membranes and blocked for 1 hour with PBS/0.05% Tween/5% milk. The polyvinylidene fluoride membranes were incubated with antibody (BACE1 polyclonal antibody (1:1,000): AB5940; Millipore (Billerica, MA); APP monoclonal antibody (1:2,000): catalog number 1565-1; Epitomics (Burlingame, CA); β-actin monoclonal antibody (1:1,000): Abcam (Cambridge, MA)) at 4 °C overnight, washed in TBST (Tris-Buffered Saline Tween 20), and detected by a horseradish peroxidase-conjugated goat antirabbit secondary antibody (1:4,000) (Abcam) at room temperature for 1 hour followed by treatment with the electrochemiluminescent detection system. Quantitative analysis was performed using Labworks image analysis software (UVP, Upland, CA) and analyzed for statistical significance.
MTT assay. Cell viability was assessed using the MTT colorimetric assay. Briefly, SK-N-SH cells were seeded at a density of 1 × 10³ cells/well in 96-well plates and cultured overnight in 100 µl of DMEM containing 10% fetal bovine serum at 37 °C. The optimal dose of PEG-QDs and siRNA were diluted in DMEM and incubated for 24 hours. Afterwards, 100 µl of serum-free growth medium was replaced in each well and 10 µl of MTT solution (5 mg/ml) in PBS buffer was added. Subsequently, the cells were incubated for another 4 hours, followed by the addition of 150 µl dimethyl sulfoxide into each well. After gentle agitation for 8 minutes, the absorbance of each well at 570 nm was recorded on a Tecan Sunrise Multimode plate reader (Tecan, Groedig, Austria). All experiments were conducted in triplicate.
Statistical analysis. All data were analyzed for significance by a one-way analysis of variance and t-test for comparisons between the two groups using the SPSS software package (SPSS, Chicago, IL). In all statistical analyses, P < 0.05 was regarded as statistically significant. All values are presented as the means ± SD.
Acknowledgments
We thank Wuhan Jiayuan Quantum Dots Co., Ltd. for their technical support. We are also grateful to Jinlang Wu, Department of Electron Microscopy, Zhongshan School of Medicine, Sun Yat-sen University for their assistance with TEM image acquisition. This research was supported by a grant from the National Natural Science Foundation of China (No. 30572081).
References
- Hardy J., and, Selkoe DJ. The amyloid hypothesis of Alzheimer's disease: progress and problems on the road to therapeutics. Science. 2002;297:353–356. doi: 10.1126/science.1072994. [DOI] [PubMed] [Google Scholar]
- Selkoe DJ. Alzheimer's disease: genes, proteins, and therapy. Physiol Rev. 2001;81:741–766. doi: 10.1152/physrev.2001.81.2.741. [DOI] [PubMed] [Google Scholar]
- Gonzalez-Alegre P. Therapeutic RNA interference for neurodegenerative diseases: From promise to progress. Pharmacol Ther. 2007;114:34–55. doi: 10.1016/j.pharmthera.2007.01.003. [DOI] [PubMed] [Google Scholar]
- Singer O, Marr RA, Rockenstein E, Crews L, Coufal NG, Gage FH.et al. (2005Targeting BACE1 with siRNAs ameliorates Alzheimer disease neuropathology in a transgenic model Nat Neurosci 81343–1349. [DOI] [PubMed] [Google Scholar]
- Laird FM, Cai H, Savonenko AV, Farah MH, He K, Melnikova T.et al. (2005BACE1, a major determinant of selective vulnerability of the brain to amyloid-β amyloidogenesis, is essential for cognitive, emotional, and synaptic functions J Neurosci 2511693–11709. [DOI] [PMC free article] [PubMed] [Google Scholar]
- Bumcrot D, Manoharan M, Koteliansky V., and, Sah DW. RNAi therapeutics: a potential new class of pharmaceutical drugs. Nat Chem Biol. 2006;2:711–719. doi: 10.1038/nchembio839. [DOI] [PMC free article] [PubMed] [Google Scholar]
- Reynolds A, Leake D, Boese Q, Scaringe S, Marshall WS., and, Khvorova A. Rational siRNA design for RNA interference. Nat Biotechnol. 2004;22:326–330. doi: 10.1038/nbt936. [DOI] [PubMed] [Google Scholar]
- Wullner U, Neef I, Tur MK., and, Barth S. Targeted delivery of short interfering RNAs–strategies for in vivo delivery. Recent Pat Anticancer Drug Discov. 2009;4:1–8. doi: 10.2174/157489209787002506. [DOI] [PubMed] [Google Scholar]
- Xu G, Yong KT, Roy I, Mahajan SD, Ding H, Schwartz SA.et al. (2008Bioconjugated quantum rods as targeted probes for efficient transmigration across an in vitro blood-brain barrier Bioconjug Chem 191179–1185. [DOI] [PubMed] [Google Scholar]
- Liu L, Guo K, Lu J, Venkatraman SS, Luo D, Ng KC.et al. (2008Biologically active core/shell nanoparticles self-assembled from cholesterol-terminated PEG-TAT for drug delivery across the blood-brain barrier Biomaterials 291509–1517. [DOI] [PubMed] [Google Scholar]
- Michalet X, Pinaud FF, Bentolila LA, Tsay JM, Doose S, Li JJ.et al. (2005Quantum dots for live cells, in vivo imaging, and diagnostics Science 307538–544. [DOI] [PMC free article] [PubMed] [Google Scholar]
- Alivisatos P. The use of nanocrystals in biological detection. Nat Biotechnol. 2004;22:47–52. doi: 10.1038/nbt927. [DOI] [PubMed] [Google Scholar]
- Chan WC, Maxwell DJ, Gao X, Bailey RE, Han M., and, Nie S. Luminescent quantum dots for multiplexed biological detection and imaging. Curr Opin Biotechnol. 2002;13:40–46. doi: 10.1016/s0958-1669(02)00282-3. [DOI] [PubMed] [Google Scholar]
- Gao X, Cui Y, Levenson RM, Chung LW., and, Nie S. In vivo cancer targeting and imaging with semiconductor quantum dots. Nat Biotechnol. 2004;22:969–976. doi: 10.1038/nbt994. [DOI] [PubMed] [Google Scholar]
- Zrazhevskiy P., and, Gao X. Multifunctional Quantum Dots for Personalized Medicine. Nano Today. 2009;4:414–428. doi: 10.1016/j.nantod.2009.07.004. [DOI] [PMC free article] [PubMed] [Google Scholar]
- van der voort HTM., and, Strasters KC. Restoration of confocal images for quantitative image analysis. J Microsc. 1995;178:165–181. [Google Scholar]
- Zhang LW., and, Monteiro-Riviere NA. Mechanisms of quantum dot nanoparticle cellular uptake. Toxicol Sci. 2009;110:138–155. doi: 10.1093/toxsci/kfp087. [DOI] [PubMed] [Google Scholar]
- Buono C, Anzinger JJ, Amar M., and, Kruth HS. Fluorescent pegylated nanoparticles demonstrate fluid-phase pinocytosis by macrophages in mouse atherosclerotic lesions. J Clin Invest. 2009;119:1373–1381. doi: 10.1172/JCI35548. [DOI] [PMC free article] [PubMed] [Google Scholar]
- Nabiev I, Mitchell S, Davies A, Williams Y, Kelleher D, Moore R.et al. (2007Nonfunctionalized nanocrystals can exploit a cell's active transport machinery delivering them to specific nuclear and cytoplasmic compartments Nano Lett 73452–3461. [DOI] [PubMed] [Google Scholar]
- Brandenberger C, Clift MJ, Vanhecke D, Mühlfeld C, Stone V, Gehr P.et al. (2010Intracellular imaging of nanoparticles: is it an elemental mistake to believe what you see Part Fibre Toxicol 715. [DOI] [PMC free article] [PubMed] [Google Scholar]
- Derfus AM, Chen AA, Min DH, Ruoslahti E., and, Bhatia SN. Targeted quantum dot conjugates for siRNA delivery. Bioconjug Chem. 2007;18:1391–1396. doi: 10.1021/bc060367e. [DOI] [PubMed] [Google Scholar]
- Lee JS, Green JJ, Love KT, Sunshine J, Langer R., and, Anderson DG. Gold, poly(beta-amino ester) nanoparticles for small interfering RNA delivery. Nano Lett. 2009;9:2402–2406. doi: 10.1021/nl9009793. [DOI] [PMC free article] [PubMed] [Google Scholar]
- Wu X, Liu H, Liu J, Haley KN, Treadway JA, Larson JP.et al. (2003Immunofluorescent labeling of cancer marker Her2 and other cellular targets with semiconductor quantum dots Nat Biotechnol 2141–46. [DOI] [PubMed] [Google Scholar]
- Smith AM, Dave S, Nie S, True L., and, Gao X. Multicolor quantum dots for molecular diagnostics of cancer. Expert Rev Mol Diagn. 2006;6:231–244. doi: 10.1586/14737159.6.2.231. [DOI] [PubMed] [Google Scholar]
- Mayhew TM, Mühlfeld C, Vanhecke D., and, Ochs M. A review of recent methods for efficiently quantifying immunogold and other nanoparticles using TEM sections through cells, tissues and organs. Ann Anat. 2009;191:153–170. doi: 10.1016/j.aanat.2008.11.001. [DOI] [PubMed] [Google Scholar]
- Dang TN, Arseneault M, Zarkovic N, Waeg G., and, Ramassamy C. Molecular regulations induced by acrolein in neuroblastoma SK-N-SH cells: relevance to Alzheimer's disease. J Alzheimers Dis. 2010;21:1197–1216. doi: 10.3233/jad-2010-100417. [DOI] [PubMed] [Google Scholar]
- Peng Y, Lee DY, Jiang L, Ma Z, Schachter SC., and, Lemere CA. Huperzine A regulates amyloid precursor protein processing via protein kinase C and mitogen-activated protein kinase pathways in neuroblastoma SK-N-SH cells over-expressing wild type human amyloid precursor protein 695. Neuroscience. 2007;150:386–395. doi: 10.1016/j.neuroscience.2007.09.022. [DOI] [PubMed] [Google Scholar]
- Li JM, Zhao MX, Su H, Wang YY, Tan CP, Ji LN.et al. (2011Multifunctional quantum-dot-based siRNA delivery for HPV18 E6 gene silence and intracellular imaging Biomaterials 327978–7987. [DOI] [PubMed] [Google Scholar]
- Dukes MJ, Peckys DB., and, de Jonge N. Correlative fluorescence microscopy and scanning transmission electron microscopy of quantum-dot-labeled proteins in whole cells in liquid. ACS Nano. 2010;4:4110–4116. doi: 10.1021/nn1010232. [DOI] [PMC free article] [PubMed] [Google Scholar]
- Johnson LN, Cashman SM., and, Kumar-Singh R. Cell-penetrating peptide for enhanced delivery of nucleic acids and drugs to ocular tissues including retina and cornea. Mol Ther. 2008;16:107–114. doi: 10.1038/sj.mt.6300324. [DOI] [PMC free article] [PubMed] [Google Scholar]
- Ruan G, Agrawal A, Marcus AI., and, Nie S. Imaging and tracking of tat peptide-conjugated quantum dots in living cells: new insights into nanoparticle uptake, intracellular transport, and vesicle shedding. J Am Chem Soc. 2007;129:14759–14766. doi: 10.1021/ja074936k. [DOI] [PubMed] [Google Scholar]
- Mei BC, Susumu K, Medintz IL, Delehanty JB, Mountziaris TJ., and, Mattoussi H. Modular poly(ethylene glycol) ligands for biocompatible semiconductor and gold nanocrystals with extended pH and ionic stability. J Mater Chem. 2008;18:4949–4958. [Google Scholar]
- Lovric J, Bazzi HS, Cuie Y, Fortin GR, Winnik FM., and, Maysinger D. Differences in subcellular distribution and toxicity of green and red emitting CdTe quantum dots. J Mol Med. 2005;83:377–385. doi: 10.1007/s00109-004-0629-x. [DOI] [PubMed] [Google Scholar]
- Shiohara A, Hoshino A, Hanaki K, Suzuki K., and, Yamamoto K. On the cyto-toxicity caused by quantum dots. Microbiol Immunol. 2004;48:669–675. doi: 10.1111/j.1348-0421.2004.tb03478.x. [DOI] [PubMed] [Google Scholar]
- Qu L., and, Peng X. Control of photoluminescence properties of CdSe nanocrystals in growth. J Am Chem Soc. 2002;124:2049–2055. doi: 10.1021/ja017002j. [DOI] [PubMed] [Google Scholar]
- Peng ZA., and, Peng X. Formation of high-quality CdTe, CdSe, and CdS nanocrystals using CdO as precursor. J Am Chem Soc. 2001;123:183–184. doi: 10.1021/ja003633m. [DOI] [PubMed] [Google Scholar]
- Nitin N, LaConte LE, Zurkiya O, Hu X., and, Bao G. Functionalization and peptide-based delivery of magnetic nanoparticles as an intracellular MRI contrast agent. J Biol Inorg Chem. 2004;9:706–712. doi: 10.1007/s00775-004-0560-1. [DOI] [PubMed] [Google Scholar]


