

Abstract
This study sought to systematically investigate whether prefrontal cortex grey matter volume reductions are valid endophenotypes for schizophrenia, specifically investigating their presence in unaffected relatives, heritability, genetic overlap with the disorder itself and finally to contrast their performance on these criteria with putative neuropsychological indices of prefrontal functioning. We used a combined twin and family design and examined four prefrontal cortical regions of interest. Superior and inferior regions were significantly smaller in patients. However, the volumes of these same regions were normal in unaffected relatives and therefore, we could confirm that such deficits were not due to familial effects. Volumes of the prefrontal and orbital cortices were, however, moderately heritable, but neither shared a genetic overlap with schizophrenia. Total prefrontal cortical volume reductions shared a significant unique environmental overlap with the disorder, suggesting that the reductions were not familial. In contrast, prefrontal (executive) functioning deficits were present in the unaffected relatives, were moderately heritable and shared a substantial genetic overlap with liability to schizophrenia. These results suggest that the well recognized prefrontal volume reductions are not related to the same familial influences that increase schizophrenia liability and instead may be attributable to illness related biological changes or indeed confounded by illness trajectory, chronicity, medication or substance abuse, or in fact a combination of some or all of them.
Keywords: twin, family, MRI, genetic, prefrontal
Introduction
Given the probable genetic heterogeneity of schizophrenia (Gottesman and Gould, 2003) and the continuous liability model for the disorder (Gottesman and Shields, 1967), the use of dichotomous qualitative phenotypes will often be underpowered in the identification of risk genes. Endophenotypes are one alternative experimental strategy and can inform our aetiological understanding of the disorder. Endophenotypes should be: (i) associated with the disease in the relevant population; (ii) state independent; (iii) heritable; (iv) co-segregate with the disorder in families; and (v) found more frequently in unaffected relatives than in the general population (Gottesman and Gould, 2003).
The prefrontal cortex plays an important modulatory and integrative role in a number of cognitive and behavioural tasks and prefrontal cortex dysfunction has been implicated in the possible pathophysiological substrates of schizophrenia (Shenton et al., 2001; Artigas, 2010; Volk and Lewis, 2010; Waters-Metenier and Toulopoulou, 2011). While it is generally accepted that total prefrontal cortex grey matter volume is smaller in patients (Shenton et al., 2001), there is little agreement about whether this affects the prefrontal cortex globally or in a more anatomically restricted manner. Structural MRI studies have reported volume reductions in the dorsolateral, superior/medial, inferior or orbital prefrontal regions in patients (Schlaepfer et al., 1994; Wible et al., 1997; Woodruff et al., 1997; Buchanan et al., 1998; Goldstein et al., 1999; Szeszko et al., 1999; Crespo-Facorro et al., 2000; Gur et al., 2000; Sanfilipo et al., 2000; Hulshoff Pol et al., 2006; Ettinger et al., 2010). Thus, prefrontal cortex grey matter volume reduction may be a candidate endophenotype (Baare et al., 2001b; Cannon et al., 2006).
Studies in unaffected relatives suggest that they have qualitatively similar, yet less marked changes in the frontal lobe, though findings are mixed (Cannon et al., 1998; Schreiber et al., 1999; Staal et al., 2000; Baare et al., 2001b; Ho, 2007; Brans et al., 2008; Sismanlar et al., 2009). To date, only one family and one twin study have subdivided the frontal gyri. Bhojraj et al. (2011) found evidence of loss of grey matter volume in the left superior and middle frontal gyri and bilaterally in the inferior frontal gyri. We have previously shown that the unaffected monozygotic co-twins from discordant pairs did not differ from superior, middle, inferior and orbital grey matter in controls (Ettinger et al., 2010). Voxel-based morphometry studies of twins found deficits in grey matter density and increases in white matter density, though these changes were not found in unaffected well dizygotic co-twins (Hulshoff Pol et al., 2004). In another voxel-based morphometry study, we found no regional grey matter volume differences in well monozygotic co-twins (Borgwardt et al., 2010).
The frontal lobes are under substantial genetic control with heritability estimates of between 0.70 and 0.92 (White et al., 2002; Cannon et al., 2006; Peper et al., 2007; Schmitt et al., 2007). However, there are few heritability estimates for prefrontal cortex subregions (Wright et al., 2002; Hulshoff Pol et al., 2006; Winkler et al., 2010).
Executive (so-called frontal lobe) functioning deficits are among the most promising endophenotypic markers in schizophrenia. They are present in both patients and their unaffected relatives (Sitskoorn et al., 2004), are heritable and share a degree of genetic overlap with the disorder (Owens et al., 2011). Prefrontal morphological deviations may be the substrate to these executive functioning deficits (Robbins, 2007; Robbins and Arnsten, 2009; Tan et al., 2009; Dodds et al., 2011).
In this study, we quantified the extent to which the increased liability to schizophrenia overlapped with prefrontal cortex grey matter volume changes in a large UK familial and twin schizophrenia cohort. We wished to (i) investigate the presence of grey matter reduction in prefrontal cortex regions in patients with schizophrenia and their unaffected relatives; (ii) divide the sources of variance in these prefrontal cortex regions into their genetic and environmental components; and (iii) quantify the covariance attributable to shared genetic and environmental effects between the four prefrontal cortex subregions and schizophrenia. In addition, we compared the results with those of the more established schizophrenia endophenotype, executive functioning. We chose a combination of popular traditional and computerized tests of executive functioning. Our use of data from both twin and family studies overcame some of the inherent limitations of the classic twin design. By including other types of families, we can reduce parameter bias and increase statistical power (Keller and Coventry, 2005). We hypothesized that unaffected relatives would show prefrontal cortex grey matter volume reductions and that a considerable proportion of the variance in prefrontal cortex grey matter volume would be explained by genetic effects (i.e. be heritable). Finally, we hypothesized that prefrontal cortex grey matter volume would share substantial genetic variance with schizophrenia.
Materials and methods
Participants
The sample consisted of twins and families who participated in the Maudsley Twin and Maudsley Family studies of schizophrenia (McDonald et al., 2002; Toulopoulou et al., 2003, 2005, 2008; Picchioni et al., 2006; Owens et al., 2011). Briefly, participants with schizophrenia and their co-twins or relatives were recruited from throughout the UK by referral from National Health Service treatment centres and voluntary support groups. Controls were recruited from a volunteer twin register and via newspaper advertisements. The controls reflected the patients and relatives in age and gender. Controls had no personal or family history of psychotic illness, schizophrenia or schizoaffective disorder; however, a history of other axis 1 psychiatric disorders was not an exclusion factor either for unaffected relatives or the controls.
All subjects were Caucasian and aged between 17 and 70 years. Subjects were excluded if they had a history of significant head trauma, substance or alcohol dependence in the last 12 months or organic brain disease. The twin sample included both monozygotic and dizygotic twin pairs varying in their concordance for Diagnostic and Statistical Manual of Mental Disorders 4th edition (DSM-IV) schizophrenia or schizoaffective disorder, as well as healthy control twins. Families had at least one member with a diagnosis of schizophrenia or schizoaffective disorder. The studies were approved by the local or multicentre ethics committees and all participants gave written informed consent before participating.
Assessments
Clinical
Diagnoses were made using the Schedule for Affective Disorders and Schizophrenia-Lifetime version (SADS-L; Spitzer and Endicott, 1978) with additional clinical information to allow DSM-IV (American Psychiatric Association, 1994) diagnoses. Handedness (Annett, 1970), the number of years in full-time education and zygosity [twin likeness questionnaire (Cohen et al., 1975) and polymorphic micro-satellite markers] were established. Medication status was recorded and converted to chlorpromazine equivalents. The probability that any of the discordant pairs would become concordant in the future was low, given that an average of 10.04 (SD = 7.90) years in the monozygotic discordant 14.95 (SD = 11.59) years in the dizygotic discordant pairs and 14.07 (SD = 10.41) years in the family sample had elapsed since diagnosis.
Executive functioning
The Maudsley Family Study and the Maudsley Twin Study used similar executive test batteries: both used the Trail Making test (Reitan, 1992) and semantic and phonemic verbal fluency (Spreen and Strauss, 1998) to assess mental flexibility and strategy formation, respectively. In addition, planning ability was assessed by two comparable tests that require generating a sequence of moves to optimally solve a task. The Maudsley Twin Study used the Stockings of Cambridge task from the Cambridge Neuropsychological Test Battery (CANTAB, version 3) while the Maudsley Family Study used an earlier version, Tower of London (Morris et al., 1988, 1995). Finally, spatial working memory was assessed using CANTAB’s Spatial Working Memory in the Maudsley Twin Study, while the Maudsley Family Study used an earlier version called Executive Golf (Morris et al., 1988). The standardization procedure we used to account for the variation in the instruments is given in detail below. The variables were examined within each study for outliers, skewness and kurtosis. Tests were then standardized within each study, using the mean and standard deviation of the control group from that study. This standardization procedure was performed on all subject groups and ensured that all standardized variables had a mean of 0 and variance of 1 in the control group of both studies. The standardized scores from the twin and families studies were then merged into one file.
Intelligence quotient
The Wechsler Adult Intelligence Scale-Revised (Wechsler, 1981) was used in the Family Study to assess IQ. Canavan et al.’s (1986) five test short form was administered to estimate Full Scale IQ (vocabulary, comprehension, similarities, block design and object assembly). The Wechsler Adult Intelligence Scale-III (Wechsler, 1997) was used in the Twin Study. The Full Scale IQ was calculated in the standard procedure using 11 of the subtests. The standardization procedure is given below.
Magnetic resonance imaging
Participants underwent T1-weighted coronal spoiled gradient image of the whole head (Signa Advantage scanner; General Electric Co.) on identical 1.5 T scanners at one of two sites: St Georges Hospital, London or The Maudsley Hospital, London. The majority of scans (181 of the Maudsley Twin Study and 51 of the Maudsley Family Study) were acquired using the same sequence with: echo time 5 ms, repetition time 35 ms, flip angle 30°, number of excitations 1, field of view 200 × 200 mm; yielding 124 contiguous slices 1.5-mm thick. The voxel dimensions were 1 × 1 × 1.5 mm. Two additional sequences were used in the Maudsley Family Study: a slightly shorter protocol with the same resolution was used with 62 persons (echo time = 3.7 ms, repetition time = 14.7 ms, flip angle = 20°) and 133 persons used: echo time = 5.8 ms, repetition time = 13.1 ms, flip angle = 20°. All members of the same twin pair or family were imaged at the same site using the same sequence. Comparable numbers of affected twin and control pairs were imaged in each scanner (χ2 = 0.99; df = 1; P = 0.32). Comparable numbers of affected families and controls were imaged using the different acquisition protocol (χ2 = 1.14; df = 2; P = 0.57) and the different scanners (χ2 = 0.30; df = 1; P = 0.58).
Region of interest volume measurement
Images were analysed in PC-based software based on stereological principles (MEASURE, John Hopkins University software library; Barta et al., 1997). MEASURE superimposes a grid on the image and allows the user to view voxels in three mutually orthogonal planes and manually mark regions of interest. Head tilt was corrected in all brains prior to measurements to align images along the anterior commissure–posterior commissure line and the interhemispheric fissure. For frontal regions of interest, a grid setting of 3 × 3 × 2 was used, with one grid point equalling one voxel. For whole brain volume, a grid setting of 5 × 5 × 5 was used. Measurements were carried out blind to group status.
Whole brain volume (McDonald et al., 2002, 2006; van Haren et al., 2004; Ettinger et al., 2010) included all voxels falling within cortical and subcortical grey matter, white matter and the brainstem superior to the foramen magnum. Cerebellum, CSF, optic chiasm, pineal and pituitary glands, dura mater and superior sagittal, straight and transverse sinuses were excluded. The frontal lobe was divided into four areas, comprising the superior, middle, inferior and orbital frontal cortices. The boundaries of prefrontal cortex structures have been described previously (Ettinger et al., 2010). Surface sulcal landmarks to define boundaries between these regions were based on those described by Buchanan et al. (1998, 2004) and implemented by us previously on monozygotic twins only (Ettinger et al., 2010). Only grey matter was included and all three dimensions of image display (coronal, axial and sagittal) were viewed when rating regions of interest.
Intra- and inter-rater reliabilities were obtained from 10 scans using intra-class correlations. Intra-rater scans were completed at least 6 months apart. Whole brain volume was measured by six raters, intra- [Intra-class Correlation Coefficient (ICC) = 0.97)] and inter-rater (ICC = 0.98) reliabilities were high. The prefrontal cortex was measured by two raters, intra- (ICC > 0.88) and inter-rater reliabilities (ICC > 0.82) were good for all regions.
Statistical analyses
In some cases, the second member of a twin or family pair did not complete the neuropsychological or MRI examination, or the MRI data had to be excluded due to artefacts. To optimize the data set, the surviving twin or family member was still included in the analyses.
The data were acquired from two studies and in some cases using different versions of the same neuropsychological test or similar but not identical tests. The factor analyses and standardization procedure we used to account for the variation in the instruments are given in detail below. The variables were examined within each study for outliers, skewness and kurtosis. Tests were then standardized within each study, using the mean and standard deviation of that studies control group. This standardization procedure was performed on all subject groups and ensured that all standardized variables had a mean of 0 and variance of 1 in the control group of both studies. The standardized scores from the twin and families studies were then merged into one file.
Factor analysis was then performed on the seven standardized executive function variables to reduce the number of phenotypes and to increase power (Rebollo et al., 2006). The ‘complex option’ in Mplus version 3.13 (Muthén and Muthén, 2005; clustering corrected robust maximum likelihood estimation) was used as it accounts for family dependency (Rebollo et al., 2006). A Geomin oblique rotation was used.
An exploratory factor analysis was performed on the seven executive tests. The exploratory factor analysis allowed between one and three factors, and the best fitting model was chosen based on chi-squared comparison using the Mplus robust difference test. It yielded a two-factor solution with adequate fit tapping two distinct cognitive domains. Confirmatory factor analysis was then used to get factor score estimates. The Geomin correlation between the two factors was 0.466. The loading is illustrated in Table 1 and the two domains labelled general executive control and planning/strategy formation.
Table 1.
Factor loadings for neuropsychology tests
| Executive function factor structure | Factor 1: general executive control | Factor 2: planning/ strategy formation |
|---|---|---|
| Phonemic verbal fluency | −0.574 | 0.015 |
| Semantic verbal fluency | −0.557 | −0.033 |
| Trail Making test A | 0.793 | 0.389 |
| Trail Making test B | 0.846 | 0.406 |
| Spatial working memory/ executive golf, total between errors | 0.570 | 0.463 |
| Stockings of Cambridge/ Tower of London, subsequent thinking time | 0.615 | 0.933 |
| Stockings of Cambridge/ Tower of London, number of moves | 0.406 | 0.874 |
Region of interest preliminary analysis
All MRI data were standardized based on the mean and standard deviation of the control group. The effects of hemisphere-by-group (patient, relative and controls) interactions were first evaluated for each region of interest, using a repeated measure model. In the absence of statistical evidence for dependency on the basis of side, the two hemispheres were combined and group comparisons for each region of interest volume completed bilaterally and the Bonferroni correction for four regions of interest applied (P = 0.0125).
Group comparisons
Mean comparisons were used to compare groups (patient, relative and controls) on demographic, clinical, neuropsychology and region of interest volumes. Familial correlations violate the assumption of independence in standard regression models. Generalized estimating equations in STATA version 10 (StataCorp) that assume an exchangeable correlation structure were applied to account for any within--family correlation. To safeguard against misspecification in the variance/covariance matrix, we used robust Huber–White sandwich estimators to adjust standard errors, hence the confidence intervals and P-values (Williams, 2000). Age, gender and years of education were used as covariates for neuropsychological analyses, while age, gender, handedness, rater, acquisition protocol and scanner were used as covariates for the brain volumes. We used height as an additional covariate when whole brain volume was the dependant variable, but we then used whole brain volume as the covariate when the frontal lobe regions of interest were the dependant variable.
Model-fitting analyses
Structural equation modelling was used to specify a model by which the variance of the phenotype (prefrontal cortex grey matter regions of interest or executive functions) and the covariance between that trait and liability to schizophrenia was partitioned between genetic and environmental causes. Relatives resemble each other because they share genetic and environmental factors. Additive genetic factors (A) represent the effects of genes that add up to affect a phenotype; common environmental (C) represents non-genetic factors that are shared by family members, such as diet. The unique environment (E) represents environment factors that make members of the same family different from each other, such as accidents. To study the contribution of genes and environment to covariance between phenotypes (e.g. a prefrontal cortex region of interest with liability to schizophrenia), we looked as the cross-trait correlation between phenotype 1 for Participant 1 and phenotype 2 for his or her relative. For example, if the cross trait correlation is greater for monozygotic than for dizygotic twins, this would imply that additive genetic factors contributed to the phenotypic correlation between the two traits, suggesting that the same genetic factors that increase the susceptibility to schizophrenia cause the prefrontal cortex grey matter reduction associated with the disease.
Bivariate analysis
Bivariate analysis was applied to explore the genetic and environmental relationship between the individual phenotypes (regions of interest and executive functions) and liability to schizophrenia. Since Mx software does not allow simultaneous analysis of dichotomized and continuous data, a compromised strategy was adopted that involved modelling schizophrenia, brain region of interest and neuropsychology measures as threshold traits. Data from each measure were ordinalized into five ordinal classes, which should capture most of the information of the continuous data.
Polychoric correlations
First, we fitted a correlation model to estimate the familial correlations across phenotypes and schizophrenia. As patients and relatives were selected for schizophrenia rather than a random sample, the correlations for schizophrenia (r = 0.92monozygotic, r = 0.515dizygotic/sibling/parent and r = 0.2025avuncular/grandparent) were fixed according to heritability point estimates in population samples as a means of correcting for ascertainment (h2 = 0.81, c2 = 0.19, e2 = 0.08; Sullivan et al., 2003). The threshold was fixed to the population lifetime prevalence (1%). The correlation model yielded for each variable (i) within-person cross-trait correlation, e.g. orbital frontal cortex volume with liability to schizophrenia; (ii) cross-relative within-trait correlations; and (iii) cross-relative cross-trait correlations.
Genetic analyses
Bivariate models between each of the phenotypes (prefrontal cortex regions of interest and executive function) and schizophrenia separated the variance of each trait into its components: additive genetic factors, common environmental and unique environment (ACE), represented by the parameters h2, c2 and e2, and the correlation between each phenotype and liability to schizophrenia was partitioned into the different sources of covariation: genetic (rg), common environmental (rc) and individual-specific environmental (re) correlations. As the rg, rc and re correlations do not take into account the heritability of either trait, it is possible for a large genetic correlation to actually explain a very small portion of the observed covariation between these five traits. Therefore, the model also combines the information from the rg, rc and re with the heritability of each trait to calculate the part of the phenotypic correlation (rph), due to genetic effects (rph-a), to common environment (rph-c) and the part due to unique environment (rph-e).The model parameters for schizophrenia were fixed to the point estimates derived by meta-analysis (Sullivan et al., 2003) as follows: h2 = 0.81, c2 = 0.11, e2 = 0.08. Again the threshold on the liability to schizophrenia was fixed to a lifetime population prevalence of 1%.
The equations for the expected variances and covariances for the different types of family relationships were summarized as follows.
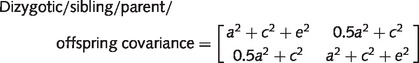 |
The standardized solution of the Cholesky decomposition (the correlated factor solution) is given in Fig. 2.
Figure 1.

The genetic (h2), shared environmental (c2) and the unique environmental (e2) effects on variance in the brain volume regions of interest and the neurocognitive measures.
Figure 2.

The standardized solution of the bivariate correlated factors model. DZ = dizygotic; MZ = monozygotic; rg, rc and re indicate the genetic, shared environmental and specific environmental correlations, respectively.
Model estimation and evaluation
Prior to model fitting, the effects of the same covariates used in the mean comparison were partialled out (Rijsdijk and Sham, 2002). To fit genetic models to the data, we performed structural equation modelling with maximum likelihood estimation of parameters using Mx statistical software (Neale, 1999). The fit of the genetic models was compared with that of the correlational models by subtracting the difference in −2 log likelihood, obtaining a χ2 statistic distributed with df equal to the difference in df of the two models.
Results
Demographics and clinical variables
The final sample of 979 participants included from the twin study (n = 469): 75 monozygotic twins concordant and 52 monozygotic twins discordant for schizophrenia (24 pairs and four healthy co-twins) 47 dizygotic discordant twins (23 pairs and one proband) and 178 monozygotic and 118 dizygotic non-psychotic control twins; and from the family study (n = 510): 117 families (152 patients and their relatives: 85 mothers, 52 fathers, 36 brothers, 47 sisters, seven offspring and six second degree relatives) and 125 singleton controls. None of the patients were acutely unwell at the time of testing. Unaffected relatives and healthy control subjects were not under medical supervision, or receiving any psychotropic medication at the time of assessment. Table 2 summarizes the demographic and clinical data.
Table 2.
Demographics and summary statistics of means and standard deviations on demographic variables for patients, unaffected relatives and controls
| Demographics | Patients (n = 278) | Relatives (n = 280) | Controls (n = 421) | Statistic | P-value |
|---|---|---|---|---|---|
| Age, range | 17 to 74 | 16 to 85 | 18 to 77 | ||
| Age, mean (SD) | 35.77 (10.45) | 47.11 (15.65) | 40.92 (13.39) | Est. diff. = −5.15, 95% CI − 7.26, −3.03a | <0.001a |
| Est. diff. = 6.52, 95% CI 4.02, 9.02b | <0.001b | ||||
| Sex, female, n (%) | 94 (34) | 159 (57) | 275 (65) | OR male = 1.30, 95% CI 0.92, 1.69a | <0.001a |
| OR male = 0.36, 95% CI 0.04, 0.68b | 0.029b | ||||
| Education, mean (SD) | 13.21 (2.86) | 13.66 (2.91) | 14.18 (2.95) | Est. diff. = −0.94, 95% CI −1.45, −0.44a | <0.001a |
| Est. diff. = −0.52, 95% CI −1.05, 0.01b | 0.056b | ||||
| Handednessc | |||||
| Right | 222 | 236 | 329 | NA | |
| Left | 34 | 28 | 34 | NA | |
| Mixed | 6 | 1 | 11 | NA | |
| Chlorpromazine (n = 146) | 562.10 (391.99) |
CI = confidence interval; Est. diff. = estimated difference; OR = odds ratio.
a Patients versus controls.
b Relatives versus controls.
c n = 901 for handedness, subsample of 262 patients, 265 relatives and 374 controls.
Comparison of means
As there were no hemisphere-by-group interactions for the four regions (all P > 0.131, results available on request), the remaining analyses were carried out using prefrontal region of interest volumes collapsed across hemispheres. Table 3 shows the unadjusted means and standard deviations of the prefrontal regions of interest. Patients had significantly smaller whole brain volume and total prefrontal cortex grey matter, compared with controls. All four regions were reduced in patients, though this was only significant in the superior and inferior regions. The unaffected relatives had smaller whole brain and prefrontal cortex grey matter volumes than controls; however, these differences were not statistically significant. Both patients and relatives had significantly impaired performance compared with controls on IQ and both factors, general executive control and planning/strategy.
Table 3.
Descriptive statistics and marginal mean differences (P-values) of planned comparisons between groups on brain volume and neurocognitive measures
| Brain Volume and Neurocognition | Patients, mean (SD) | Relatives, mean (SD) | Controls, mean (SD) | Patients versus controls, mean diff. (P) | Relatives versus controls, mean diff. (P) |
|---|---|---|---|---|---|
| Brain volumes | n = 153 | n = 103 | n = 165 | ||
| Whole brain | 993.65 (113.80) | 971.44 (119.69) | 999.59 (109.56) | −25.67 (0.024) | 1.15 (0.92) |
| Total prefrontal | 136.23 (18.41) | 134.63 (19.85) | 141.90 (18.75) | −5.59 (<0.0005) | −2.24 (0.146) |
| Superior frontal | 53.21 (7.56) | 52.48 (8.41) | 56.14 (8.20) | −3.35 (<0.0005) | −1.50 (0.090) |
| Middle frontal | 27.00 (5.51) | 26.82 (6.32) | 27.55 (5.73) | −0.34 (0.518) | 0.36 (0.552) |
| Inferior frontal | 19.17 (3.46) | 18.90 (3.59) | 19.67 (3.51) | −0.87 (0.015) | −0.16 (0.683) |
| Orbito frontal | 36.80 (5.72) | 36.21 (4.91) | 38.22 (5.17) | −1.02 (0.062) | −1.08 (0.040) |
| Neurocognition | |||||
| IQ, (gender, years, education) | 91.03 (16.46), n = 209 | 101.41 (14.63), n = 206 | 109.67 (13.82), n = 326 | −17.40 (<0.0005) | −7.75 (<0.0005) |
| General executive control, (age, years, gender) | 0.66 (1.26), n = 185 | 0.15 (1.09), n = 191 | −0.59 (0.77), n = 265 | 1.28 (<0.0005) | 0.71 (<0.0005) |
| Planning/strategy formation, (age, gender, years) | 0.18 (0.36), n = 185 | 0.04 (0.35), n = 191 | −0.16 (0.22), n = 265 | 0.36 (<0.0005) | 0.19 (<0.0005) |
Significance levels (P) have been adjusted using Simes (1986) correction for multiple testing.
Age, gender, handedness, rater, acquisition protocol and scanner were used as covariates in all brain volume analyses, and ‘height’ was also included when whole brain volume was the dependant variable, while ‘whole brain volume’ was also included as covariate when a prefrontal region of interest was the dependant variable. Age, sex and years of education were included as covariates for the analysis of neuropsychology variables.
Covariates that were significant are in brackets: whole brain volume (height, age and gender); total frontal (hospital, whole brain volume and age); superior (hospital, whole brain volume and age); middle (hospital, whole brain volume and age); inferior (protocol, hospital, rater, whole brain volume and age); orbital (hospital, whole brain volume and age); IQ (years in education, gender); general executive control (age, years in eduction, gender); planning/strategy formation (age, years in eduction, gender).
Model-fitting analysis
We used a series of bivariate models to investigate the heritability of the phenotypes (regions of interest and the neuropsychology measures), and the genetic and environmental relationship between these phenotypes and the liability to schizophrenia.
Polychoric correlations
Twin/family correlations were first estimated using a correlation model (Table 4). Whole brain volume, total prefrontal cortex grey matter and the subregions superior, inferior and orbital frontal cortices were correlated with schizophrenia. Both executive functioning factors had small to moderate within-person cross-trait correlations with schizophrenia. The cross-twin/family within-trait correlations were larger in monozygotic twins than for the 0.5A relations (dizygotic/sibling/offspring) on most measures, suggesting that they are to some degree heritable and that it is appropriate to attempt to fit a genetic (ACE) model. For the inferior frontal cortex, the confidence intervals for monozygotic and 0.5A relations were similar suggesting its variance is probably due to shared environmental effects. If the cross-twin/family cross-trait correlations are monozygotic > 0.5A relations > 0.25A relations, it suggests a genetic contribution to the phenotypic correlation between the two traits. Importantly, the cross-twin cross-trait correlations showed this ratio for the neuropsychology variables and for whole brain volume and orbital frontal cortex volume suggesting that a genetic model most appropriate for these variables. For completeness, we fitted an ACE model to all variables.
Table 4.
Maximum likelihood estimates of within-person cross-trait correlations; the monozygotic, the dizygotic/sibling/parent and grandparent/avuncular cross-twin/family within-trait correlations and cross-family cross-trait correlations (and 95% CI), with liability to schizophrenia
| Brain volume and neurocognition | Within-person within-trait correlation, r (95% CI) | Cross-twin within-trait correlation for monozygotic twins, r (95% CI) | Cross-twin within-trait correlation for 0.5A relations, r (95% CI) | Cross-twin within-trait correlation for 0.25A relations, r (95% CI) | Cross-twin cross-trait correlation for monozygotic twins, r (95% CI) | Cross-twin cross-trait correlation for 0.5A relations, r (95% CI) | Cross-twin cross-trait correlation for 0.25A relations, r (95% CI) |
|---|---|---|---|---|---|---|---|
| Brain volumes | |||||||
| Whole brain | −0.18 (−0.29 to −0.06) | 0.77 (0.62 to 0.86) | 0.44 (0.25 to 0.60) | 0.34.(−0.27 to 0.76) | −0.14 (−0.26 to −0.01) | −0.11 (−0.23 to 0.02) | −0.12 (−0.39 to 0.20) |
| Total prefrontal cortex grey matter | −0.22 (−0.33 to −0.10) | 0.62 (0.43 to 0.75) | 0.24 (0.03 to 0.44) | −0.18 (−0.54 to 0.50) | −0.13 (−0.26 to −0.01) | −0.14 (−0.26 to −0.02) | 0.08 (−0.23 to 0.35) |
| Superior frontal | −0.25 (−0.35 to −0.13) | 0.50 (0.26 to 0.67) | 0.24 (0.05 to 0.41) | −0.05 (−0.55 to 0.63) | −0.19 (−0.31 to −0.06) | −0.19 (−0.30 to −0.07) | 0.09 (−0.23 to 0.35) |
| Middle frontal | −0.03 (−0.15 to 0.08) | 0.45 (0.23 to 0.62) | 0.26 (0.03 to 0.46) | −0.26 (−0.59 to 0.69) | −0.01 (−0.14 to 0.12) | 0.01 (−0.11 to 0.13) | 0.13 (−0.18 to 0.42) |
| Inferior frontal | −0.13 (−0.24 to −0.02) | 0.11 (−0.14 to 0.35) | 0.20 (−0.03 to 0.42) | 0.02 (−0.46 to 0.62) | −0.07 (−0.20 to 0.06) | −0.09 (−0.20 to 0.03) | 0.18 (−0.14 to 0.44) |
| Orbito frontal | −0.13 (−0.15 to −0.01) | 0.62 (0.41 to 0.76) | 0.21 (0.01 to 0.39) | −0.07 (−0.49 to 0.67) | −0.16 (−0.28 to −0.03) | −0.12 (−0.24 to −0.00) | −0.15 (−0.43 to 0.16) |
| Neurocognition | |||||||
| IQ | −0.30 (−0.32 to −0.30) | 0.81 (0.81 to 0.85) | 0.34 (0.34 to 0.35) | 0.65 (0.64 to 0.65) | −0.25 (−0.26 to −0.23) | −0.05 (−0.05 to −0.05) | −0.11 (−0.11 to −0.05) |
| General executive control | −0.29 (−0.22 to −0.37) | 0.66 (0.53 to 0.75) | 0.28 (0.12 to 0.42) | −0.25 (−0.14, 0.52) | −0.28 (−0.19 to −0.37) | −0.13 (−0.04 to −0.21) | −0.09 (−0.15 to 0.33) |
| Planning/strategy formation | −0.31 (−0.23 to −0.38) | 0.59 (0.44 to 0.70) | 0.29 (0.14 to 0.42) | −0.32 (−0.10 to 0.57) | −0.28 (−0.19 to −0.37) | −0.12 (−0.04 to −0.20) | −0.07 (−0.14 to 0.30) |
The schizophrenia cross-twin correlation is constrained to be 0.92 in monozygotic twins, 0.515 in 0.5A relations, and 0.2025 in 0.25 relations, based on meta-analysis point estimated and schizophrenia prevalence was fixed to 1%. The 95% confidence intervals not including 0 indicate statistical significance, given in bold.
Proportions of the variance and covariance explained by additive genetic factors, common environmental and unique environment models
No reduction in fit was observed when fitting the bivariate ACE models compared with the correlation models. Table 5 shows the χ2 and P-values, and the contributions of genetic (h2), shared environment (c2) and unique environment (e2) to the variations on prefrontal cortex grey matter regions of interest and neuropsychology phenotypes (see also Figure 1). Genetic factors accounted for a significant and large proportion of total variance in whole brain volume (h2 = 0.72), total prefrontal cortex (h2 = 0.47) and the orbital frontal cortex (h2 = 0.56), while the heritability of superior and middle frontal cortices were small and did not reach significance. All the neuropsychology variable measures had medium to large heritability estimates ranging from h2 = 0.58 to 0.73. Shared environmental influences did not significantly account for inter-individual differences on any phenotype, whereas unique environmental effects and error accounted for the remaining variances.
Table 5.
The phenotypic correlations between schizophrenia and endophenotype variables (rph), the decomposed sources of these correlations (rph-a, rph-c and rph-e) as predicted by the full ACE models and additive genetic factors, common environmental and unique environment correlation estimates (with 95% CI)
| Brain volume and neurocognition | Δχ2* | P* | A (95% CI) | C (95% CI) | E (95% CI) | rph-a (95% CI) | rph-c (95% CI) | rph-e (95% CI) | rph (95% CI) | rg (95% CI) | rc (95% CI) | re (95% CI) |
|---|---|---|---|---|---|---|---|---|---|---|---|---|
| Brain volumes | ||||||||||||
| Whole brain | 0.768 | 0.025 | 0.72 (0.36 to 0.86) | 0.05 (0.00 to 0.33) | 0.23 (0.14 to 0.37) | −0.09 (−0.26 to 0.07) | −0.04 (−0.16 to 0.11) | −0.04 (−0.09 to 0.02) | −0.17 (−0.29 to −0.05) | −0.12 (−0.36 to 0.10) | −0.53 (−1.00 to 1.00) | −0.30 (−0.65 to 0.10) |
| Total prefrontal cortex grey matter | 2.612 | 0.90 | 0.47 (0.08 to 0.70) | 0.11 (0.00 to 0.39) | 0.42 (0.27 to 0.61) | −0.02 (−0.20 to 0.13) | −0.10 (−0.11 to −0.07) | −0.08 (−0.14 to −0.01) | −0.21 (−0.31 to −0.10) | −0.03 (−0.30 to 0.32) | −1.00 (−1.00 to 1.00) | −0.43 (−0.77 to −0.02) |
| Superior frontal | 2.389 | 0.90 | 0.26 (0.00 to 0.58) | 0.17 (0.00 to 0.43) | 0.58 (0.38 to 0.80) | −0.06 (−0.23 to 0.10) | −0.14 (−0.22 to 0.00) | −0.05 (−0.12 to 0.02) | −0.24 (−0.34 to −0.13) | −0.12 (−1.00 to 1.00) | −0.99 (−1.00 to 1.00) | −0.23 (−0.56 to 0.11) |
| Middle frontal | 1.013 | 0.95 | 0.34 (0.00 to 0.61) | 0.10 (0.00 to 0.47) | 0.56 (0.38 to 0.77) | −0.01 (−0.22 to 0.20) | −0.00 (−0.17 to 0.16) | −0.02 (−0.10 to 0.06) | −0.03 (−0.15 to 0.08) | −0.02 (−1.00 to 1.00) | −0.03 (−1.00 to 1.00) | −0.10 (−0.46 to 0.27) |
| Inferior frontal | 1.418 | 0.95 | 0.01 (0.00 to 0.30) | 0.16 (0.00 to 0.32) | 0.84 (0.65 to 0.99) | 0.06 (−0.14 to 0.15) | −0.12 (−0.16 to 0.04) | −0.06 (−0.13 to 0.03) | −0.13 (−0.23 to −0.02) | 0.98 (−1.00 to 1.00) | −1.00 (−1.00 to 1.00) | −0.22 (−0.52 to 0.10) |
| Orbito frontal | 1.993 | 0.90 | 0.56 (0.18 to 0.72) | 0.02 (0.00 to 0.28) | 0.43 (0.27 to 0.63) | −0.12 (−0.29 to 0.05) | −0.04 (−0.16 to 0.09) | 0.04 (−0.03 to 010) | −0.13 (−0.24 to −0.01) | −0.18 (−0.48 to 0.08) | −1.00 (−1.00 to 1.00) | 0.19 (−0.17 to 0.51) |
| Neurocognition | ||||||||||||
| IQ | 5.687 | 0.058 | 0.73 (0.54 to 0.84) | 0.05 (0.00 to 0.20) | 0.22 (0.15 to 0.32) | −0.33 (−0.45 to −0.20) | 0.07 (−0.02 to 0.07) | −0.06 (−0.11 to −0.00) | −0.31 (−0.34 to −0.24) | −0.42 (−0.63 to −0.25) | 1.00 (−1.00 to 1.00) | −0.46 (−0.82 to −0.03) |
| General executive control | 0.644 | 0.725 | 0.64 (0.40 to 0.74) | 0.00 (0.00 to 0.19) | 0.36 (0.26 to 0.48) | −0.29 (−0.13 to −0.42) | 0.01 (−0.10 to 0.11) | −0.01 (−0.04 to 0.07) | −0.30 (−0.22 to −0.37 | −0.40 (−0.19 to −0.65) | 0.84 (−1.00 to 1.00) | −0.08 (−0.25 to 0.44) |
| Planning/strategy formation | 0.899 | 0.638 | 0.58 (0.29 to 0.69) | 0.01 (0.00 to 0.22) | 0.42 (0.31 to 0.55) | −0.31 (−0.14 to −0.45) | 0.02 (−0.12 to 0.10) | −0.03 (−0.03 to 0.09) | −0.31 (−0.24 to −0.38) | −0.45 (−0.21 to −0.78) | 1.00 (−1.00 to 1.00) | −0.16 (−0.18 to 0.49) |
ACE refers to additive genetic effects, and environmental effects that are shared between twins; and unique influences that twins do not share, respectively. h2, c2 and e2 indicate heritability, shared environment and non-shared environment, respectively. Parameters for schizophrenia are fixed based on a prevalence of 1% and the following genetic model: h2 = 0.81, c2 = 0.11, e2 = 0.08.
rph-a, rph-c and rph-e indicate the phenotypic correlations due to additive genetic, shared environmental and specific environmental influence, respectively. rph indicates the total phenotypic correlation. rg, rc and re indicate the genetic, shared environmental and specific environmental correlations, respectively.
The 95% confidence intervals not including 0 indicate statistical significance, given in bold.
*Δχ2 and P-value refer to the comparison of the genetic ACE model to the constrained correlation model, with non-significant P-values showing that the ACE model has a good fit.
Significant phenotypic correlations (rph) suggested that increased liability to schizophrenia was associated with reduced whole brain and grey matter volume in the superior, inferior and orbital frontal cortices; and poorer performance on IQ, general executive control and planning/strategy formation (Table 5). Neither whole brain volume nor any of the prefrontal cortex regions had significant genetic correlations (rg) with schizophrenia. All neuropsychology variables were genetically associated with schizophrenia: IQ (rg = −0.42); general executive functioning (rg = −0.40); and planning/strategy formation (rg = −0.41). No common environmental (rc) correlations were significant. Shared unique environment correlations (re) were significant for total prefrontal cortex (re = 0.43) and for IQ (re = 0.46).
The phenotypic correlations due to genetic effects (rph-a) were non-significant for all regions of interest. The proportion of the phenotypic correlations due to shared unique environment or shared common environment was not significant for all regions of interest except total prefrontal cortex, where 48% of the phenotypic correlation (rph = 0.21) between total prefrontal cortex and schizophrenia was due to shared common environmental influences (rph-c = 0.10) and 38% due to shared unique environment influences (rph-e = 0.08). The phenotypic correlations due to genetic effects (rph-a) were significant for all neuropsychology variables. Nevertheless, the phenotypic correlations between schizophrenia and the neuropsychology measures were almost entirely due to shared genetic influences. The proportion of the phenotypic correlations due to shared common environment or shared unique environment was not significant for all subtests.
Discussion
This study utilized extensive structural magnetic resonance and neurocognitive data from a unique twin and family data set, and state of the art statistical methods to quantify the genetic overlap between selected structural regions in prefrontal cortex grey matter and liability to schizophrenia. This allowed us, for the first time, to define the validity of selected prefrontal cortex grey matter regions of interest as markers of the genetic risk for schizophrenia and so inform future genetic studies. Our key findings were that increased liability to schizophrenia was phenotypically associated with reduced whole brain and grey matter volume in the superior, inferior and orbital frontal cortices. Total prefrontal cortex grey matter volume and the orbital frontal cortex were moderately heritable; however, neither whole brain volume nor any of the prefrontal cortex regions had significant genetic correlations with schizophrenia.
Our data suggest that higher genetic loading for schizophrenia is associated with subtle whole brain and prefrontal cortex grey matter volume reductions. Previous studies also found non-significant trends of prefrontal cortex volume reductions in unaffected relatives (Lawrie et al., 1999; Bhojraj et al., 2010) or no difference at all (Lawrie et al., 2001; Steel et al., 2002; Toulopoulou et al., 2004). Using voxel-based morphometry, we previously found subtle frontal cortical volume loss in relatives (McDonald et al., 2004) while others did not (Goghari et al., 2007; Honea et al., 2008). However, the picture remains unclear as a cortical mapping study using twin data found that genetic proximity was associated with reductions in the polar and dorsolateral prefrontal cortex (Cannon et al., 2002). Overall these findings suggest that there is a family association of very subtle frontal lobe grey matter reduction in schizophrenia.
We went further to estimate the heritability of prefrontal cortex grey matter regions and to quantify their aetiological relationship to schizophrenia. Genetic factors accounted for a large proportion of total variance in whole brain volume, in line with the majority of such studies, ranging from 67% to 99% (Baare et al., 2001a; White et al., 2002; Wright et al., 2002; Winkler et al., 2010). Significant heritability estimates were also found for the total prefrontal cortex grey matter and the orbital frontal cortex, while the heritability of superior, middle and inferior frontal cortices were small and non-significant. Our findings are similar to other work that used healthy families, with heritability estimates ranging from 0.54 to 0.57 for the orbital frontal cortex (Wright et al. 2002; Winkler et al. 2010) and the inferior frontal gyrus (0.00–0.38; Wright et al., 2002).
However, our findings differ compared with the estimates for the superior (0.47–0.80; Hulshoff Pol et al., 2006; Winkler et al., 2010); and middle rostral frontal (0.28–0.44) and caudal frontal cortices (0.42–0.43; Winkler et al., 2010). Our data are in line with a large voxel-based morphometry sibling study (Honea et al., 2008) that similarly found non-significant grey matter decreases in the frontal lobe in unaffected siblings, with intra-class correlations between the sibling pairs suggesting no heritability. Familial association and heritability are two necessary properties of an endophenotype, so taken together, our results suggest that prefrontal grey matter reduction is actually only a weak endophenotype marker for schizophrenia.
Increased liability to schizophrenia was phenotypically associated with reduced whole brain and grey matter volume in the superior, inferior and orbital frontal cortices; and poorer performance on IQ and executive functioning factors. However, neither whole brain volume nor any of the prefrontal cortex regions had significant genetic correlations with schizophrenia. In accordance with previous findings, IQ and putative functional measures of frontal lobe functioning were shown to be heritable and related to the disorder (Greenwood et al., 2007; Toulopoulou et al., 2007, 2010; Aukes et al., 2008; Chen et al., 2009; Husted et al., 2009; Quiñones et al., 2009; Owens et al., 2011). Common environmental correlations were not significant for any regions of interest. In contrast, shared unique environment correlations were significant for total prefrontal cortex and for IQ. The results suggest that we did not have adequate power to detect small to moderate genetic and environmental correlations.
While findings from ours and other family studies (Honea et al., 2008) suggest that prefrontal cortex grey matter volume may not be a useful endophenotype, it could be hypothesized that alternative parcellation methods, other aspects of morphology (e.g. cortical thickness, surface area and gyrification) or other imaging techniques (e.g. DTI, PET and functional MRI) may prove to be more useful biological markers of genetic risk. For example, evidence for functional neuroimaging endophenotypes has been found within the frontal and temporal cortices (Callicott et al., 1998; Cannon et al., 2001). These studies have implicated various prefrontal regions; however, it is unclear whether these functional abnormalities are related to the presence of structural abnormalities in the prefrontal cortex or represent a secondary consequence to a primary lesion elsewhere in the brain (for a review see Callicott et al., 2003; Manoach, 2003). Further investigation into functional MRI abnormalities with healthy relatives or twins might prove useful for the identification and clarification of endophenotypes in schizophrenia.
Future research is also needed to better understand the aetiology, course and impact of the prefrontal cortex grey matter reduction in patients. The neuropathological underpinnings of the volumetric differences in schizophrenia have yet to be confirmed and are thought to be heterogeneous within different brain structures, but reduction in grey matter volumes may reflect decrease of interneuronal neuropil in schizophrenia. Post-mortem studies in schizophrenia have found evidence of abnormal migration (Akbarian et al., 1993) and altered cell (Selemon et al., 1995) and interneuronal density (Daviss and Lewis, 1995) in the dorsolateral and altered interneuronal density in the orbital prefrontal cortex (Benes et al., 1991) have been reported in patients with schizophrenia.
The neurobiological abnormalities seen in schizophrenia may have their basis in early brain development (Murray and Lewis, 1987; Weinberger, 1987), yet elucidating the nature, timing and course of the underlying neurobiological changes has proved difficult (Harrison and Lewis, 2003). Studies from pre-psychosis onset indicate that abnormalities are not greatly evident and that changes are dynamic around the time of onset and over the first few years of illness (Pantelis et al., 2005; Wood et al., 2008). This is also a time when dynamic brain changes occur in the normal brains of adolescents. Capturing these changes requires prospective, longitudinal studies that take account of normal and abnormal trajectories of development (Gogtay et al., 2004; Pantelis and Wood, 2009). Dynamic changes provide an important context and temporal dimension to identifying potential premorbid markers of subsequent illness.
One attractive theory attempting to explain grey matter reduction in patients is that there is an exaggerated action of the normal CNS pruning process (Feinberg, 1982; Hoffman and Dobscha, 1989; Keshavan et al., 1994; Hoffman and McGlashan, 1997). There is some emerging support for this hypothesis (for a recent discussion see Boksa, 2012). One reason to consider exaggerated pruning as the main process in grey matter reduction is the similar time course of the pruning process and onset of illness in schizophrenia. Another reason is the fact that brain tissue of patients with schizophrenia contains no histological evidence of gliosis (scarring) or abnormal degeneration (Rosenthal, 2011). This lack of a histological marker would be expected with the normal physiological process of pruning. There are some suggestions, for example of exaggerated pruning due to epigenetic differences (Rosenthal, 2011), that might explain the lack of familial effects on grey matter in our sample.
Several study limitations should be acknowledged. The majority of patients in this study were pharmacologically treated, and many were ill for a number of years, allowing an effect of antipsychotic treatment and disease chronicity on brain volume. This study was not designed to address medication effects; it was cross-sectional and only self-report data were recorded, rather than blood levels or other objective measures of medication status. That neurocognitive differences were also observed in unaffected relatives suggests that medication effects alone cannot account for these findings. However, the opposite applies to the prefrontal cortex reductions that were observed in patients but not relatives. Indeed, some evidence points towards the possibility that antipsychotic drugs reduce the volume of brain matter. Antipsychotics may contribute to the genesis of some of the abnormalities usually attributed to schizophrenia (Moncrieff and Leo, 2010). More longitudinal studies beginning at first episode and comparing medication conditions are needed to answer this question.
A large number of studies attribute prefrontal cortex dysfunction to the type of executive deficits that we measured. However, it is not proven that all of these tests are adequate markers of frontal lobe function and as such the validity of our conclusions, on the disparity between frontal lobe structure and function, hinges on the adequacy of the tests reflecting frontal lobe function. Other limitations are the general assumptions of genetic modelling (Toulopoulou et al., 2007) and the particular assumptions used in combined twin and family samples. Specifically, we equated the shared environmental effects across all relatives who share 50% additive genetic effects, which leads to underestimation of any shared environment effects. Several regions of interest heritability estimates were moderate yet failed to reach significance, suggesting that the study lacked power.
We incorporated data that were sometimes collected using different but compatible instruments that could increase methodological heterogeneity. To address this, we standardized the data within each cohort relative to their own control cohort. We used magnetic resonance data from two scanners and three acquisition protocols, introducing possible sources of noise to the data. However, the scanners were identical and the effects of scanner and protocol were controlled for statistically. The segmentation of the prefrontal cortex was based on validated methods, but the regions are relatively large in volume and it remains possible that subtle genetic effects could be present at a subregional level and be identified by alternative neuroimaging analysis techniques incorporating voxel level analysis, finer grained parcellation or greater anatomical precision (Nakamura et al., 2008).
The strengths of this study include that the sample, to our knowledge, represents the largest examination of prefrontal cortex subregions using a region of interest technique, in families and twins with schizophrenia and used highly sophisticated multivariate genetic analytical models. The combination of twins and families has the further advantages of increasing the sample size, reducing sample variance due to differences in allelic frequency and representing the true population more accurately than would a twin sample alone while also increasing the power to differentiate between additive genetic effects and shared environmental effects.
In conclusion, while grey matter volumes of the orbital frontal cortex and total prefrontal cortex were moderately heritable, neither shared a genetic overlap with the disorder. The well recognized prefrontal cortex reductions observed in patients with schizophrenia are not related to the same familial influences that increase schizophrenia liability and instead may be attributable to illness-related biological changes or indeed confounded by illness trajectory, chronicity, medication or substance abuse, or in fact a combination of some or all of these. This is the first study to show that prefrontal cortex grey matter deviations are disease specific and not part of the genetic vulnerability. It is certain that the neuropathology, be it atrophic or neurodevelopmental, is part of the disease process.
Funding
European Community’s Sixth Framework Programme through a Marie Curie Training Network (MRTN-CT-2006-035987) called the European Twin Study Network on Schizophrenia (EUTwinsS), NARSAD (through a Young Investigator Award to Dr Toulopoulou), Wellcome Training Fellowship (064971 to M.P.); Economic and Social Research Council/Medical Research Council and the Psychiatry Research Trust (PTA-037-27-0002); DFG (grant Et 31/2-1 to U.E.); Wellcome Trust Training Fellowship (ref 059007 to C.McD.). The authors acknowledge support from the Department of Health via the National Institute for Health Research (NIHR) Specialist Biomedical Research Centre for Mental Health award to South London and Maudsley NHS Foundation Trust (SLaM) and the Institute of Psychiatry at King’s College London.
Acknowledgements
The principal investigators of this project were Dr T.T., Dr M.P. and Prof R.M. Drs C.McD., M.W., M.P., T.T. and S.F.O. collected the data. Dr U.E. managed the MRI measurement. Dr S.F.O. and Ms A.S. completed the MRI measurements. Dr F.R. managed the statistical analysis. Dr S.F.O. undertook the statistical analysis and wrote the first draft of the manuscript. All authors contributed to and have approved the final manuscript.
Glossary
Abbreviation
- A,C,E
additive genetic factors, common environmental and unique environment
References
- Akbarian S, Bunney WE, Jr, Potkin SG, Wigal SB, Hagman JO, Sandman CA, et al. Altered distribution of nicotinamide-adenine dinucleotide phosphate-diaphorase cells in frontal lobe of schizophrenics implies disturbances of cortical development. Arch Gen Psychiatry. 1993;50:169–77. doi: 10.1001/archpsyc.1993.01820150007001. [DOI] [PubMed] [Google Scholar]
- American Psychiatric Association. Washington DC: American Psychiatric Association; 1994. Diagnostic and statistical manual of mental health disorders. [Google Scholar]
- Annett M. A classification of hand preference by association analysis. Br J Psychol. 1970;61:303–21. doi: 10.1111/j.2044-8295.1970.tb01248.x. [DOI] [PubMed] [Google Scholar]
- Artigas F. The prefrontal cortex: a target for antipsychotic drugs. Acta Psychiatr Scand. 2010;121:11–21. doi: 10.1111/j.1600-0447.2009.01455.x. [DOI] [PubMed] [Google Scholar]
- Aukes MF, Alizadeh BZ, Sitskoorn MM, Selten JP, Sinke RJ, Kemner C, et al. Finding suitable phenotypes for genetic studies of schizophrenia: heritability and segregation analysis. Biol Psychiatry. 2008;64:128–36. doi: 10.1016/j.biopsych.2007.12.013. [DOI] [PubMed] [Google Scholar]
- Baare WF, Hulshoff Pol HE, Boomsma DI, Posthuma D, de Geus EJ, Schnack HG, et al. Quantitative genetic modeling of variation in human brain morphology. Cereb Cortex. 2001a;11:816–24. doi: 10.1093/cercor/11.9.816. [DOI] [PubMed] [Google Scholar]
- Baare WF, van Oel CJ, Hulshoff Pol HE, Schnack HG, Durston S, Sitskoorn MM, et al. Volumes of brain structures in twins discordant for schizophrenia. Arch Gen Psychiatry. 2001b;58:33–40. doi: 10.1001/archpsyc.58.1.33. [DOI] [PubMed] [Google Scholar]
- Barta PE, Dhingra L, Royall R, Schwartz E. Improving stereological estimates for the volume of structures identified in three-dimensional arrays of spatial data. J Neurosci Methods. 1997;75:111–8. doi: 10.1016/s0165-0270(97)00049-6. [DOI] [PubMed] [Google Scholar]
- Benes FM, McSparren J, Bird ED, SanGiovanni JP, Vincent SL. Deficits in small interneurons in prefrontal and cingulate cortices of schizophrenic and schizoaffective patients. Arch Gen Psychiatry. 1991;48:996–1001. doi: 10.1001/archpsyc.1991.01810350036005. [DOI] [PubMed] [Google Scholar]
- Bhojraj TS, Prasad KM, Eack SM, Francis AN, Miewald JM, Montrose DM, et al. Gray matter loss in young relatives at risk for schizophrenia: relation with prodromal psychopathology. Neuroimage. 2011;54(Suppl 1):S272–9. doi: 10.1016/j.neuroimage.2010.04.257. [DOI] [PMC free article] [PubMed] [Google Scholar]
- Bhojraj TS, Prasad KM, Eack SM, Francis AN, Montrose DM, Keshavan MS. Do inter-regional gray-matter volumetric correlations reflect altered functional connectivity in high-risk offspring of schizophrenia patients? Schizophr Res. 2010;118:62–8. doi: 10.1016/j.schres.2010.01.019. [DOI] [PMC free article] [PubMed] [Google Scholar]
- Boksa P. Abnormal synatptic pruning in schizophrenia: urban myth or reality? J Psychiatry Neurosci. 2012;37:75–7. doi: 10.1503/jpn.120007. [DOI] [PMC free article] [PubMed] [Google Scholar]
- Borgwardt SJ, Picchioni MM, Ettinger U, Toulopoulou T, Murray R, McGuire PK. Regional gray matter volume in monozygotic twins concordant and discordant for schizophrenia. Biol Psychiatry. 2010;67:956–64. doi: 10.1016/j.biopsych.2009.10.026. [DOI] [PubMed] [Google Scholar]
- Brans RGH, van Haren NEM, van Baal GCM, Schnack HG, Kahn RS, Pol HEH. Heritability of changes in brain volume over time in twin pairs discordant for schizophrenia. Arch Gen Psychiatry. 2008;65:1259–68. doi: 10.1001/archpsyc.65.11.1259. [DOI] [PubMed] [Google Scholar]
- Buchanan RW, Francis A, Arango C, Miller K, Lefkowitz DM, McMahon RP, et al. Morphometric assessment of the heteromodal association cortex in schizophrenia. Am J Psychiatry. 2004;161:322–31. doi: 10.1176/appi.ajp.161.2.322. [DOI] [PubMed] [Google Scholar]
- Buchanan RW, Vladar K, Barta PE, Pearlson GD. Structural evaluation of the prefrontal cortex in schizophrenia. Am J Psychiatry. 1998;155:1049–55. doi: 10.1176/ajp.155.8.1049. [DOI] [PubMed] [Google Scholar]
- Callicott JH, Egan MF, Bertolino A, Mattay VS, Langheim FJ, Frank JA, et al. Hippocampal N-acetyl aspartate in unaffected siblings of patients with schizophrenia: a possible intermediate neurobiological phenotype. Biol Psychiatry. 1998;4:941–50. doi: 10.1016/s0006-3223(98)00264-9. [DOI] [PubMed] [Google Scholar]
- Callicott JH, Mattay VS, Verchinski BA, Marenco S, Egan MF, Weinberger DR. Complexity of prefrontal cortical dysfunction in schizophrenia: more than up or down. Am J Psychiatry. 2003;160:2209–15. doi: 10.1176/appi.ajp.160.12.2209. [DOI] [PubMed] [Google Scholar]
- Canavan AGM, Dunn G, McMillan TM. Principal components of the WAIS-R. Br J Clin Psychol. 1986;25:81–6. [Google Scholar]
- Cannon TD, Gasperoni TL, van Erp TGM, Rosso IM. Quantitative neural indicators of liability to schizophrenia: implications for molecular genetic studies. Am J Med Genet. 2001;105:16–9. [PubMed] [Google Scholar]
- Cannon TD, Thompson PM, van Erp TG, Toga AW, Poutanen VP, Huttunen M, et al. Cortex mapping reveals regionally specific patterns of genetic and disease-specific gray-matter deficits in twins discordant for schizophrenia. Proc Natl Acad Sci USA. 2002;99:3228–33. doi: 10.1073/pnas.052023499. [DOI] [PMC free article] [PubMed] [Google Scholar]
- Cannon TD, Thompson PM, van Erp TGM, Huttunen M, Lonnqvist J, Kaprio J, et al. Mapping heritability and molecular genetic associations with cortical features using probabilistic brain atlases: methods and applications to Schizophrenia. Neuroinformatics. 2006;4:5–19. doi: 10.1385/NI:4:1:5. [DOI] [PubMed] [Google Scholar]
- Cannon TD, Van Erp TG, Huttunen M, Lönnqvist J, Salonen O, Valanne L, et al. Regional gray matter, white matter, and cerebrospinal fluid distributions in schizophrenic patients, their siblings, and controls. Arch Gen Psychiatry. 1998;55:1084–91. doi: 10.1001/archpsyc.55.12.1084. [DOI] [PubMed] [Google Scholar]
- Chen LS, Rice TK, Thompson PA, Barch DM, Csernansky JG. Familial aggregation of clinical and neurocognitive features in sibling pairs with and without schizophrenia. Schizophr Res. 2009;111:159–66. doi: 10.1016/j.schres.2009.03.030. [DOI] [PMC free article] [PubMed] [Google Scholar]
- Cohen DJ, Dibble E, Grawe JM, Pollin W. Reliably separating identical from fraternal twins. Arch Gen Psychiatry. 1975;32:1371–5. doi: 10.1001/archpsyc.1975.01760290039004. [DOI] [PubMed] [Google Scholar]
- Crespo-Facorro B, Kim J, Andreasen NC, O'Leary DS, Magnotta V. Regional frontal abnormalities in schizophrenia: a quantitative gray matter volume and cortical surface size study. Biol Psychiatry. 2000;48:110–9. doi: 10.1016/s0006-2332(00)00238-9. [DOI] [PubMed] [Google Scholar]
- Daviss SR, Lewis DA. Local circuit neurons of the prefrontal cortex in schizophrenia: selective increase in the density of calbindin-immunoreactive neurons. Psychiatry Res. 1995;59:81–96. doi: 10.1016/0165-1781(95)02720-3. [DOI] [PubMed] [Google Scholar]
- Dodds CM, Morein-Zamir S, Robbins TW. Dissociating inhibition, attention, and response control in the frontoparietal network using functional magnetic resonance imaging. Cereb Cortex. 2011;21:1155–65. doi: 10.1093/cercor/bhq187. [DOI] [PMC free article] [PubMed] [Google Scholar]
- Ettinger U, Schmechtig A, Toulopoulou T, Borg C, Orrells C, Owens S, et al. Prefrontal and striatal volumes in monozygotic twins concordant and discordant for schizophrenia. Schizophr Bull. 2012;38:192–203. doi: 10.1093/schbul/sbq060. [DOI] [PMC free article] [PubMed] [Google Scholar]
- Feinberg I. Schizophrenia: caused by a fault in programmed synaptic elimination during adolescence? J Psychiatr Res. 1982;17:319–34. doi: 10.1016/0022-3956(82)90038-3. [DOI] [PubMed] [Google Scholar]
- Goghari VM, Rehm K, Carter CS, MacDonald AW., III Regionally specific cortical thinning and gray matter abnormalities in the healthy relatives of schizophrenia patients. Cereb Cortex. 2007;17:415–24. doi: 10.1093/cercor/bhj158. [DOI] [PubMed] [Google Scholar]
- Gogtay N, Sporn A, Clasen LS, Nugent TF, III, Greenstein D, Nicolson R, et al. Comparison of progressive cortical gray matter loss in childhood-onset schizophrenia with that in childhood-onset atypical psychoses. Arch Gen Psychiatry. 2004;61:17–22. doi: 10.1001/archpsyc.61.1.17. [DOI] [PubMed] [Google Scholar]
- Goldstein JM, Goodman JM, Seidman LJ, Kennedy DN, Makris N, Lee H, et al. Cortical abnormalities in Schizophrenia identified by structural magnetic resonance imaging. Arch Gen Psychiatry. 1999;56:537–47. doi: 10.1001/archpsyc.56.6.537. [DOI] [PubMed] [Google Scholar]
- Gottesman II, Shields J. A polygenic theory of schizophrenia. Proc Natl Acad Sci USA. 1967;58:199–205. doi: 10.1073/pnas.58.1.199. [DOI] [PMC free article] [PubMed] [Google Scholar]
- Gottesman II, Gould TD. The endophenotype concept in psychiatry: etymology and strategic intentions. Am J Psychiatry. 2003;160:636–45. doi: 10.1176/appi.ajp.160.4.636. [DOI] [PubMed] [Google Scholar]
- Greenwood TA, Braff DL, Light GA, Cadenhead KS, Calkins ME, Dobie DJ, et al. Initial heritability analyses of endophenotypic measures for Schizophrenia: the consortium on the genetics of Schizophrenia. Arch Gen Psychiatry. 2007;64:1242–50. doi: 10.1001/archpsyc.64.11.1242. [DOI] [PMC free article] [PubMed] [Google Scholar]
- Gur RE, Cowell PE, Latshaw A, Turetsky BI, Grossman RI, Arnold SE, et al. Reduced dorsal and orbital prefrontal gray matter volumes in schizophrenia. Arch Gen Psychiatry. 2000;57:761–8. doi: 10.1001/archpsyc.57.8.761. [DOI] [PubMed] [Google Scholar]
- Harrison PJ, Lewis DA. Neuropathology of schizophrenia. In: Hirsch SR, Weinberger DR, editors. Schizophrenia. 2nd edn. Oxford, UK: Blackwell Science Ltd; 2003. pp. 310–25. [Google Scholar]
- Ho BC. MRI brain volume abnormalities in young, nonpsychotic relatives of schizophrenia probands are associated with subsequent prodromal symptoms. Schizophr Res. 2007;96:1–13. doi: 10.1016/j.schres.2007.08.001. [DOI] [PMC free article] [PubMed] [Google Scholar]
- Hoffman RE, Dobscha SK. Cortical pruning and the development of schizophrenia: a computer model. Schizophr Bull. 1989;15:477–90. doi: 10.1093/schbul/15.3.477. [DOI] [PubMed] [Google Scholar]
- Hoffman RE, McGlashan TH. Synaptic elimination, neurodevelopment, and the mechanism of hallucinated "voices" in schizophrenia. Am J Psychiatry. 1997;154:1683–9. doi: 10.1176/ajp.154.12.1683. [DOI] [PubMed] [Google Scholar]
- Honea RA, Meyer-Lindenberg A, Hobbs KB, Pezawas L, Mattay VS, Egan MF, et al. Is gray matter volume an intermediate phenotype for schizophrenia? A voxel-based morphometry study of patients with schizophrenia and their healthy siblings. Biol Psychiatry. 2008;63:465–74. doi: 10.1016/j.biopsych.2007.05.027. [DOI] [PMC free article] [PubMed] [Google Scholar]
- Hulshoff Pol HE, Brans RGH, van Haren NEM, Schnack HG, Langen M, Baare WFC, et al. Gray and white matter volume abnormalities in monozygotic and same-gender dizygotic twins discordant for schizophrenia. Biol Psychiatry. 2004;55:126–30. doi: 10.1016/s0006-3223(03)00728-5. [DOI] [PubMed] [Google Scholar]
- Hulshoff Pol HE, Schnack HG, Posthuma D, Mandl RC, Baare WF, van Oel C, et al. Genetic contributions to human brain morphology and intelligence. J Neurosci. 2006;26:10235–42. doi: 10.1523/JNEUROSCI.1312-06.2006. [DOI] [PMC free article] [PubMed] [Google Scholar]
- Husted JA, Lim S, Chow EW, Greenwood C, Bassett AS. Heritability of neurocognitive traits in familial schizophrenia. Am J Med Genet B Neuropsychiatr Genet. 2009;150B:845–53. doi: 10.1002/ajmg.b.30907. [DOI] [PMC free article] [PubMed] [Google Scholar]
- Keller MC, Coventry WL. Quantifying and addressing parameter indeterminacy in the classical twin design. Twin Res Hum Genet. 2005;8:201–13. doi: 10.1375/1832427054253068. [DOI] [PubMed] [Google Scholar]
- Keshavan MS, Anderson S, Pettegrew JW. Is schizophrenia due to excessive synaptic pruning in the prefrontal cortex? The Feinberg hypothesis revisited. J Psychiatr Res. 1994;28:239–65. doi: 10.1016/0022-3956(94)90009-4. [DOI] [PubMed] [Google Scholar]
- Lawrie SM, Whalley HC, Abukmeil SS, Kestelman JN, Donnelly L, Miller P, et al. Brain structure, genetic liability, and psychotic symptoms in subjects at high risk of developing schizophrenia. Biol Psychiatry. 2001;49:811–23. doi: 10.1016/s0006-3223(00)01117-3. [DOI] [PubMed] [Google Scholar]
- Lawrie SM, Whalley H, Kestelman JN, Abukmeil SS, Byrne M, Hodges A, et al. Magnetic resonance imaging of brain in people at high risk of developing schizophrenia. Lancet. 1999;353:30–3. doi: 10.1016/S0140-6736(98)06244-8. [DOI] [PubMed] [Google Scholar]
- Manoach DS. Prefrontal cortex dysfunction during working memory performance in schizophrenia: reconciling discrepant findings. Schizophr Res. 2003;60:285–98. doi: 10.1016/s0920-9964(02)00294-3. [DOI] [PubMed] [Google Scholar]
- McDonald C, Bullmore ET, Sham PC, Chitnis X, Wickham H, Bramon E, et al. Association of genetic risks for schizophrenia and bipolar disorder with specific and generic brain structural endophenotypes. Arch Gen Psychiatry. 2004;61:974–84. doi: 10.1001/archpsyc.61.10.974. [DOI] [PubMed] [Google Scholar]
- McDonald C, Grech A, Toulopoulou T, Schulze K, Chapple B, Sham P, et al. Brain volumes in familial and non-familial schizophrenic probands and their unaffected relatives. Am J Med Genet. 2002;114:616–25. doi: 10.1002/ajmg.10604. [DOI] [PubMed] [Google Scholar]
- McDonald C, Marshall N, Sham PC, Bullmore ET, Schulze K, Chapple B, et al. Regional brain morphometry in patients with schizophrenia or bipolar disorder and their unaffected relatives. Am J Psychiatry. 2006;163:478–87. doi: 10.1176/appi.ajp.163.3.478. [DOI] [PubMed] [Google Scholar]
- Moncrieff J, Leo J. A systematic review of the effects of antipsychotic drugs on brain volume. Psychol Med. 2010;40:1409–22. doi: 10.1017/S0033291709992297. [DOI] [PubMed] [Google Scholar]
- Morris RG, Downes JJ, Sahakian BJ, Evenden JL, Heald A, Robbins TW. Planning and spatial working memory in Parkinson's disease. J Neurol Neurosurg Psychiatry. 1988;51:757–66. doi: 10.1136/jnnp.51.6.757. [DOI] [PMC free article] [PubMed] [Google Scholar]
- Morris RG, Rushe T, Woodruffe PWR, Murray RM. Problem solving in schizophrenia: a specific deficit in planning ability. Schizophr Res. 1995;14:235–46. doi: 10.1016/0920-9964(94)00044-9. [DOI] [PubMed] [Google Scholar]
- Murray RM. Lewis SW. Is schizophrenia a neurodevelopmental disorder? Br Med J (Clin Res Ed) 1987;295:681–2. doi: 10.1136/bmj.295.6600.681. [DOI] [PMC free article] [PubMed] [Google Scholar]
- Muthén LK, Muthén BO. 3rd edn. Los Angeles, CA: Muthén & Muthén; 2005. Mplus user’s guide. [Google Scholar]
- Nakamura M, Nestor P, Levitt J, Cohen A, Kawashima T, Shenton M, et al. Orbitofrontal volume deficit in schizophrenia and thought disorder. Brain Cogn. 2008;131:180–95. doi: 10.1093/brain/awm265. [DOI] [PMC free article] [PubMed] [Google Scholar]
- Neale MC. 5th edn. Richmond, VA: Department of Psychiatry, Medical College of Virginia; 1999. Mx: statistical modelling. [Google Scholar]
- Owens SF, Rijsdijk F, Picchioni MM, Stahl D, Nenadic I, Murray RM, et al. Genetic overlap between schizophrenia and selective components of executive function. Schizophr Res. 2011;127:181–7. doi: 10.1016/j.schres.2010.10.010. [DOI] [PubMed] [Google Scholar]
- Pantelis C, Wood SJ. Imaging in schizophrenia: looking back and peering ahead. Ann Acad Med Singapore. 2009;38:440–2. [PubMed] [Google Scholar]
- Pantelis C, Yucel M, Wood SJ, Velakoulis D, Sun D, Berger G, et al. Structural brain imaging evidence for multiple pathological processes at different stages of brain development in schizophrenia. Schizophr Bull. 2005;31:672–96. doi: 10.1093/schbul/sbi034. [DOI] [PubMed] [Google Scholar]
- Peper JS, Brouwer RM, Boomsma DI, Kahn RS, Pol HEH. Genetic influences on human brain structure: a review of brain imaging studies in twins. Hum Brain Mapp. 2007;28:464–73. doi: 10.1002/hbm.20398. [DOI] [PMC free article] [PubMed] [Google Scholar]
- Picchioni MM, Toulopoulou T, Landau S, Davies N, Ribchester T, Murray RM. Neurological abnormalities in schizophrenic twins. Biol Psychiatry. 2006;59:341–8. doi: 10.1016/j.biopsych.2005.07.007. [DOI] [PubMed] [Google Scholar]
- Quiñones R, Calderín Y, Domínguez M, Bravo T, Berazaín A, García A, et al. Heritability of trail making test performance in multiplex schizophrenia families: implications for the search for an endophenotype. Eur Arch Psychiatry Clin Neurosci. 2009;259:475–81. doi: 10.1007/s00406-009-0012-6. [DOI] [PubMed] [Google Scholar]
- Rebollo I, de Moor MH, Dolan CV, Boomsma DI. Phenotypic factor analysis of family data: correction of the bias due to dependency. Twin Res Hum Genet. 2006;9:367–76. doi: 10.1375/183242706777591326. [DOI] [PubMed] [Google Scholar]
- Reitan RM. Tuscan, AZ: Reitan Neuropsychological Laboratory; 1992. Trail making test: manual for administration and scoring. [Google Scholar]
- Rijsdijk FV, Sham PC. Analytic approaches to twin data using structural equation models. Brief Bioinform. 2002;3:119–33. doi: 10.1093/bib/3.2.119. [DOI] [PubMed] [Google Scholar]
- Robbins TW. Shifting and stopping: fronto-striatal substrates, neurochemical modulation and clinical implications. Phil Trans R Soc B Biol Sci. 2007;362:917–32. doi: 10.1098/rstb.2007.2097. [DOI] [PMC free article] [PubMed] [Google Scholar]
- Robbins TW, Arnsten AFT. The neuropsychopharmacology of fronto-executive function: monoaminergic modulation. Annu Rev Neurosci. 2009;32:267–87. doi: 10.1146/annurev.neuro.051508.135535. [DOI] [PMC free article] [PubMed] [Google Scholar]
- Rosenthal R. Of schizophrenia, pruning, and epigenetics: a hypothesis and suggestion. Med Hypotheses. 2011;77:106–8. doi: 10.1016/j.mehy.2011.03.038. [DOI] [PubMed] [Google Scholar]
- Sanfilipo M, Lafargue T, Rusinek H, Arena L, Loneragan C, Lautin A, et al. Volumetric measure of the frontal and temporal lobe regions in schizophrenia: relationship to negative symptoms. Arch Gen Psychiatry. 2000;57:471–80. doi: 10.1001/archpsyc.57.5.471. [DOI] [PubMed] [Google Scholar]
- Schlaepfer TE, Harris GJ, Tien AY, Peng LW, Lee S, Federman EB, et al. Decreased regional cortical gray matter volume in schizophrenia. Am J Psychiatry. 1994;151:842–8. doi: 10.1176/ajp.151.6.842. [DOI] [PubMed] [Google Scholar]
- Schmitt JE, Eyler LT, Giedd JN, Kremen WS, Kendler KS, Neale MC. Review of twin and family studies on neuroanatomic phenotypes and typical neurodevelopment. Twin Res Hum Genet. 2007;10:683–94. doi: 10.1375/twin.10.5.683. [DOI] [PMC free article] [PubMed] [Google Scholar]
- Schreiber H, Baur-Seack K, Kornhuber HH, Wallner B, Friedrich JM, De Winter IM, et al. Brain morphology in adolescents at genetic risk for schizophrenia assessed by qualitative and quantitative magnetic resonance imaging. Schizophr Res. 1999;40:81–4. doi: 10.1016/s0920-9964(99)00026-2. [DOI] [PubMed] [Google Scholar]
- Selemon LD, Rajkowska G, Goldman-Rakic PS. Abnormally high neuronal density in the schizophrenic cortex. A morphometric analysis of prefrontal area 9 and occipital area 17. Arch Gen Psychiatry. 1995;52:805–18; discussion 19–20. doi: 10.1001/archpsyc.1995.03950220015005. [DOI] [PubMed] [Google Scholar]
- Shenton ME, Dickey CC, Frumin M, McCarley RW. A review of MRI findings in schizophrenia. Schizophr Res. 2001;49:1–52. doi: 10.1016/s0920-9964(01)00163-3. [DOI] [PMC free article] [PubMed] [Google Scholar]
- Simes RJ. An improved Bonferroni procedure for multiple tests of significance. Biometrika. 1986;73:751–4. [Google Scholar]
- Sismanlar SG, Anik Y, Coskun A, Agaoglu B, Karakaya I, Yavuz CI. The volumetric differences of the fronto-temporal region in young offspring of schizophrenic patients. Eur Child Adolesc Psychiatry. 2009;19:151–7. doi: 10.1007/s00787-009-0052-5. [DOI] [PubMed] [Google Scholar]
- Sitskoorn MM, Aleman A, Ebisch SJH, Appels MCM, Kahn RS. Cognitive deficits in relatives of patients with schizophrenia: a meta-analysis. Schizophr Res. 2004;71:285–95. doi: 10.1016/j.schres.2004.03.007. [DOI] [PubMed] [Google Scholar]
- Spitzer RL, Endicott J. New York: New York State Psychiatric Institute; 1978. Schedule for affective disorders and schizophrenia-lifetime version. [Google Scholar]
- Spreen O, Strauss E. 2nd edn. New York: Oxford University Press; 1998. A compendium of neuropsychological tests: administration, norms, and commentary. [Google Scholar]
- Staal WG, Hulshoff Pol HE, Schnack HG, Hoogendoorn ML, Jellema K, Kahn RS. Structural brain abnormalities in patients with schizophrenia and their healthy siblings. Am J Psychiatry. 2000;157:416–21. doi: 10.1176/appi.ajp.157.3.416. [DOI] [PubMed] [Google Scholar]
- Steel RM, Whalley HC, Miller P, Best JJ, Johnstone EC, Lawrie SM. Structural MRI of the brain in presumed carriers of genes for schizophrenia, their affected and unaffected siblings. J Neurol Neurosurg Psychiatry. 2002;72:455–8. doi: 10.1136/jnnp.72.4.455. [DOI] [PMC free article] [PubMed] [Google Scholar]
- Sullivan PF, Kendler KS, Neale MC. Schizophrenia as a complex trait: evidence from a meta-analysis of twin studies. Arch Gen Psychiatry. 2003;60:1187–92. doi: 10.1001/archpsyc.60.12.1187. [DOI] [PubMed] [Google Scholar]
- Szeszko PR, Bilder RM, Lencz T, Pollack S, Alvir JM, Ashtari M, et al. Investigation of frontal lobe subregions in first-episode schizophrenia. Psychiatry Res. 1999;90:1–15. doi: 10.1016/s0925-4927(99)00002-5. [DOI] [PubMed] [Google Scholar]
- Tan H-Y, Callicott JH, Weinberger DR. Prefrontal cognitive systems in schizophrenia: towards human genetic brain mechanisms. Cognit Neuropsychiatry. 2009;14:277–98. doi: 10.1080/13546800903091665. [DOI] [PubMed] [Google Scholar]
- Toulopoulou T, Goldberg TE, Mesa IR, Picchioni M, Rijsdijk F, Stahl D, et al. Impaired intellect and memory: a missing link between genetic risk and schizophrenia? Arch Gen Psychiatry. 2010;67:905–13. doi: 10.1001/archgenpsychiatry.2010.99. [DOI] [PubMed] [Google Scholar]
- Toulopoulou T, Grech A, Morris RG, Schulze K, McDonald C, Chapple B, et al. The relationship between volumetric brain changes and cognitive function: a family study on schizophrenia. Biol Psychiatry. 2004;56:447–53. doi: 10.1016/j.biopsych.2004.06.026. [DOI] [PubMed] [Google Scholar]
- Toulopoulou T, Mapua-Filbey F, Kravariti E. London: Routledge; 2008. Maudsley monographs: the Maudsley family study of psychosis—a quest for intermediate phenotypes. [Google Scholar]
- Toulopoulou T, Mapua-Filbey F, Quraishi S, Kravariti E, Morris RG, McDonald C, et al. Cognitive performance in presumed obligate carriers for psychosis. Br J Psychiatry. 2005;187:284–5. doi: 10.1192/bjp.187.3.284. [DOI] [PubMed] [Google Scholar]
- Toulopoulou T, Morris RG, Rabe-Hesketh S, Murray RM. Selectivity of verbal memory deficit in schizophrenic patients and their relatives. Am J Med Genet B Neuropsychiatr Genet. 2003;116B:1–7. doi: 10.1002/ajmg.b.10027. [DOI] [PubMed] [Google Scholar]
- Toulopoulou T, Picchioni M, Rijsdijk F, Hua-Hall M, Ettinger U, Sham P, et al. Substantial genetic overlap between neurocognition and schizophrenia: genetic modeling in twin samples. Arch Gen Psychiatry. 2007;64:1348–55. doi: 10.1001/archpsyc.64.12.1348. [DOI] [PubMed] [Google Scholar]
- van Haren NEM, Picchioni MM, McDonald C, Marshall N, Davis N, Ribchester T, et al. A controlled study of brain structure in monozygotic twins concordant and discordant for schizophrenia. Biol Psychiatry. 2004;56:454–61. doi: 10.1016/j.biopsych.2004.06.033. [DOI] [PubMed] [Google Scholar]
- Volk DW, Lewis DA. Prefrontal cortical circuits in schizophrenia. Curr Top Behav Neurosci. 2010;4:485–508. doi: 10.1007/7854_2010_44. [DOI] [PubMed] [Google Scholar]
- Waters-Metenier S, Toulopoulou T. Putative structural neuroimaging endophenotypes in schizophrenia: a comprehensive review of the current evidence. Future Neurol. 2011;6:679–715. [Google Scholar]
- Wechsler D. New York: Psychological Corporation; 1981. Wechsler Adult Intelligence Scale: Revised Manual. [Google Scholar]
- Weinberger DR. Implications of normal brain development for the pathogenesis of schizophrenia. Arch Gen Psychiatry. 1987;44:660–9. doi: 10.1001/archpsyc.1987.01800190080012. [DOI] [PubMed] [Google Scholar]
- White T, Andreasen NC, Nopoulos P. Brain volumes and surface morphology in monozygotic twins. Cereb Cortex. 2002;12:486–93. doi: 10.1093/cercor/12.5.486. [DOI] [PubMed] [Google Scholar]
- Wible CG, Shenton ME, Fischer IA, Allard JE, Kikinis R, Jolesz FA, et al. Parcellation of the human prefrontal cortex using MRI. Psychiatry Res. 1997;76:29–40. doi: 10.1016/s0925-4927(97)00060-7. [DOI] [PubMed] [Google Scholar]
- Williams RL. A note on robust variance estimation for cluster-correlated data. Biometrics. 2000;56:645–6. doi: 10.1111/j.0006-341x.2000.00645.x. [DOI] [PubMed] [Google Scholar]
- Winkler AM, Kochunov P, Blangero J, Almasy L, Zilles K, Fox PT, et al. Cortical thickness or grey matter volume? The importance of selecting the phenotype for imaging genetics studies. Neuroimage. 2010;53:1135–46. doi: 10.1016/j.neuroimage.2009.12.028. [DOI] [PMC free article] [PubMed] [Google Scholar]
- Wood SJ, Pantelis C, Velakoulis D, Yucel M, Fornito A, Mcgorry PD. Progressive changes in the development toward schizophrenia: studies in subjects at increased symptomatic risk. Schizophr Bull. 2008;34:322–9. doi: 10.1093/schbul/sbm149. [DOI] [PMC free article] [PubMed] [Google Scholar]
- Woodruff PW, Wright IC, Shuriquie N, Russouw H, Rushe T, Howard RJ, et al. Structural brain abnormalities in male schizophrenics reflect fronto-temporal dissociation. Psychol Med. 1997;27:1257–66. doi: 10.1017/s0033291797005229. [DOI] [PubMed] [Google Scholar]
- Wright IC, Sham P, Murray RM, Weinberger DR, Bullmore ET. Genetic contributions to regional variability in human brain structure: methods and preliminary results. Neuroimage. 2002;17:256–71. doi: 10.1006/nimg.2002.1163. [DOI] [PubMed] [Google Scholar]